Basic Harmonic Patterns Dashboard MT5
- インディケータ
- Mehran Sepah Mansoor
- バージョン: 2.0
- アップデート済み: 20 4月 2024
- アクティベーション: 10
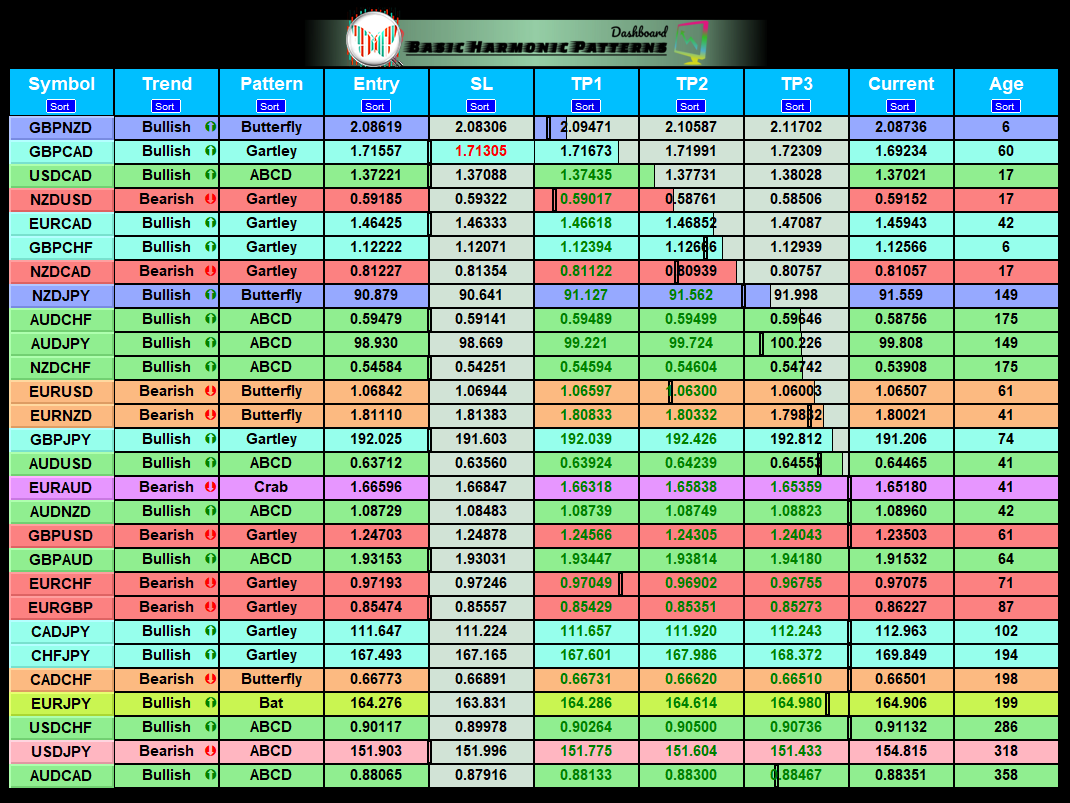
このダッシュボードは、選択されたシンボルの最新の利用可能なハーモニックパターンを表示するので、時間を節約し、より効率的に / MT4バージョン。
インジケーター列
- Symbol:選択したシンボルが表示されます。
- Trend: 強気または弱気
- Pattern:パターンの種類(ガートレー、バタフライ、バット、カニ、サメ、サイファー、ABCD)
- Entry:エントリー価格
- SL:ストップロス価格
- TP1:1回目の利食い価格
- TP2:2回目の利食い価格
- TP3: 3回目の利食い価格
- Current price: 現在値
- Age (in bars): 最後に描画されたパターンの年齢
主な入力項目
- Symbols: "28 Major Currency Pairs "または "Selected Symbols "から選択。
- Selected Symbols: カンマで区切られた監視したいシンボル("EURUSD,GBPUSD,XAUUSD")。ブローカーがペアに接尾辞または接頭辞を付けている場合は、次の2つのパラメータ(ペア接頭辞またはペア接尾辞)にそれを追加する必要があります。
- Max Iteration: パターンを調整するための最大反復回数 (この値が低い場合、より少ないパターンでより速いパフォーマンスが得られ、高い場合、より多くのパターンでより遅いパフォーマンスが得られます)。この値が200の場合、インジケータは直近の200パターンをチェックし、それ以上はチェックしません。50の場合は、直近の50パターンのみをチェックします。
- Max allowed deviation (%): このパラメータは、ハーモニックパターンの形成に許容される 許 容 範 囲 を 指 し ま す 。このパラメー タは、インジケータが有効な形成として破棄することなく、ハーモニック パターンの構造がどの程度変化するかを決定する。したがって、パーセンテージを高く設定すると、パターン識別に柔軟性が増し、低い値を設定すると、より制限的になります。例: 値を30%に設定した場合、インジケータは、現在の価格の±30% の範囲内でパターンの比率に適合するフォーメーションを有効なフォーメーションと見なします。
- Depth: このパラメータは、ハーモニックパターンの各波動に存在する、最 小のバー数を決定します。つまり、インジケータが波として認識するためには、上昇または下降の動きの中にいくつのバーが存在しなければなりません。数値が高いほど長いパターンを意味し、逆もまた同様です。
- Deviation: 乖離とは、波の2つの振動(ピークまたはトラフ)の間の価格の最大許容乖離 量を指します。したがって、偏差が大きいほど、ピークまたは谷の価格差に大きなマージンを許容することになります。
- Backstep: このパラメータは、あるポイントが有効な高値または安値であ るかどうかを判断するために、インディケータが何本後ろのバーを 探すかを指定します。言い換えれば、ジグザグ線をプロットする際に、何本後方のバー を考慮するかを示します。
- Pop-up alert: MT5ターミナルへのアラート。
- Email alert:Eメールアラート。
- Push notification alert:電話へのアラート。
*その他の入力は、色と透明度のカスタマイズに関係します*
使用方法
ダッシュボードを好きな列で並べ替えることができ、そのグラフにパターンを表示することもできます(下のビデオを参照)。
重要: マルチペアインジケーター/ExpertはMT4ストラテジーテスターではテストできません。
ご注意 8番目の入力で、インジケーターを再描画するか、遅延させるかを選択できます。遅延に設定した場合、インジケータはパターン形成後にシグナルを調整しません。このオプションは、誤ったシグナルを避け、トレードの一貫性を高めたいトレー ダーには好ましいでしょう。ただし、遅延させたインジケータは、市場の急激な変化に対応する感度と能力を失う可能性があることに注意する必要があります。


GREAT product. was able to make profits same day as purchase. very verse indicator with lots of GOODIES. support system is also 10 out of 10.