Basic Harmonic Patterns Dashboard MT5
- Indikatoren
- Mehran Sepah Mansoor
- Version: 2.0
- Aktualisiert: 20 April 2024
- Aktivierungen: 10
Dieses Dashboard zeigt die neuesten verfügbaren harmonischen Muster für die ausgewählten Symbole, so dass Sie Zeit sparen und effizienter sein werden / MT4-Version.
Kostenloser Indikator: Basic Harmonic Pattern
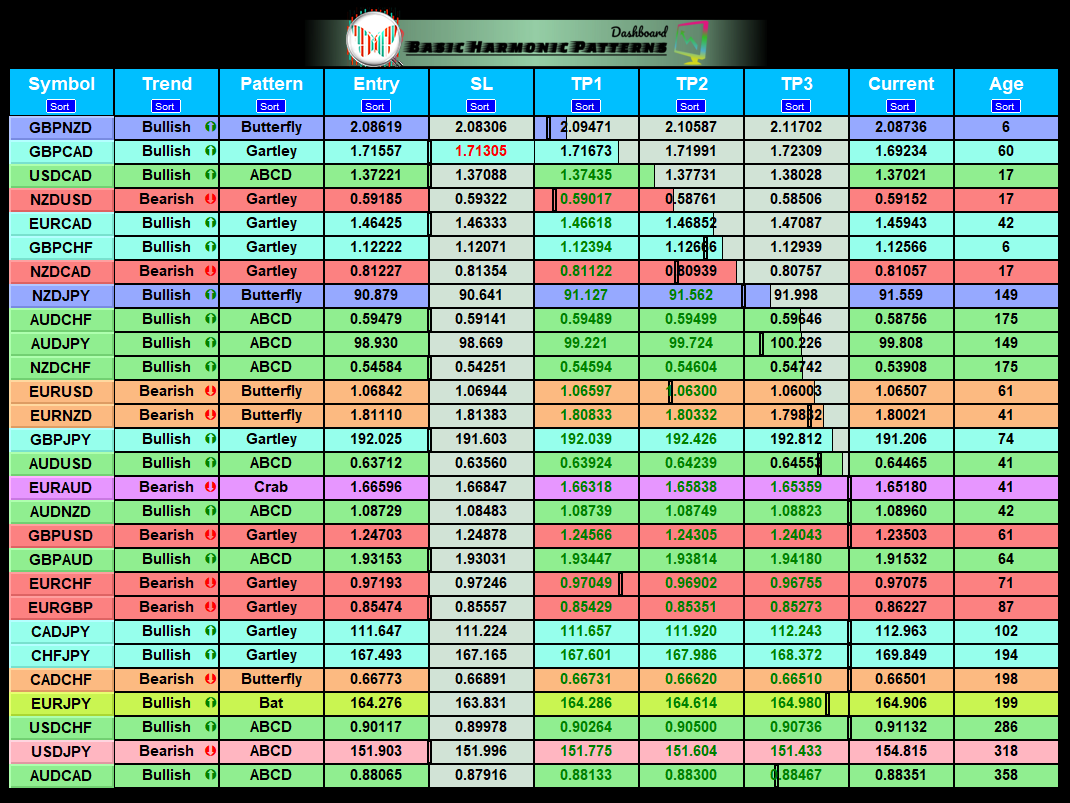
Spalten des Indikators
- Symbol: die ausgewählten Symbole werden angezeigt
- Trend: bullish oder bearish
- Pattern: Art des Musters (Gartley, Schmetterling, Fledermaus, Krabbe, Hai, Cypher oder ABCD)
- Entry: Einstiegskurs
- SL: Stop-Loss-Kurs
- TP1: 1. Take-Profit-Kurs
- TP2: 2. Gewinnmitnahme-Kurs
- TP3: 3. Take-Profit-Kurs
- Current price: aktueller Preis
- Age (in bars): Alter des zuletzt gezeichneten Musters
Wichtigste Eingaben
- Symbols: Wählen Sie aus "28 Hauptwährungspaare" oder "Ausgewählte Symbole".
- Selected Symbols: die gewünschten Symbole, die Sie überwachen möchten, getrennt durch ein Komma ("EURUSD,GBPUSD,XAUUSD"). Wenn Ihr Broker ein Suffix oder Präfix für die Paare hat, müssen Sie es in den beiden folgenden Parametern hinzufügen (Paar-Präfix oder Paar-Suffix).
- Max Iteration: die maximale Anzahl der Iterationen zur Abstimmung eines Musters (bei einem niedrigeren Wert erhalten Sie eine schnellere Leistung mit weniger Mustern, während ein höherer Wert zu einer langsameren Leistung mit mehr Mustern führt). Wenn der Wert 200 ist, prüft der Indikator die letzten 200 Muster und nicht mehr. Wenn der Wert 50 ist, werden nur die letzten 50 Muster geprüft.
- Max allowed deviation (%): Dieser Parameter bezieht sich auf die zulässige Toleranz bei der Bildung eines harmonischen Musters. Dieser Parameter bestimmt, wie stark die Struktur des harmonischen Musters variieren kann, ohne dass der Indikator es als gültige Formation verwirft. Die Einstellung eines höheren Prozentsatzes würde also eine größere Flexibilität bei der Mustererkennung ermöglichen, während ein niedrigerer Wert restriktiver wäre. Beispiel: Wenn Sie einen Wert von 30 % einstellen, betrachtet der Indikator alle Formationen als gültig, die den Proportionen des Musters innerhalb eines Bereichs von ±30 % des aktuellen Preises entsprechen.
- Depth: Dieser Parameter bestimmt die Mindestanzahl von Takten, die in jeder Welle des harmonischen Musters vorhanden sein müssen, damit es als solches betrachtet wird. Das heißt, wie viele Balken müssen in der Aufwärts- oder Abwärtsbewegung vorhanden sein, damit der Indikator sie als Welle erkennt. Höhere Werte bedeuten längere Muster und umgekehrt.
- Deviation: Die Abweichung bezieht sich auf die maximale Abweichung, die der Preis zwischen den beiden Oszillationen (Höchst- oder Tiefstwerten) einer Welle haben darf, um noch als gültig zu gelten. Eine höhere Abweichung erlaubt also eine größere Spanne zwischen den Preisen der Spitzen oder Täler.
- Backstep: Dieser Parameter gibt an, wie viele Takte rückwärts der Indikator sucht, um festzustellen, ob ein Punkt ein gültiges Hoch oder Tief ist. Mit anderen Worten, er gibt an, wie viele rückwärts gerichtete Takte bei der Darstellung der Zickzacklinie berücksichtigt werden sollen.
- Pop-up alert: Alarm auf dem MT5-Terminal.
- Email alert: Benachrichtigung per E-Mail.
- Push notification alert: Benachrichtigung auf dem Telefon.
*Die anderen Eingaben haben mit der Anpassung von Farben und Transparenzen zu tun*
Wie man es benutzt
Sie können das Dashboard nach der gewünschten Spalte sortieren, und Sie können auch das Muster auf dem Diagramm anzeigen (siehe das Video unten).
Wichtiger Hinweis: Multi-Pair Indicator/Expert kann nicht mit dem MT4 Strategy Tester getestet werden (Sie können die MT5-Version testen, um die Leistung des Rankings zu sehen).
Achtung!: Über die achte Eingabe können Sie wählen, ob der Indikator neu gezeichnet werden soll oder eine Verzögerung haben soll. Wenn Sie die Verzögerung einstellen, passt der Indikator sein Signal nicht an, nachdem sich das Muster gebildet hat. Diese Option ist möglicherweise für Händler vorzuziehen, die falsche Signale vermeiden wollen und eine größere Beständigkeit bei ihren Geschäften wünschen. Es sollte jedoch beachtet werden, dass ein verzögerter Indikator an Sensibilität und an der Fähigkeit, sich an schnelle Veränderungen im Markt anzupassen, verlieren kann.


GREAT product. was able to make profits same day as purchase. very verse indicator with lots of GOODIES. support system is also 10 out of 10.