Basic Harmonic Patterns Dashboard MT5
- Indicatori
- Mehran Sepah Mansoor
- Versione: 2.0
- Aggiornato: 20 aprile 2024
- Attivazioni: 10
Questo cruscotto mostra gli ultimi pattern armonici disponibili per i simboli selezionati, in modo da risparmiare tempo ed essere più efficienti / versione MT4.
Indicatore gratuito: Schema armonico di base
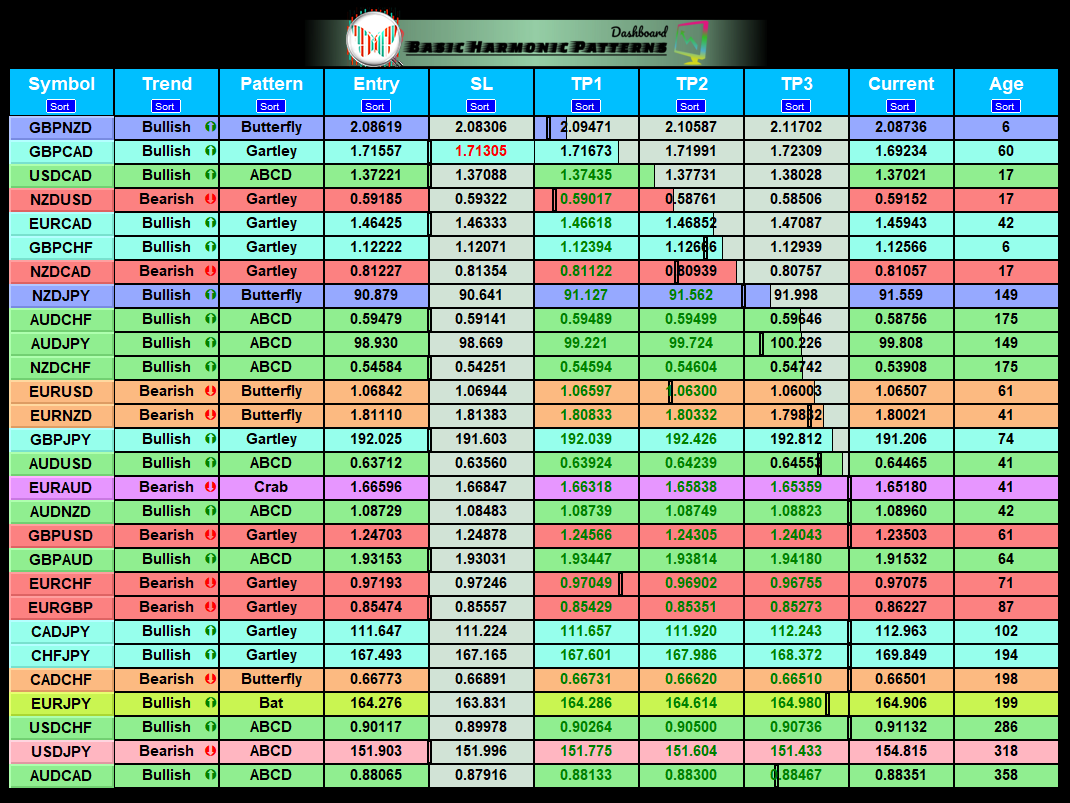
Colonne dell'indicatore
- Simbolo: vengono visualizzati i simboli selezionati
- Trend: rialzista o ribassista
- Pattern: tipo di pattern (gartley, butterfly, bat, crab, shark, cypher o ABCD)
- Entry: prezzo di ingresso
- SL: prezzo di stop loss
- TP1: 1° prezzo di take profit
- TP2: 2° prezzo di take profit
- TP3: 3° prezzo di take profit
- Prezzo corrente: prezzo corrente
- Età (in barre): età dell'ultimo pattern disegnato
Ingressi principali
- Simboli: selezionare da "28 coppie di valute principali" o "Simboli selezionati".
- Simboli selezionati: simboli desiderati da monitorare separati da una virgola ("EURUSD,GBPUSD,XAUUSD"). Se il vostro broker ha un suffisso o un prefisso per le coppie, dovete aggiungerlo nei due parametri seguenti (Prefisso della coppia o Suffisso della coppia).
- Max Iteration: il numero massimo di iterazioni per sintonizzare un pattern (se il valore è inferiore, si otterranno prestazioni più rapide con un minor numero di pattern, mentre un valore più alto comporterà prestazioni più lente con un maggior numero di pattern). Di fatto, funziona come segue: se il valore è 200, l'indicatore controlla gli ultimi 200 pattern e non di più. Se il valore è 50, l'indicatore controllerà solo gli ultimi 50 pattern.
- Deviazione massima consentita (%): questo parametro si riferisce alla tolleranza consentita per la formazione di un pattern armonico. Questo parametro determina di quanto può variare la struttura del pattern armonico senza che l'indicatore lo scarti come formazione valida. Pertanto, l'impostazione di una percentuale più alta consente una maggiore flessibilità nell'identificazione del pattern, mentre un valore più basso è più restrittivo. Ad esempio, se si imposta un valore del 30%, l'indicatore considererà valide le formazioni che si adattano alle proporzioni del pattern entro un intervallo di ±30% del prezzo corrente.
- Profondità: questo parametro determina il numero minimo di barre che devono essere presenti in ogni onda del pattern armonico perché sia considerato tale. Ovvero, quante barre devono essere presenti nel movimento al rialzo o al ribasso perché l'indicatore lo riconosca come onda. Valori più alti implicano pattern più lunghi e viceversa.
- Deviazione: la deviazione si riferisce alla quantità massima di scostamento consentita nel prezzo tra le due oscillazioni (picchi o avvallamenti) di un'onda per essere ancora considerata valida. Pertanto, una deviazione più elevata consentirà un maggiore margine di differenza tra i prezzi dei picchi o delle valli.
- Backstep: questo parametro specifica quante barre indietro l'indicatore cercherà per determinare se un punto è un massimo o un minimo valido. In altre parole, indica quante barre indietro considerare quando si traccia la linea a zigzag.
- Avviso pop-up: avviso al terminale MT5.
- Avviso via e-mail: avviso via e-mail.
- Avviso di notifica push: avviso al telefono.
*Gli altri input hanno a che fare con la personalizzazione dei colori e delle trasparenze*.
Come utilizzarlo
È possibile ordinare la dashboard in base alla colonna desiderata e visualizzare il pattern sul grafico (vedere il video qui sotto).
Nota importante: l'indicatore Multi-Pair/Expert non può essere testato dal tester di strategia MT4 (è possibile testare la versione MT5 per vedere le prestazioni della classifica).
Attenzione: Utilizzando l'ottavo input è possibile scegliere se l'indicatore deve ridipingere o avere un ritardo. Se si imposta un ritardo, l'indicatore non modificherà il suo segnale dopo la formazione del pattern. Questa opzione può essere preferibile per i trader che vogliono evitare falsi segnali e desiderano una maggiore coerenza nelle loro operazioni. Tuttavia, va notato che un indicatore ritardato può perdere sensibilità e capacità di adattarsi ai rapidi cambiamenti del mercato.


GREAT product. was able to make profits same day as purchase. very verse indicator with lots of GOODIES. support system is also 10 out of 10.