Basic Harmonic Patterns Dashboard MT5
- Indicators
- Mehran Sepah Mansoor
- Version: 4.2
- Updated: 16 June 2024
- Activations: 10
This dashboard shows the latest available harmonic patterns for the selected symbols, so you will save time and be more efficient / MT4 version.
Free Indicator: Basic Harmonic Pattern
Comparison of "Basic Harmonic Pattern" vs. "Basic Harmonic Patterns Dashboard" Indicators
| Feature | Basic Harmonic Pattern | Basic Harmonic Patterns Dashboard |
|---|---|---|
| Functionality | Detects and displays harmonic patterns on a single chart | Searches multiple symbols and timeframes for harmonic patterns, displays results on a dashboard |
| Supported Symbols | Single symbol at a time | Multiple symbols simultaneously |
| Supported Timeframes | Single timeframe at a time | Multiple timeframes simultaneously |
| User Interface | Basic chart display with pattern markings | Advanced, interactive dashboard with summary and details of patterns across symbols and timeframes |
| Notification System | Alerts for detected patterns on the current chart | Alerts for detected patterns across all monitored symbols and timeframes |
| Customization Options | Basic customization (e.g., pattern types, sensitivity) | Extensive customization (e.g., symbols, timeframes, pattern types, alert settings) |
| Performance Impact | Light impact on terminal due to single symbol/timeframe analysis | Higher impact on terminal due to multi-symbol, multi-timeframe analysis |
| Ease of Use | Simple to use for traders focused on one symbol/timeframe | Requires configuration but provides a broader market overview |
| Application | Suitable for traders focusing on specific symbols or timeframes | Ideal for traders who need to monitor multiple markets simultaneously for trading opportunities |
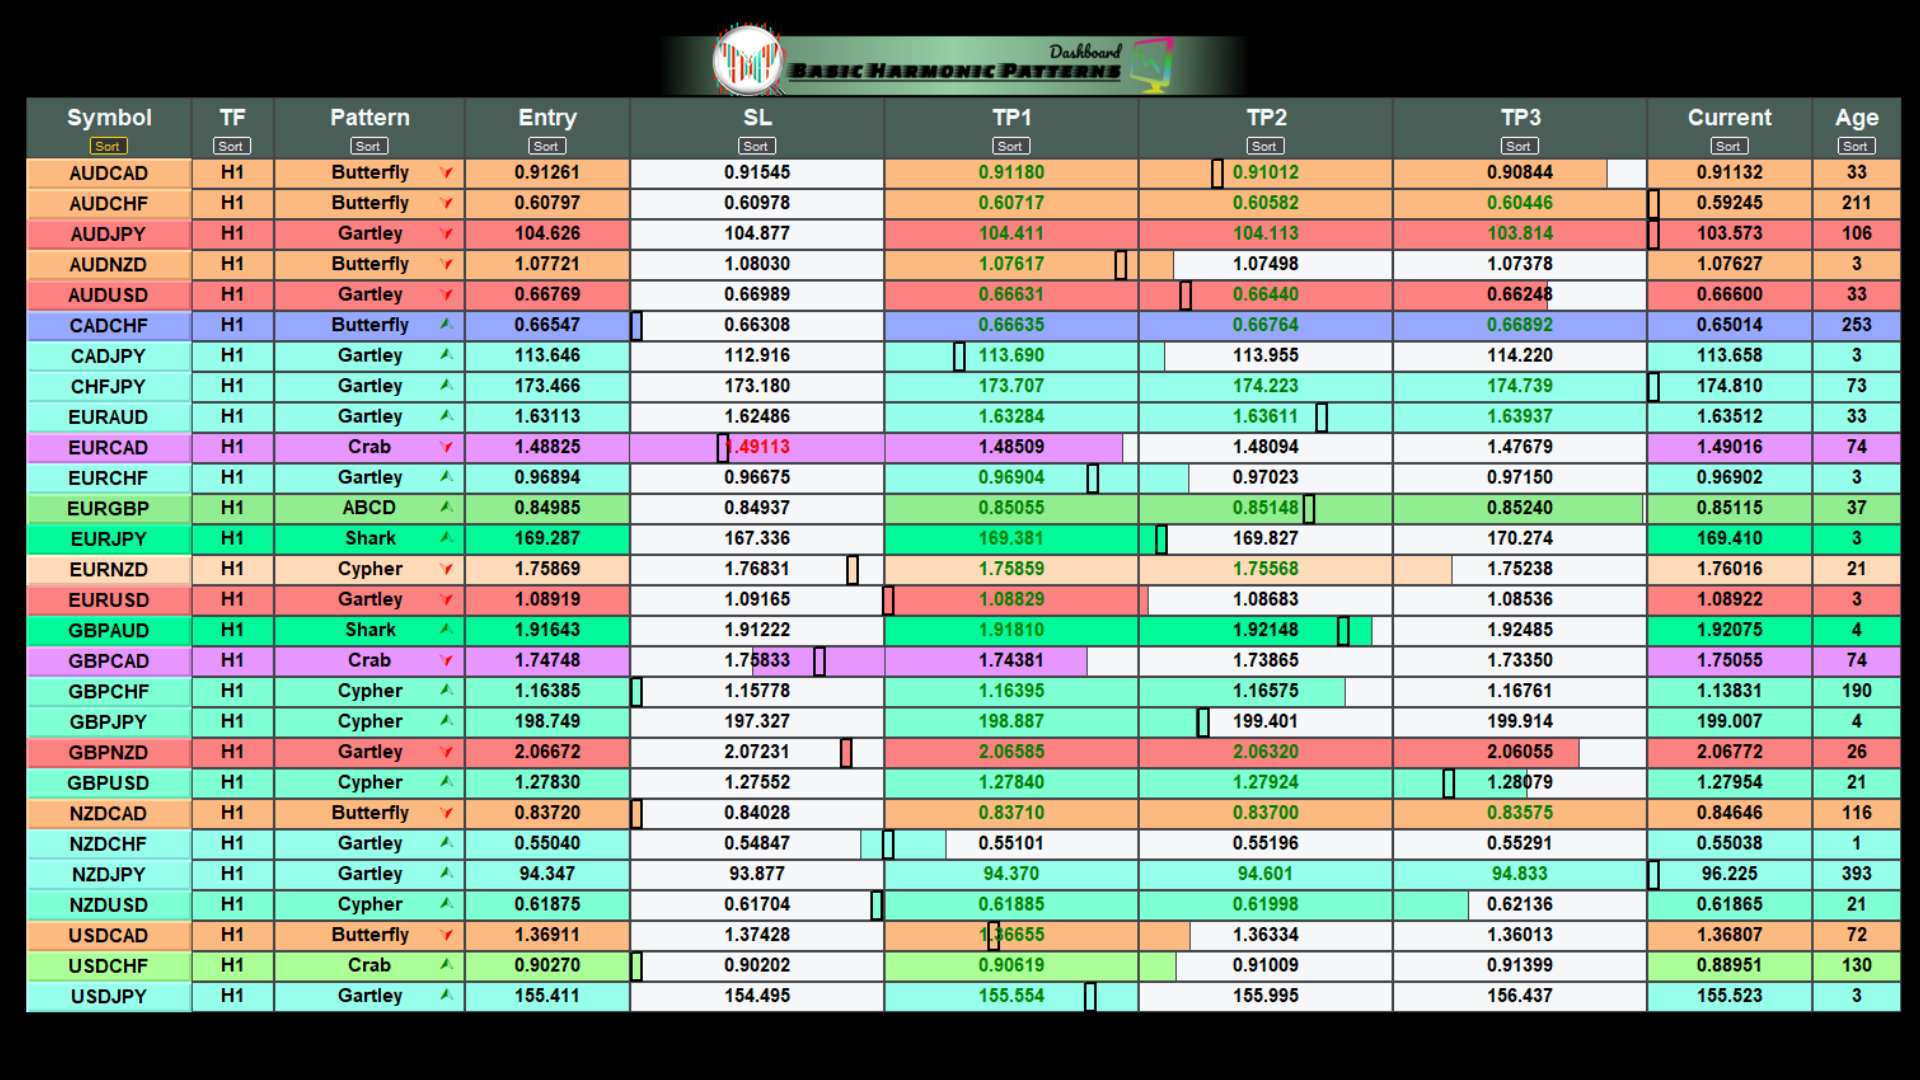
Indicator columns
- Symbol: the selected symbols will appear
- Trend: bullish or bearish
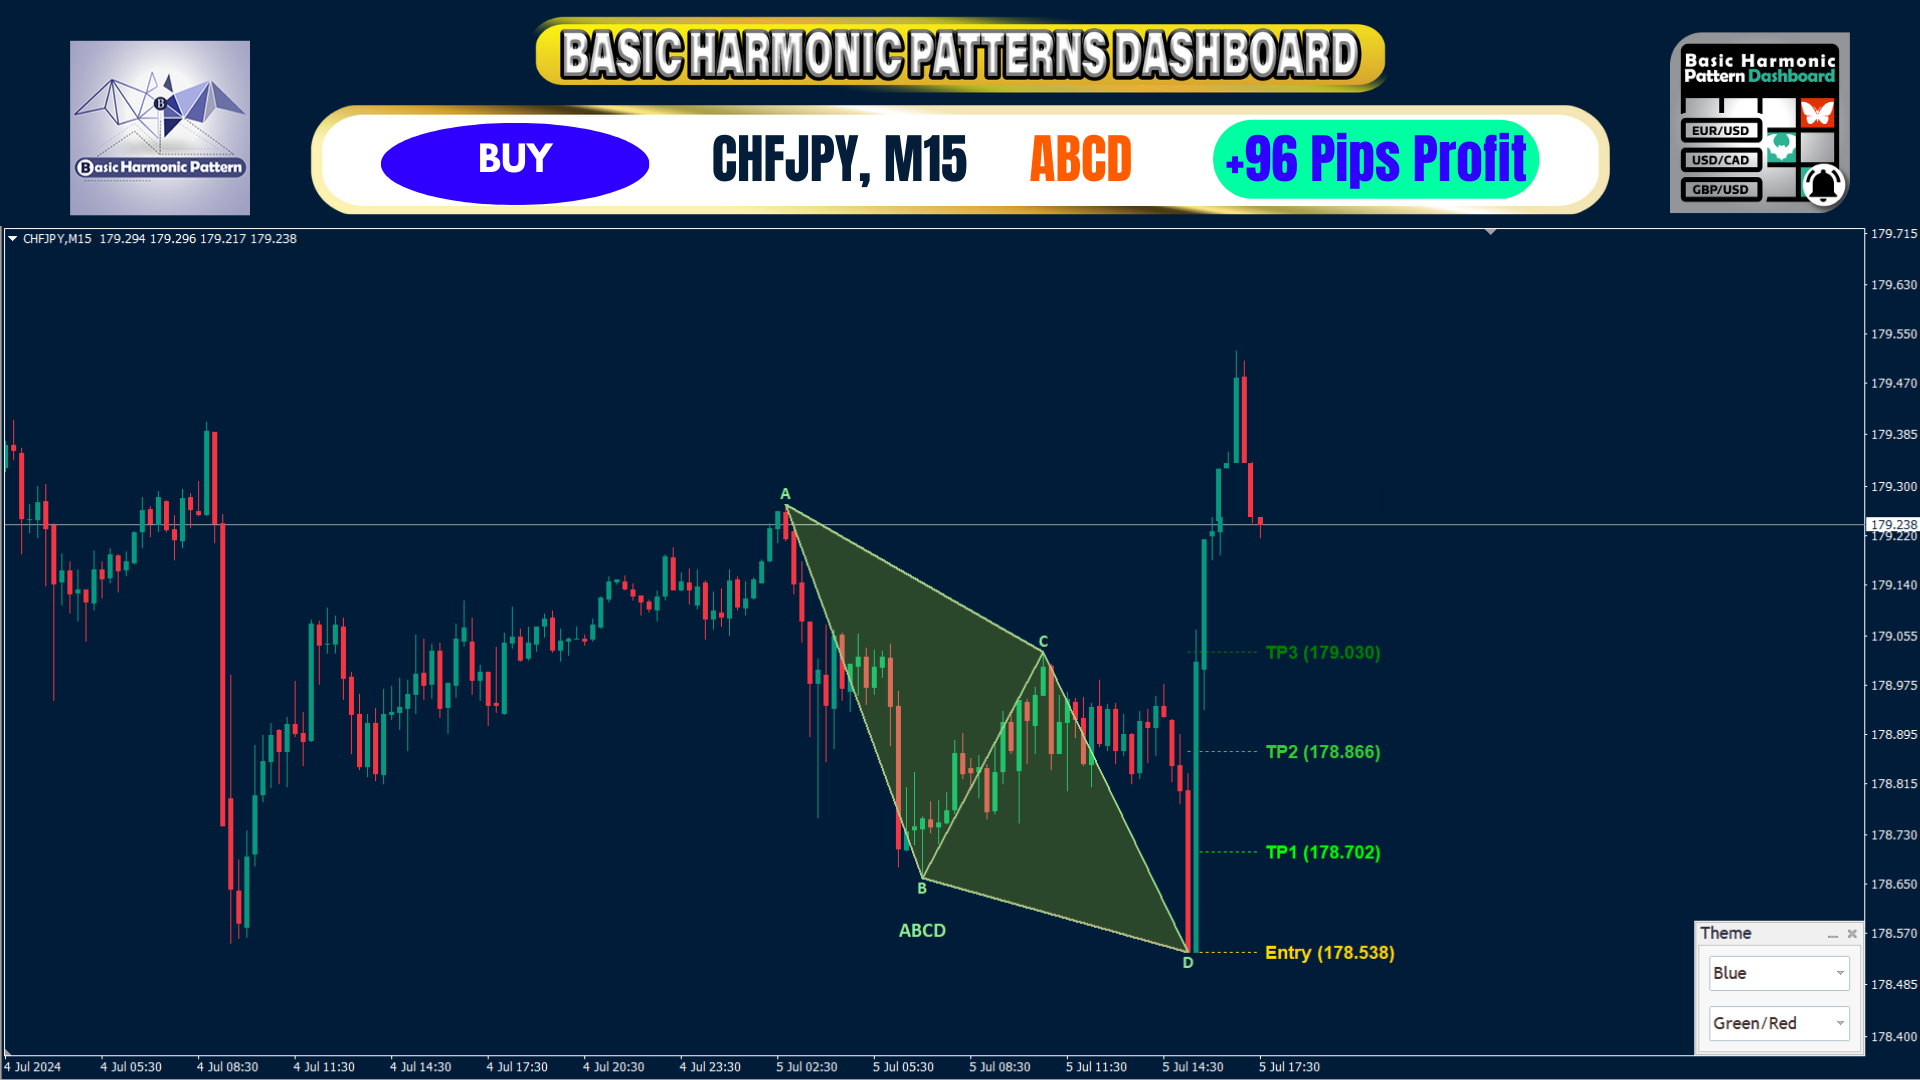
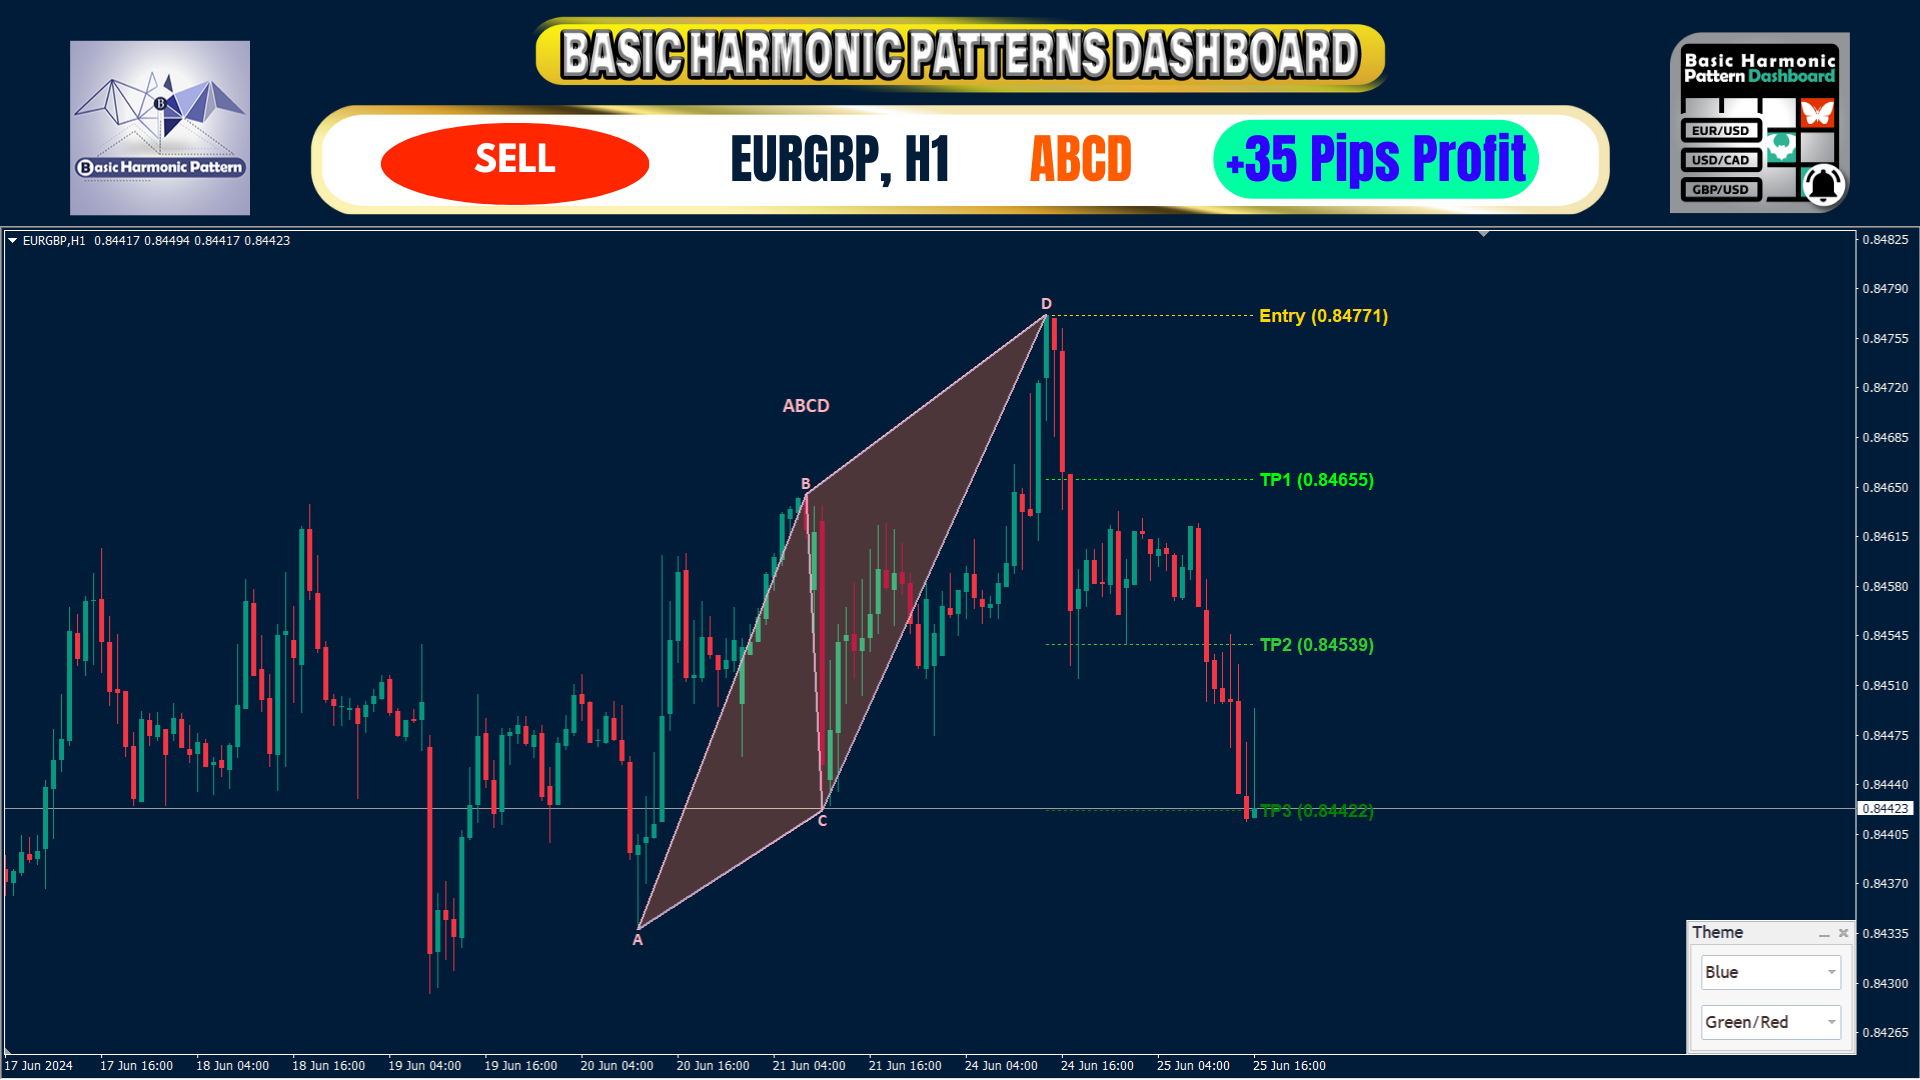
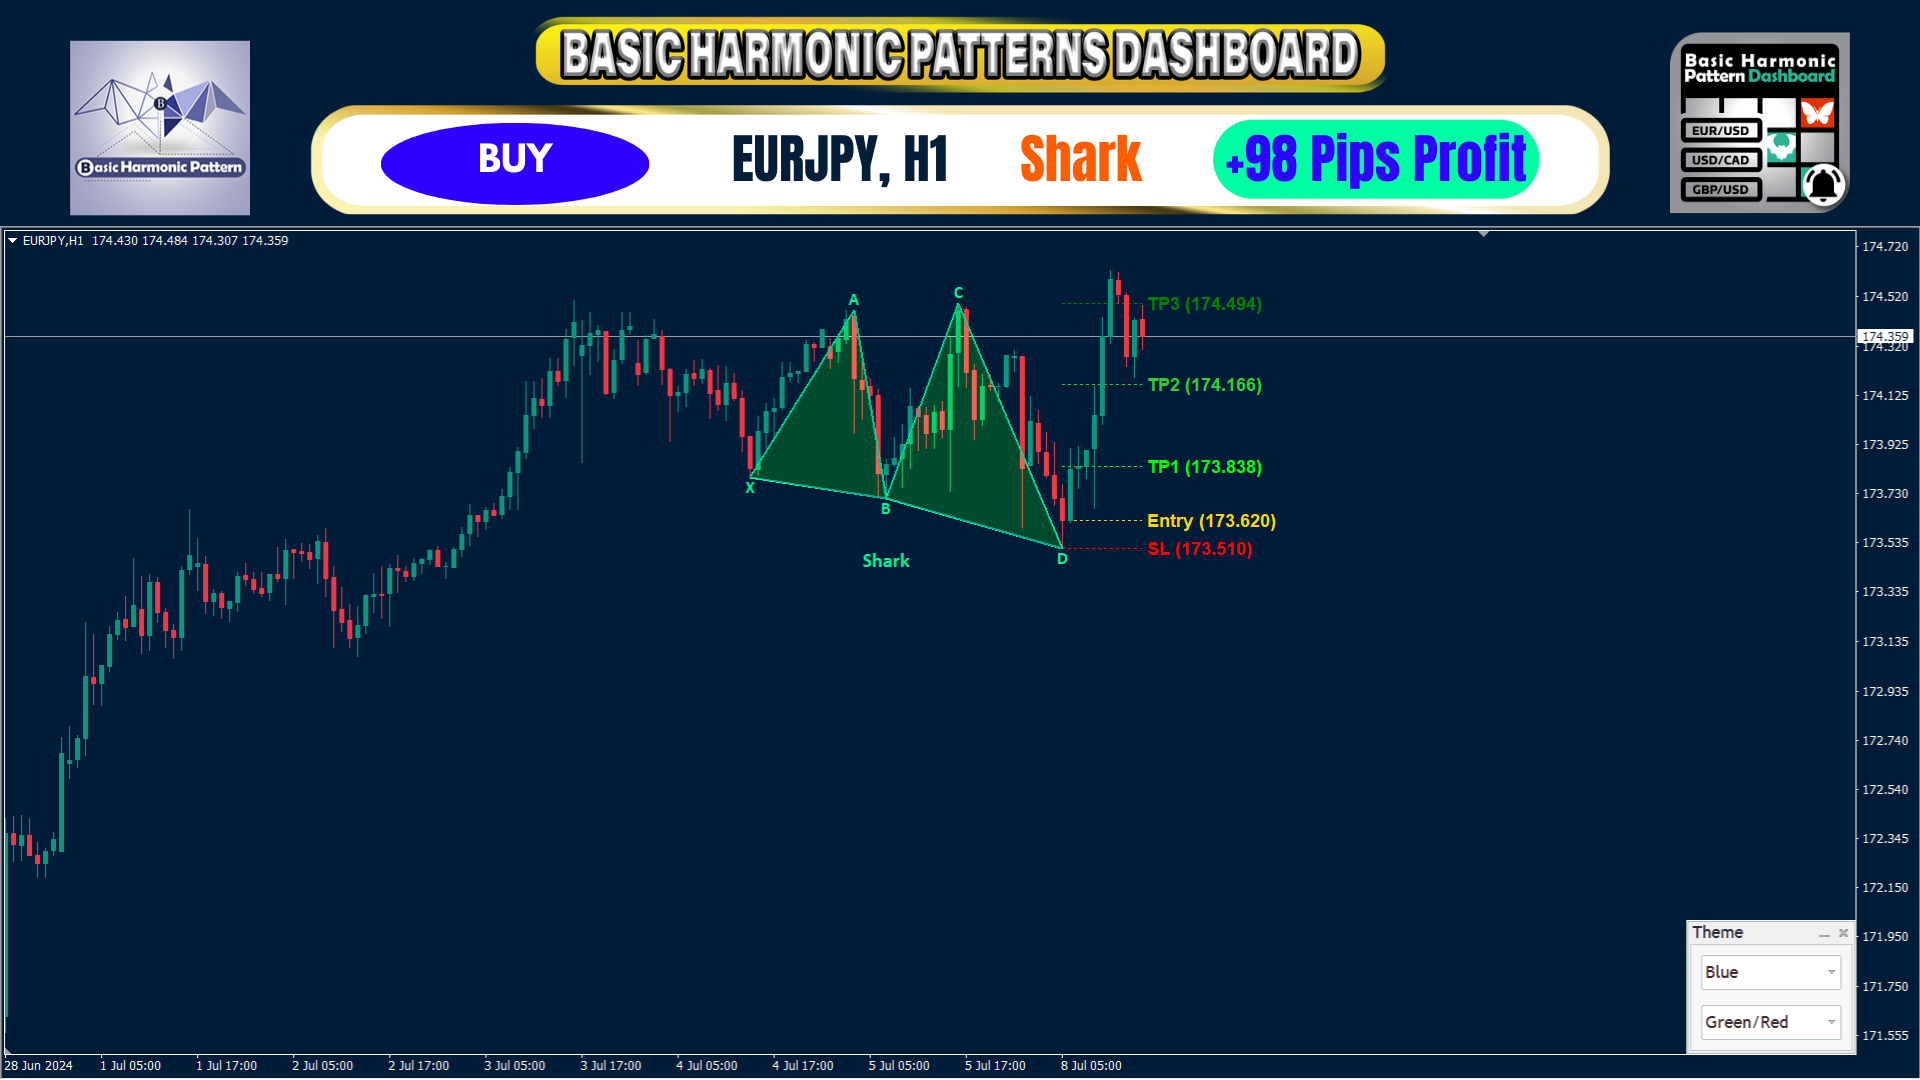
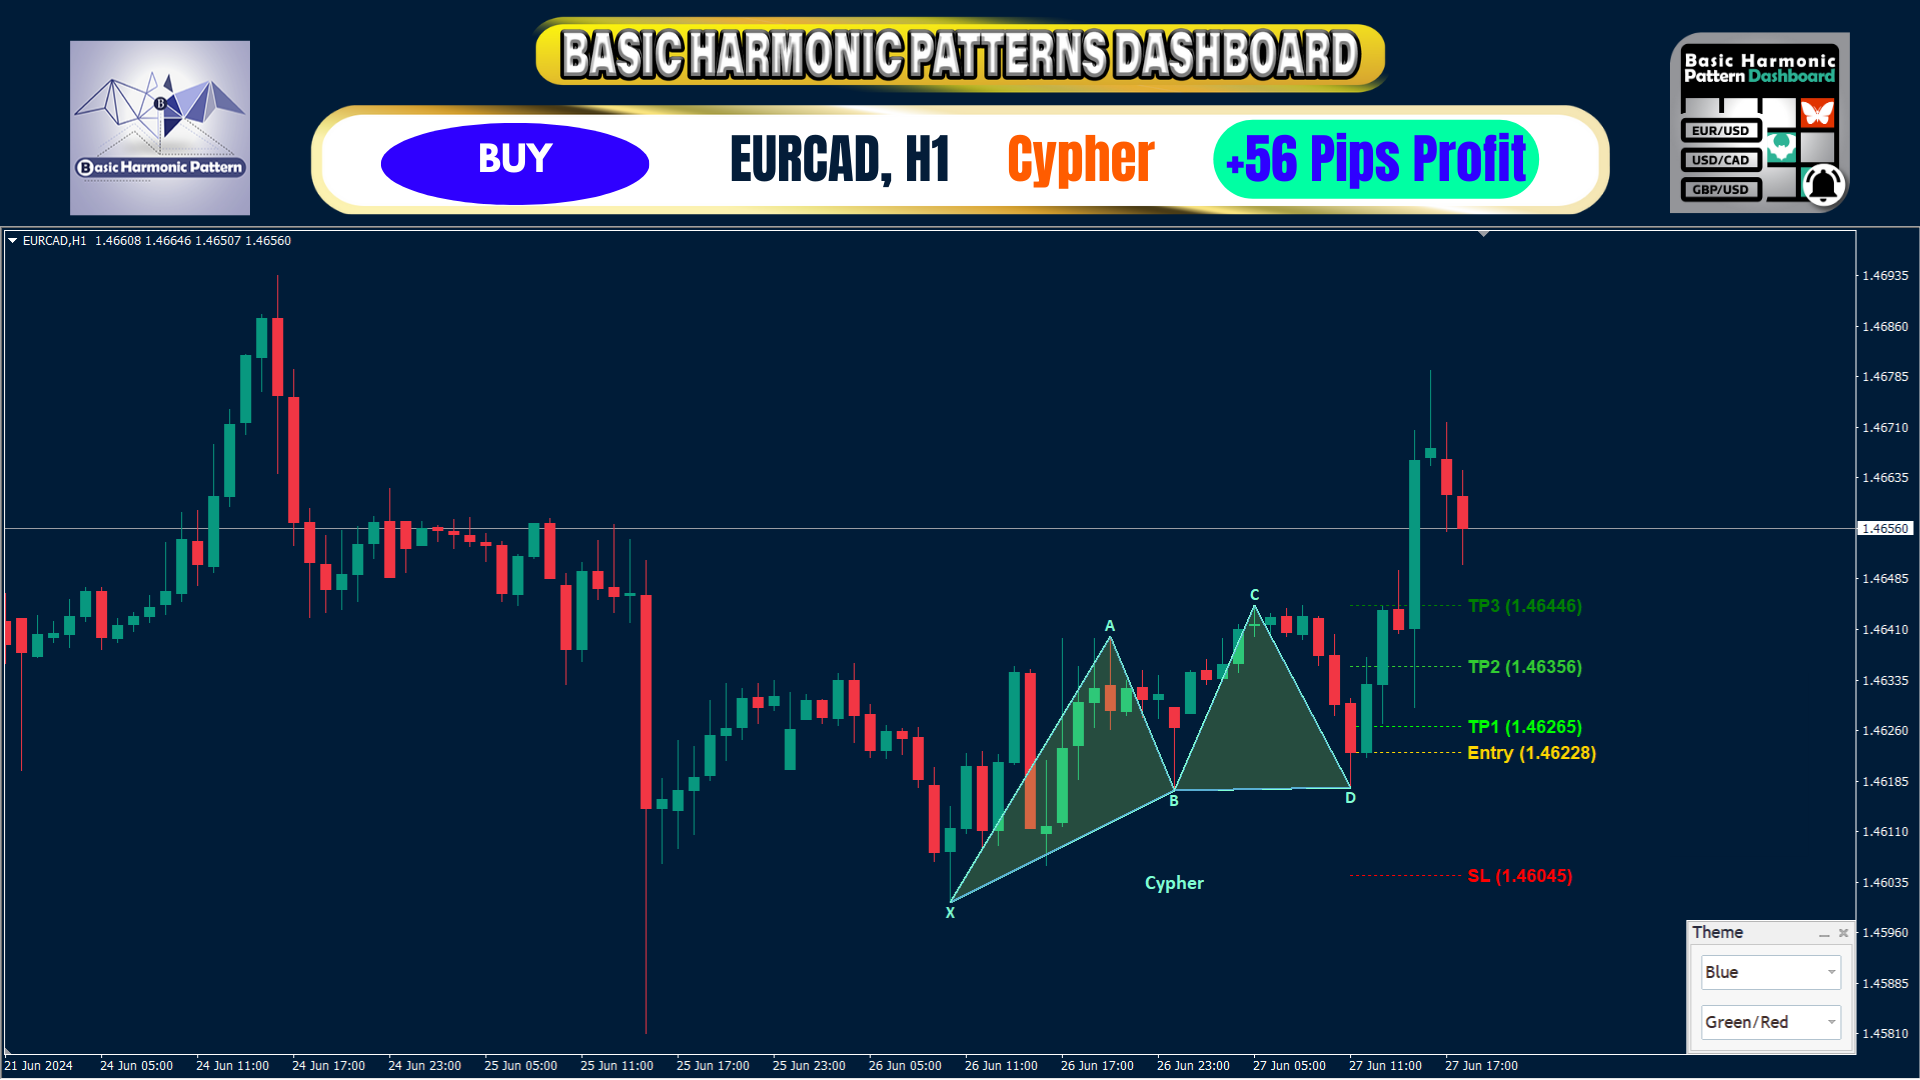
- Pattern: type of pattern (gartley, butterfly, bat, crab, shark, cypher or ABCD)
- Entry: entry price
- SL: stop loss price
- TP1: 1st take profit price
- TP2: 2nd take profit price
- TP3: 3rd take profit price
- Current price: current price
- Age (in bars): age of the last pattern drawn
Main Inputs
- Symbols: select from "28 Major Currency Pairs" or "Selected Symbols".
- Selected Symbols: desired symbols which you want to monitor separated by comma ("EURUSD,GBPUSD,XAUUSD"). If your broker has a suffix or prefix on the pairs, you must add it in the two following parameters (Pair prefix or Pair suffix).
- Max Iteration: the maximum number of iterations to tune a pattern (if the value is lower then you will have faster performance with fewer patterns while a higher value will result in slower performance with more patterns). In fact, it works as follows: if the value is 200, then the indicator checks the last 200 patterns and no more. If it is 50, it will only check the last 50 patterns.
- Max allowed deviation (%): this parameter refers to the tolerance allowed for the formation of a harmonic pattern. This parameter determines how much the structure of the harmonic pattern can vary without the indicator discarding it as a valid formation. Thus, setting a higher percentage would allow more flexibility in pattern identification, while a lower value would be more restrictive. For example: if you set a value of 30% then the indicator will consider as valid formations that fit the proportions of the pattern within a range of ±30% of the current price.
- Depth: this parameter determines the minimum number of bars that must be present in each wave of the harmonic pattern for it to be considered as such. That is, how many bars must be present in the upward or downward movement for the indicator to recognize it as a wave. Higher values imply longer patterns and vice versa.
- Deviation: deviation refers to the maximum amount of deviation allowed in price between the two oscillations (peaks or troughs) of a wave to still be considered valid. Therefore, a higher deviation will allow a greater margin of difference between the prices of the peaks or valleys.
- Backstep: this parameter specifies how many bars backwards the indicator will look for to determine whether a point is a valid high or low. In other words, it indicates how many backward bars to consider when plotting the zigzag line.
- Pop-up alert: alert to the MT5 terminal.
- Email alert: email alert.
- Push notification alert: alert to phone.
*The other inputs have to do with the customization of colors and transparencies*
How to use it
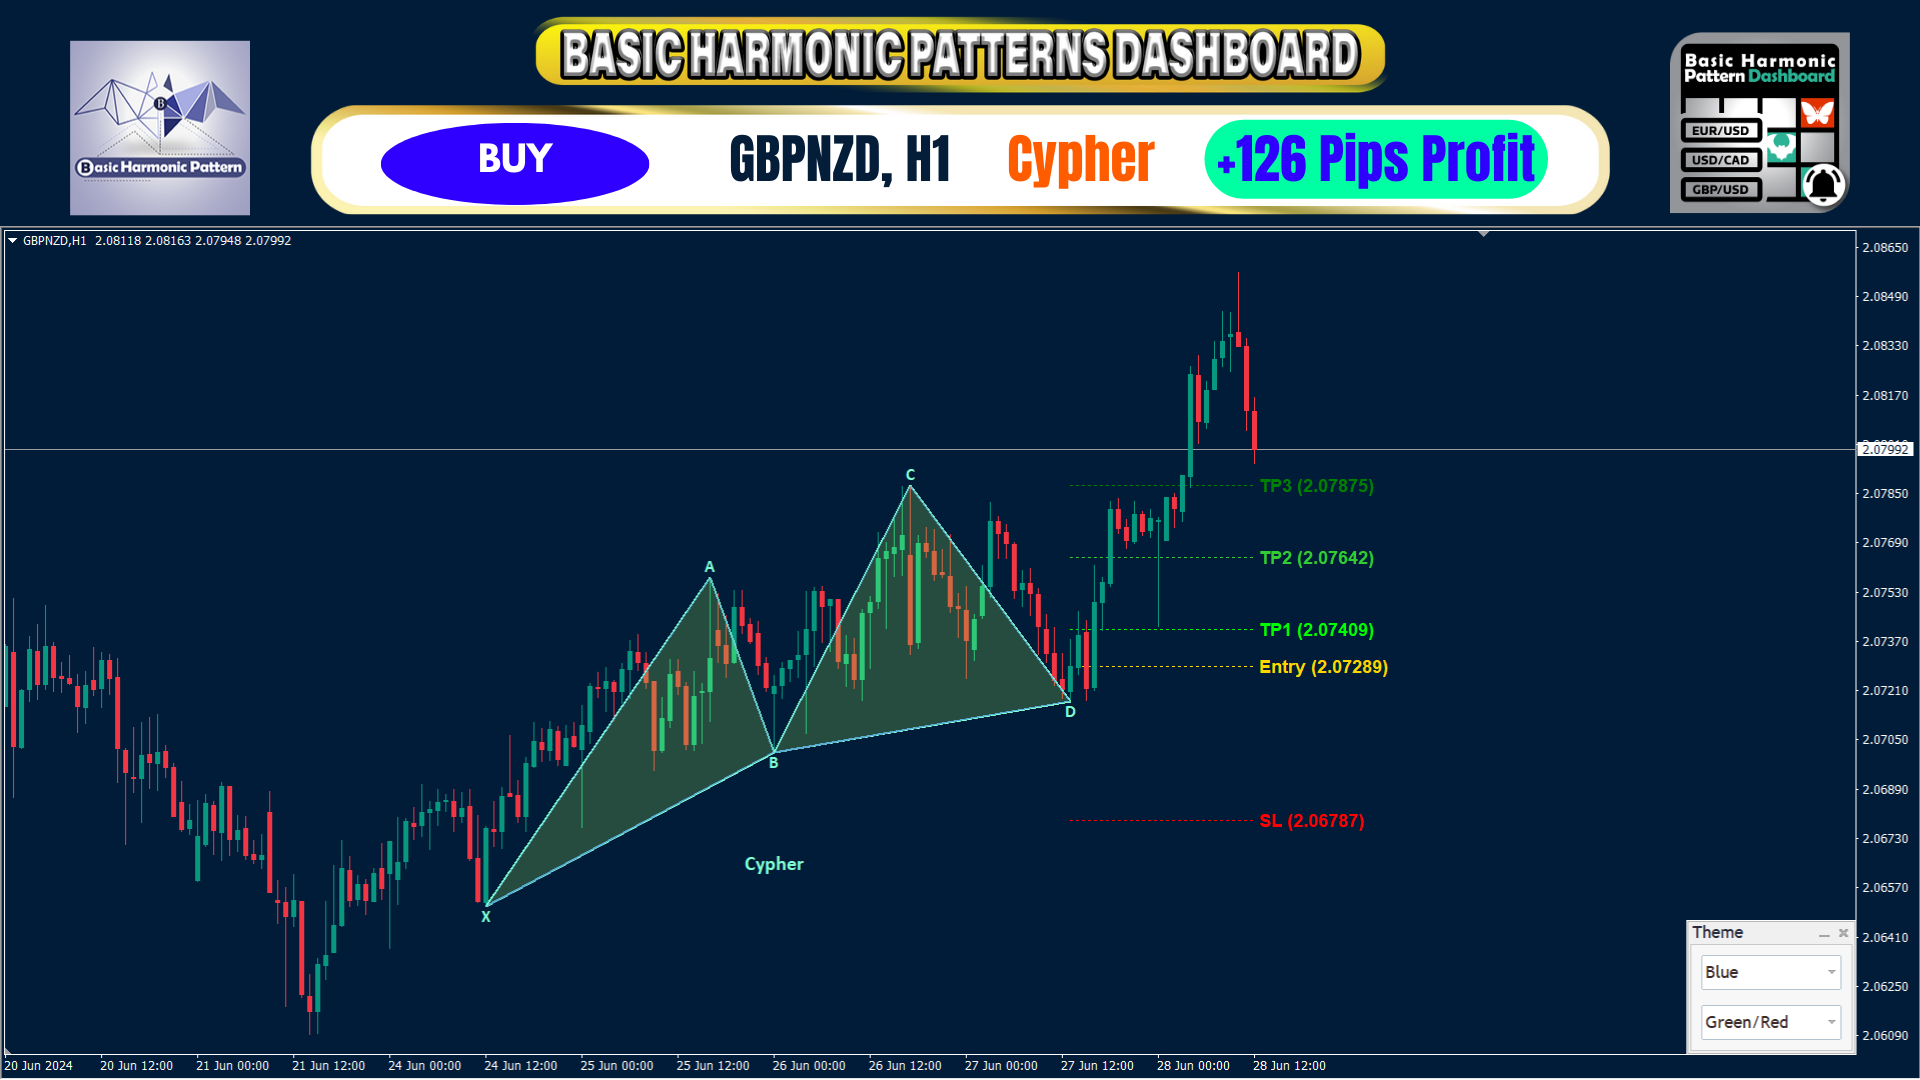
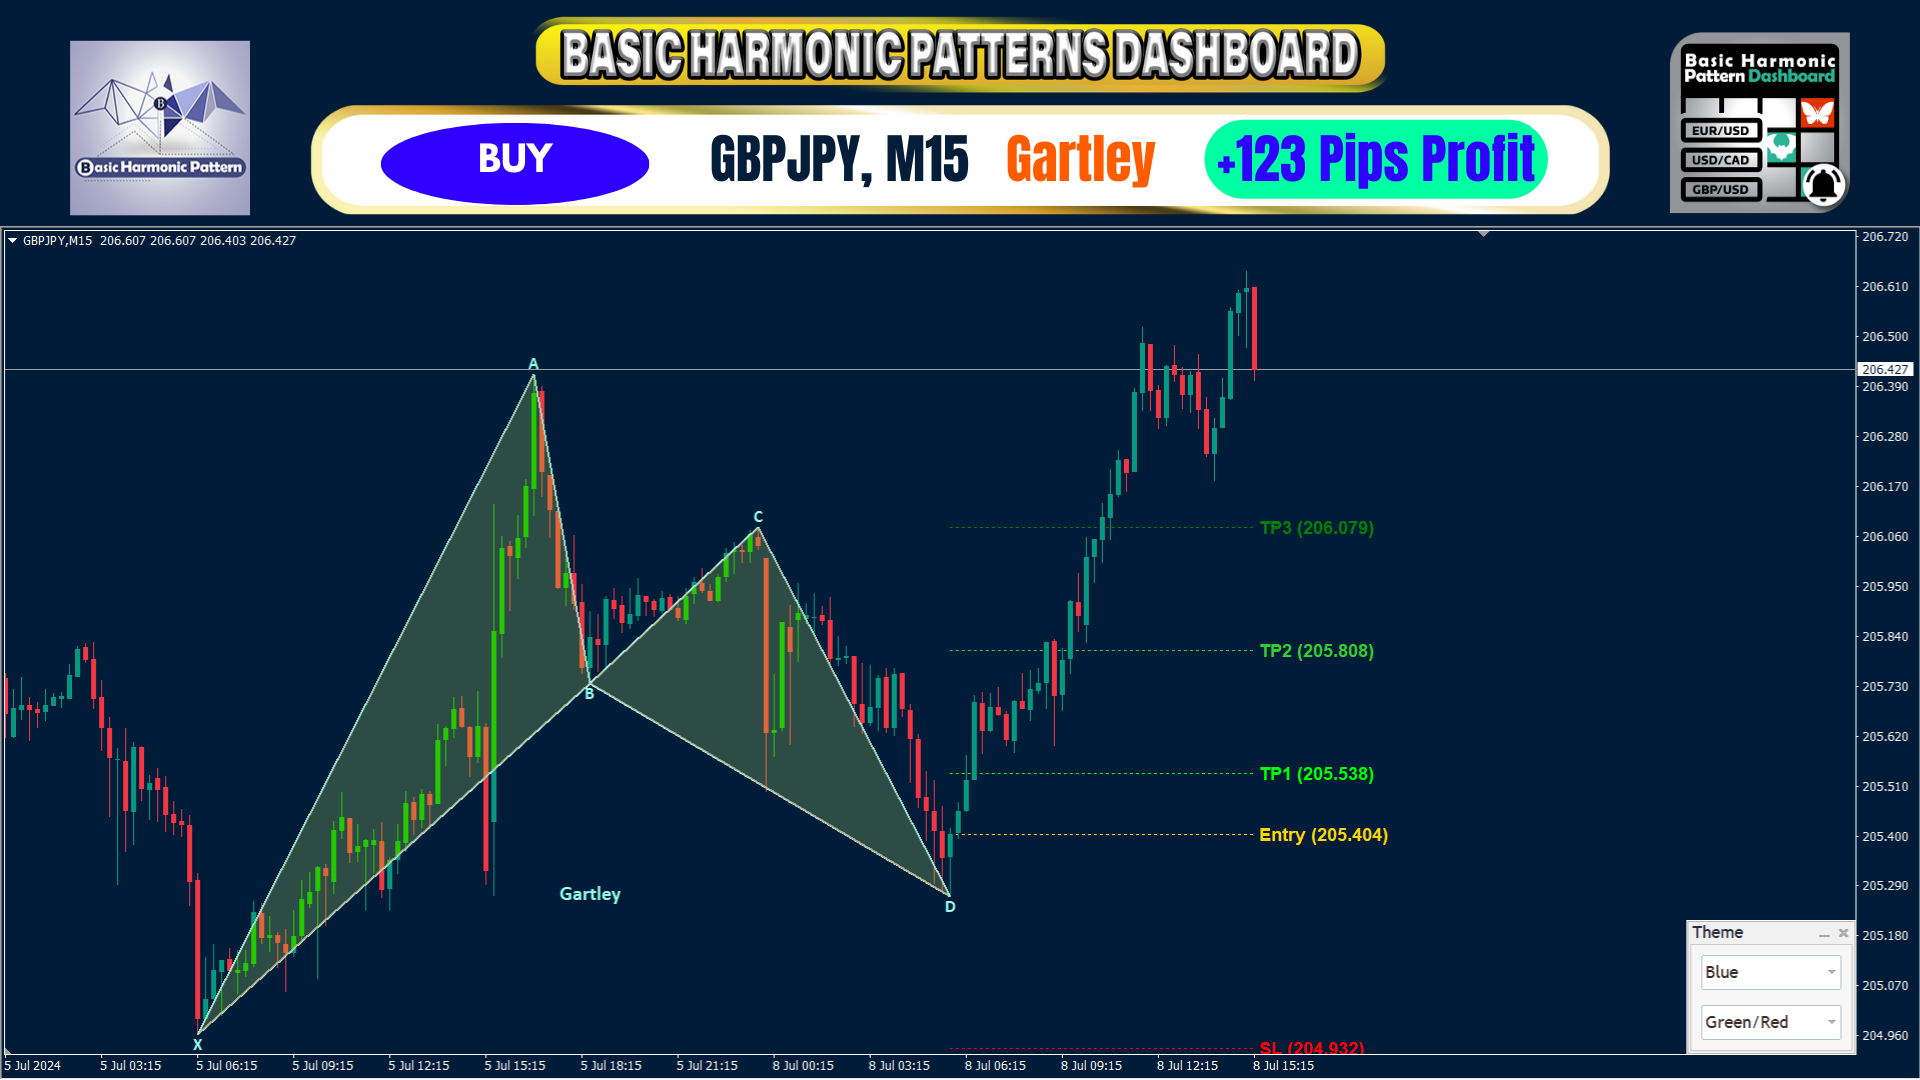
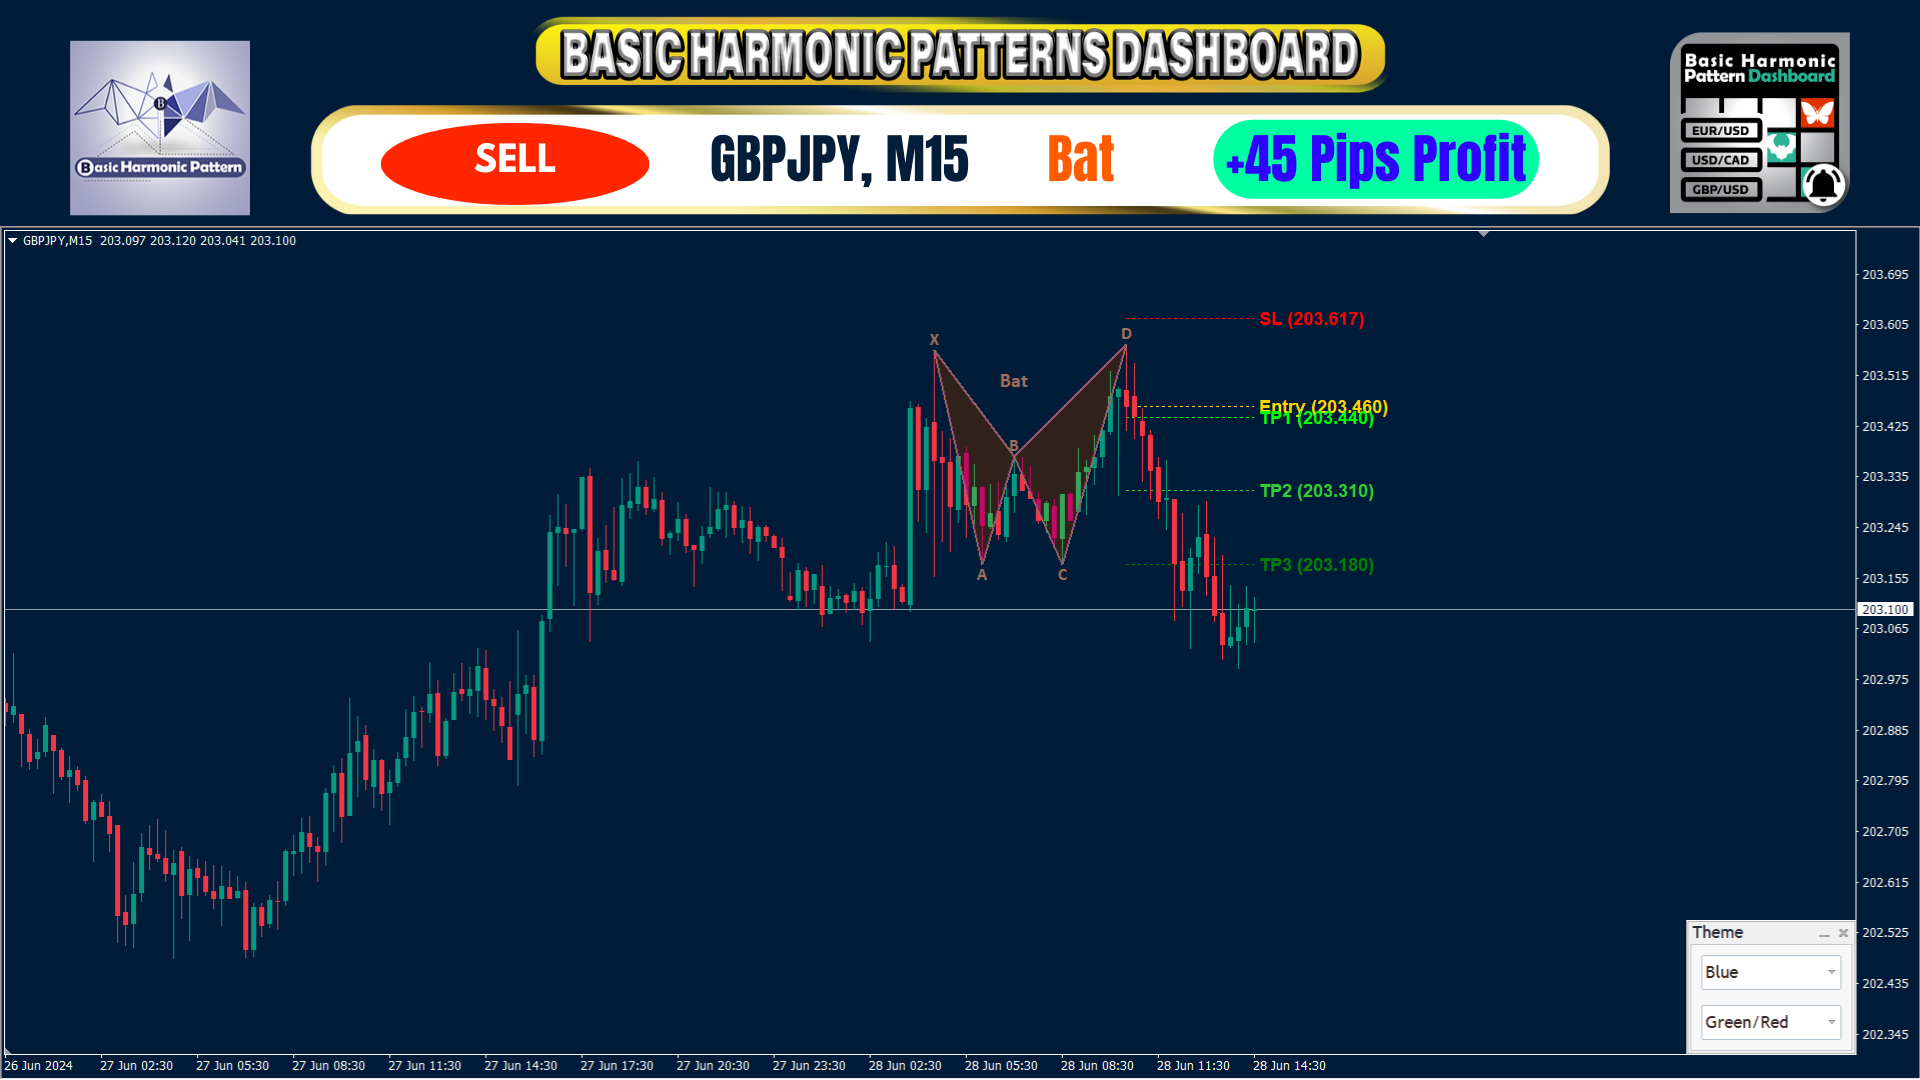
You can sort the dashboard by the column you want, and you can also display the pattern on its graph (see the video below).
Important note: Multi-Pair Indicator/Expert cannot be tested by the MT4 Strategy Tester (you can test the MT5 version to see the ranking performance).
Warning: Using the eighth input you can choose whether the indicator will repaint or have a delay. If you set it to delay, then the indicator will not adjust its signal after the pattern is formed. This option may be preferable for traders who are looking to avoid false signals and want greater consistency in their trades. However, it should be noted that a delayed indicator may lose sensitivity and the ability to adapt to rapid changes in the market.


Good afternoon. Thank you so much for your hard work, the product is beyond praise. The entry points that it shows are very accurate and it is easy to determine the direction of price movement from them. There is a question. How do I change the chart template when I click on the instrument that the signal came from. I want to change it according to my preferences. Thanks