JSON Exporter

Export Positions and Orders to JSON file

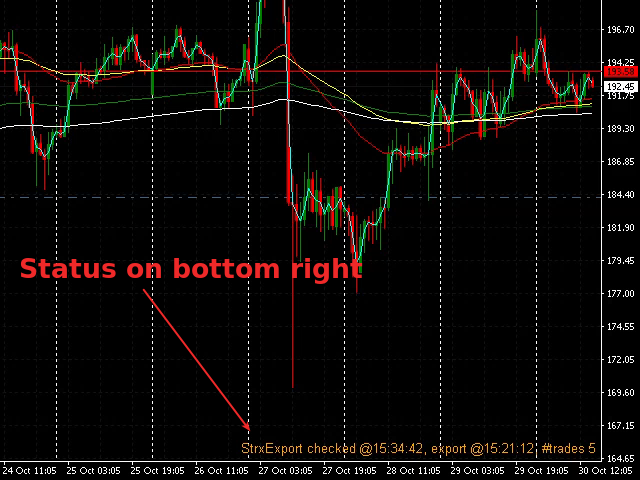
On every tick the software checks if something is changed from the last export, and it rewrite the file only when necessary, optimizing CPU and disk writes

You can choose:

 - to export only the current Symbol or all Symbols
 - to export only positions, only orders or both
 - the file name to export to

The file will be saved on MQL4\Files folder with .json extension

You can use the file how you want, to copy for example your MT4 positions on other platofms for copy trading or monitor your MT4 positions almost in real time

Example export:

{
    "EAName": "StrxExportTradesToJSON",
    "EAVersion": "1.01",
    "ExportAllSymbols": false,
    "ExportOrders": true,
    "ExportPositions": true,
    "FileName": "trades.json",
    "trades": [
        {
            "symbol": "LTCUSD",
            "ticket": 112122086,
            "magicnr": 0,
            "openPrice": 146.53,
            "buy": true,
            "pending": true,
            "stop": false,
            "limit": true,
            "openTime": 1635365039,
            "lots": 0.1,
            "sl": 0,
            "tp": 0,
            "comment": "",
            "commission": 0
        },
    }
]

The JSON export the settings of the indicator and the list of trades; every trade has its main informations given by the MT4 platform

Here you can find a cTrader copier which takes in input the JSON generated: http://bit.ly/ctrader-copy-json

おすすめのプロダクト
Volume Profile Sniper v11.1は、包括的な市場分析ツールです 取引への専門的なアプローチ ボリュームプロファイルスナイパー v11.1は、市場状況の包括的な評価に基づいて明確な信号を提供し、一つの指標に15以上の主要なフィルタを組み合わせ 主な特長 ボリューム不均衡分析-アルゴリズムは、各キャンドルの買い手と売り手のシェアを計算し、当事者の1つの優位性を通知します(50%から90%までの設定可能なしきい値)。 マルチレベル信号フィルタリング-インジケータは考慮されます: トレンド指標(9/21) 買われ過ぎ/売られ過ぎゾーンを除くRSI キャンドルパターン(ピンバー、吸収、ハンマー) サポート/抵抗レベル(自動検出) 主要なプレーヤーの活動を識別するためのボリュームスパイク クラシックと増幅されたRSIの相違 ボラティリティ評価のためのATR 傾向の強さを決定するためのADX 価格アクション(内部バーと外部バー) 複数の時間枠の確認 市場構造(高値/安値) セッションフィルタ(アジア、ロンドン、ニューヨークセッション) ニュースの
Was: $249  Now: $99   Market Profile defines a number of day types that can help the trader to determine market behaviour. A key feature is the Value Area, representing the range of price action where 70% of trading took place. Understanding the Value Area can give traders valuable insight into market direction and establish the higher odds trade. It is an excellent addition to any system you may be using. Blahtech Limited presents their Market Profile indicator for the MetaTrader community. Ins
MT4 バージョン: https://www.mql5.com/ja/market/product/157433 MT5 バージョン: https://www.mql5.com/ja/market/product/167286 出来高インバランスは、設定可能なルックバックレンジ内で、活発な価格帯、方向性のプレッシャー、そして「空」の価格帯を特定できるように設計された、軽量な出来高プロファイルとデルタ・インバランスの可視化ツールです。 総出来高のみを表示する従来の出来高プロファイルとは異なり、このインジケーターは各価格帯を以下のように分割します。 ブル出来高(買い圧力) - 強気のローソク足(終値 > 始値)から推定 ベア出来高(売り圧力) - 弱気のローソク足(終値 ≤ 始値)から推定 その結果、チャート右側にTradingView風のすっきりとしたプロファイルが描画され、さらにデルタ・サマリー・パネルには価格帯全体のパーセンテージ・インバランス(Δ%)が表示されるため、買い手と売り手が優勢な場所を簡単に特定できます。 また、ゼロ出来高ゾーン(選択したルックバックレンジ内で出来高
A technical indicator that calculates its readings on trading volumes. In the form of a histogram, it shows the accumulation of the strength of the movement of the trading instrument. It has independent calculation systems for bullish and bearish directions. Works on any trading instruments and time frames. Can complement any trading system. The indicator does not redraw its values, the signals appear on the current candle. It is easy to use and does not load the chart, does not require addition
EZZ Elite Zig Zag is an indicator for the MetaTrader 4 terminal. This indicator traces the peak of the trend based on the market reversal, thus showing various opportunities in the financial market. EZZ Elite Zig Zag is a visual tool, intuitive, and easy to understand and use.  Test it Yourself by Downloading it for Free. Author Paulo Rocha all rights reserved
A tall upper shadow occurs when the price moves during the period, but goes back down, which is a bearish signal. A tall lower shadow forms when bears push the price down, but bulls pull it back up, which leaves a long line or shadow. This is considered a bullish signal. Some technical analysts believe a tall or long shadow means the stock will turn or reverse. Some believe a short or lower shadow means a price rise is coming. In other words, a tall upper shadow means a downturn is coming, while
The Super Arrow Indicator provides non-repainting buy and sell signals with exceptional accuracy. Key Features No repainting – confirmed signals remain fixed Clear visual arrows: green for buy, red for sell Real-time alerts via pop-up, sound, and optional email Clean chart view with no unnecessary clutter Works on all markets: Forex, gold, oil, indices, crypto Adjustable Parameters TimeFrame Default: "current time frame" Function: Sets the time frame for indicator calculation Options: Can be set
The indicator allows you to trade binary options. The recommended time frame is М1 and the expiration time is 1,2,3 minutes. The indicator suitable for auto and manual trading. A possible signal is specified as a arrows above/under a candle. You should wait until the candle closes! Arrows are not re-painted Trade sessions: TOKYO section (Half-end) Currency pairs: USD/JPY Working time frame: M1 Expiration time: 1,2,3 minutes. The indicator also shows good results when using the martingale strateg
FREE
DualVWAP
Kourosh Hossein Davallou
Dual Timeframe VWAP Indicator for MT4  Description Professional VWAP indicator that displays both **Daily** and **Weekly** VWAP simultaneously on your chart.   Features: - Dual VWAP Lines: Blue for Daily, Red for Weekly - Configurable Bands: Two deviation bands for each timeframe - Session Control: Customizable trading hours for Daily VWAP - Clean Visuals: Solid lines for main VWAP, dashed for bands - Optimizable: Parameters can be optimized using Genetic Algorithm Key Settings: - Enable/di
これは、キャンドルの終値を予測する指標です。 このインジケータは、主にD1チャートでの使用を目的としていますが. この指標は、従来の外国為替取引とバイナリオプション取引の両方に適しています。 インジケーターは、スタンドアロンのトレーディングシステムとして使用することも、既存のトレーディングシステムへの追加として機能させることもできます。 このインジケーターは、現在のキャンドルを分析し、キャンドル自体の内部の特定の強度係数と、前のキャンドルのパラメーターを計算します。 したがって、この指標は、市場の動きのさらなる方向性と現在のキャンドルの終値を予測します。 この方法のおかげで、この指標は、短期の日中取引だけでなく、中期および長期の取引にも適しています。 インジケーターを使用すると、市場の状況の分析中にインジケーターが生成する潜在的な信号の数を設定できます。 インジケーターの設定には、このための特別なパラメーターがあります。 また、インジケーターは、チャート上のメッセージの形式で、電子メールで、およびPUSH通知の形式で、新しい信号について通知することができます。 購入後は必ず私に書いて
Volume Compair
Thiago Pereira Pinho
5 (1)
プロフェッショナルな累積デルタ&ボリューム中央値インジケーター この強力なボリューム分析ツールを使用して、 実際の売買圧力 を追跡します。 ボリューム比較インジケーター (Volume Compare Indicator) は、 累積デルタ (Cumulative Delta) と ボリューム中央値 (Volume Medians) を組み合わせて、 機関投資家の活動、 不均衡、 および潜在的な反転を特定するのに役立ちます。  主な特徴:  累積デルタヒストグラム – リアルタイムで純粋な買いボリュームと売りボリュームを視覚化します。  売買ボリューム中央値 – 平均的な買いボリュームと売りボリュームのレベルを示す水平線。  スマートなボリューム分類 – 以下を区別します: 強い買い(緑) – 強気(ブル)の圧力。 強い売り(赤) – 弱気(ベア)の圧力。 買いボリューム中央値(青線) – 標準的な買いボリュームの基準。 売りボリューム中央値(オレンジ線) – 標準的な売りボリュームの基準。  カスタマイズ可能なパラメーター – 感度に合わせて CDIPeriod と CDIRang
TWO PAIRS SQUARE HEDGE METER INDICATOR Try this brilliant 2 pairs square indicator It draws a square wave of the relation between your two inputs symbols when square wave indicates -1 then it is very great opportunity to SELL pair1 and BUY Pair2 when square wave indicates +1 then it is very great opportunity to BUY pair1 and SELL Pair2 the inputs are : 2 pairs of symbols         then index value : i use 20 for M30 charts ( you can try other values : 40/50 for M15 , : 30 for M30 , : 10 for H1 ,
SMC Venom Model BPR インジケーターは、スマート マネー (SMC) コンセプトで取引するトレーダー向けのプロフェッショナル ツールです。価格チャート上の 2 つの主要なパターンを自動的に識別します。 FVG   (フェアバリューギャップ) は、3 本のローソク足の組み合わせで、最初のローソク足と 3 番目のローソク足の間にギャップがあります。ボリュームサポートのないレベル間のゾーンを形成し、価格修正につながることがよくあります。 BPR   (バランス価格範囲) は、2 つの FVG パターンの組み合わせで、「ブリッジ」を形成します。これは、価格がボリュームアクティビティの少ない動きで動くときに、ブレイクアウトしてレベルに戻るゾーンで、ローソク足の間にギャップを作成します。 これらのパターンは、大規模な市場プレーヤーと一般参加者の相互作用が発生するチャート上のボリュームと価格動向の分析に基づいて、トレーダーが主要なサポート/レジスタンス レベル、ブレイクアウト ゾーン、エントリ ポイントを識別するのに役立ちます。 インジケーターは、長方形と矢印の形でパターンを視
WaveTrend Oscillator MT4は、モメンタムの変化や潜在的なトレンドの反転を特定することで、市場分析を強化するために設計された強力なトレーディングインジケーターです。すべてのレベルのトレーダーに最適なこのツールは、forex、暗号通貨、商品など、さまざまな市場における買われすぎや売られすぎの状況について貴重な洞察を提供します。 正確な売買シグナルを生成する能力を持つWaveTrend Oscillator MT4は、トレーダーが情報に基づいた意思決定を行うことを可能にし、短期および長期のトレーディング戦略における成功の可能性を効果的に高めます。 MQL製品のインストールガイド | MT4/MT5で購入したMQL製品の更新 | 一般的なトラブルシューティングガイド | インジケーター設定 / ガイド 主な機能 バッファ統合: インジケーターの値をアクセス可能なバッファとして公開し、Expert Advisorがシグナルベースのトレーディング戦略を利用できるようにします。 高速かつバックテスト可能: MetaTraderのネイティブOnCalculate()エンジンに基づ
Time Bubble ***Specialized for GBPJPY 1H time frame*** (tested for two years with success rates about 82%) Time Circle's smart algorithm detects the price circles with time . give strong signals at the right time as result of combine the price and time. our team spent months to develop this indicator specially for GBPJPY ..with high success rates about 82% win trades over two years .tested from December 2016 to November 2018. *** in last two years total signals 1012 with 829 Wins and 183 Lo
We present you the indicator "Candle closing counter", which will become your indispensable assistant in the world of trading. That’s why knowing when the candle will close can help: If you like to trade using candle patterns, you will know when the candle will be closed. This indicator will allow you to check if a known pattern has formed and if there is a possibility of trading. The indicator will help you to prepare for market opening and market closure. You can set a timer to create a pre
The "MR Volume Profile 4" indicator is a charting tool that displays trading volume at different price levels rather than time intervals. A key concept in volume profile is the point of control (POC)—the price level with the highest volume traded during the session or time range. While tools like VWAP or OBV provide volume trends, the "MR Volume Profile 4" indicator offers granular detail about where the most market activity occurs at specific price levels. This makes it a more precise tool for
KT Renko Patterns MT4
KEENBASE SOFTWARE SOLUTIONS
2.33 (3)
KT Renko Patterns は、レンコチャートの各レンガをスキャンしながら、さまざまな金融市場でトレーダーによく使用されている有名なチャートパターンを検出します。 時間ベースのチャートと比較して、レンコチャートは視認性が高くシンプルなため、パターンベースのトレードがより簡単かつ明確になります。 KT Renko Patterns は複数のレンコパターンを搭載しており、その多くは Prashant Shah 氏の著書『Profitable Trading with Renko Charts』でも詳しく解説されています。 KT Renko Patterns インジケーターに基づいた 100% 自動化された EA は、こちらからご利用いただけます - KT Renko Patterns EA 。 機能一覧 最大8種類の明確なレンコパターンを表示し、あいまいさなく取引をサポートします。 完全な客観性を保つため、すべてのパターンにストップロスとフィボナッチターゲットが設定されています。 KT Renko Patterns は各パターンの精度を継続的に測定し、重要な統計情報をチャート
Noize Absorption Index - is the manual trading system that measures the difference of pressure between bears forces and bulls forces. Green line - is a noize free index that showing curent situation. Zero value of index shows totally choppy/flat market.Values above zero level shows how powerfull bullish wave is and values below zero measures bearish forces.Up arrow appears on bearish market when it's ready to reverse, dn arrow appears on weak bullish market, as a result of reverse expectation. S
ドンチャン時間同期アナライザーは、 従来のドンチャンチャネル分析に強力な マルチタイムフレーム 分析機能を追加し、トレーダーは5つの異なるチャート期間にわたって トレンドの強さ と潜在的な 反転シグナル を同時に監視できます。この高度なインジケーターは、選択したタイムフレームにおける最高値と最低値を算出し、複数のタイムホライズンにおけるトレンドの方向の収束を特定するのに役立つ 明確な視覚的シグナル を生成します。分単位から時間単位までの統合分析を提供することで、単一タイムフレームツールよりも深い市場洞察を提供し、トレーダーが 重要なブレイクアウトを確認し 、タイムフレーム確認を通じて 偽シグナルを回避するのに 役立ちます。 コア機能 この洗練されたツールは、実績のある ドンチャンチャネル戦略を 複数の時間枠に同時に適用し、同期したシグナルをプロットすることで、短期的な価格変動が長期的なトレンドと一致しているかどうかを明らかにします。システムは、選択した時間枠において、価格が重要なサポートレベルまたはレジスタンスレベルを突破すると、別のインジケーターウィンドウに色分けされた矢印を生成し
Koala Supply Demand
Ashkan Hazegh Nikrou
4.6 (5)
Koala Supply Demand のご紹介 ( 他のトレーダーがあなたの経験から学べるよう、良いレビューでも悪いレビューでも、ぜひフィードバックを共有してください。)  Koala Supply Demand インジケーターへようこそ。このインジケーターは、異なる時間足における 未ブレイクの供給・需要ゾーン を識別するために設計されています。このインジケーターは、トレーダーが市場をゾーンエリアとして視覚的に把握するのに役立ちます。価格が強力なゾーンをどのように尊重しているかを見ることができ、またゾーン内部で形成された場合にはプライスアクションシグナルも表示します。 Supply Demand コンセプト についてさらに学ぶ : 記事 さらに多くの無料製品を入手 するために私の MQL5 チャンネルへ参加してください : 参加 Koala Supply Demand の MT5 バージョン も利用可能です : ダウンロード 主な特徴: チャート上バックテスト機能: 独自の On Chart Back Test 機能により、分析の未来を体験してください。チャート上の任意の場所をクリ
FREE
This indicator is a conventional analytical tool for tick volumes changes. It calculates tick volumes for buys and sells separately, and their delta on every bar, and displays volumes by price clusters (cells) within a specified bar (usually the latest one). The algorithm used internally is the same as in the indicator VolumeDelta , but results are shown as cumulative volume delta bars (candlesticks). Analogous indicator for MetaTrader 5 exists - VolumeDeltaBars . This is a limited substitution
Smart Predictor — Continuous Market Forecasting with Intelligent Signals SmartPredictor  offers a fresh perspective on technical analysis. This indicator combines price data smoothing with advanced forecasting elements to create a seamless, continuous "past-present-future" view. No more guessing where the price might go — you can now see the most probable scenario plotted directly on your chart. Key Innovation: Zero Visual Lag Unlike standard averaging indicators such as moving averages that a
MT4 バージョン: https://www.mql5.com/ja/market/product/166784 MT5 バージョン: https://www.mql5.com/ja/market/product/166785 流動性プロファイル 流動性プロファイルは、動的なヒートマップ形式のプロファイルを用いて、チャート上に潜在的な流動性ゾーンをマッピングする、視覚的な市場構造ツールです。 このインジケーターは、過去の価格変動とティックボリュームを分析し、流動性が集中している可能性のある価格帯を強調表示します。描画内容は以下のとおりです。 流動性ライン(潜在的な反応/スイープレベル) ヒートマッププロファイルボックス(流動性集中ゾーン) POC/最大流動性レベル(検出された最高集中度) この結果、トレーダーが以下の点を特定しやすくなる、分かりやすい視覚的なプロファイルが作成されます。 潜在的なマグネットレベル 可能性のあるスイープゾーン 現在の価格の上下の反応エリア エントリー、エグジット、リスク管理のコンテキスト 主な機能 動的な流動性ヒートマッププロファイル
Smart Ai Levels Pro+ Wyckoff Theory. Volume Profile. Machine Learning. Institutional Zone Intelligence for Serious Traders This is a sophisticated trading indicator that combines Wyckoff theory, volume profile analysis, machine learning predictions, and multiple timeframe zone calculations. AI-powered Wyckoff zone indicator with real-time volume profile, machine learning reliability predictions, and multi-timeframe cycle analysis. Features 26+ dynamic S/R zones, priority strength markers, volum
Scalping Snake Proは、トレーダーに価格逆転の瞬間を示し、再描画しないユニークなスキャルピングインジケーターです。このインジケーターは、インターネット上の他の多くのインジケーターとは異なり、その値を再描画しません。それはあなたが取引を開くのに遅れないことを可能にする最初のバーにシグナルを描きます。このインジケーターは、シグナルが表示されたときに電話と電子メールでトレーダーに通知を送信します。このすべての機能をたったの147ドルで手に入れることができます。 この指標と取引する方法は? H1タイムフレームを開きます。通貨ペアGBPUSDまたはEURUSD。インジケーターが青い線を引く最初のバーを待っています。 TakeProfitを購入して+20ポイントを設定する取引を開始します。 StopLossは反対方向のシグナル、つまり赤い線になります。売り取引を開始するには、インジケーターが赤い線を引く最初のバーを待ちます。その後、販売取引を開始します。利益を20ポイント獲得します。 StopLossは反対方向、つまり青い線の信号になります。 このインジケーターは再描画されてい
This indicator presents an alternative approach to identify Market Structure. The logic used is derived from learning material created by   DaveTeaches (on X) Upgrade v1.10: add option to put protected high/low value to buffer (figure 11, 12) When quantifying Market Structure, it is common to use fractal highs and lows to identify "significant" swing pivots. When price closes through these pivots, we may identify a Market Structure Shift (MSS) for reversals or a Break of Structure (BOS) for co
PLEASE NOTE THAT  LIKE MANY SUCH INDICATORS ON THIS MARKET, THIS INDICATOR WILL NOT WORK AS A DEMO DOWNLOAD FOR STRATEGY TESTER. Therefore the 1 month option at the lowest cost allowed of $10 is available for you to test.  One of the better ways to trade is to analyse individual currencies rather than currency pairs. This is impossible with standard chart indicators on MT4.  This currency strength meter allows one to trade the strongest with the weakest currency.  The meter includes the curren
Description: Please tick "Show object descriptions" in chart properties to enable hrays views That utility converts a trendline into a horizontal ray known as tool for drawing supply and demand zones. Simply create a trendline on a chart and once selected, it will get converted. Ray remains horizontal while dragging.  Quick ray plot: press "R" key to create horizontal ray. It will be snapped to the nearest OHLC value Further versions will be improved. For feature request please post new comm
## Smart Reversal Oscillator Pro Smart Reversal Oscillator Pro is an advanced hybrid trading utility designed for MetaTrader 4 that reinvents volatility and momentum analysis. Instead of analyzing raw price action, this indicator applies mathematical Bollinger Bands directly onto the Relative Strength Index (RSI) array data within a separate sub-window. Standard fixed oversold and overbought levels (like 30 and 70) often fail during strong market expansions. This professional oscillator solve
このプロダクトを購入した人は以下も購入しています
Neuro Poseidon is a new indicator by Daria Rezueva. It combines precise trading signals with adaptive TP/SL levels - creating best possible trades as a result! Message me and get  Neuro Poseidon Assistant  as a gift to automize your trading process! What makes it stand out? 1. Proven profitability on all assets and timeframes 2. Only confirmed BUY and SELL signals present on the chart 3. Adaptive TP & SL levels generated by the software for each trade 4. Easy to understand - suitable for all
Miraculous Indicator – ガン・スクエア・オブ・ナインに基づく100%非リペイントのFXおよびバイナリーツール この動画では、FXおよびバイナリーオプションのトレーダー向けに特別に開発された、非常に正確で強力な取引ツールである Miraculous Indicator を紹介しています。このインジケーターがユニークなのは、伝説的な ガン・スクエア・オブ・ナイン と ガンの振動の法則 に基づいている点で、現代の取引で利用できる最も正確な予測ツールの一つとなっています。 Miraculous Indicatorは 完全に非リペイント であり、ローソク足が確定した後にシグナルが変化したり消えたりすることはありません。つまり、見たものがそのまま利用できます。これにより、トレーダーは自信を持ってエントリーおよびエグジットを行うための信頼性と一貫性のある根拠を得ることができます。 主な特徴: ガン・スクエア・オブ・ナインとガン理論に基づいて構築 100%非リペイントのシグナルシステム すべての時間枠(M1、M5、H1、H4、日足、週足)で機能 FXおよびバイナリーオプション取引
Trend Catcher ind
Ramil Minniakhmetov
5 (7)
トレンドキャッチャーインジケーター トレンドキャッチャーインジケーターは、開発者独自の適応型トレンド分析指標を組み合わせることで、市場価格の動きを分析します。短期的なノイズを除去し、根底にあるモメンタムの強さ、ボラティリティの拡大、価格構造の挙動に焦点を当てることで、真の市場方向性を特定します。また、移動平均線、RSI、ボラティリティフィルターなどの平滑化およびトレンドフィルタリング機能を備えたカスタマイズ指標も使用します。 実際の運用状況のモニタリングやその他の製品については、こちらをご覧ください: https://www.mql5.com/en/users/mechanic/seller ご注意ください。私はTelegramでEAや設定を販売していません。詐欺です。すべての設定はブログで無料で公開しています。 重要!ご購入後すぐにご連絡ください。手順とボーナスをお送りします!
Gann Made Easy は、ミスター・ギャンの理論を使用した取引の最良の原則に基づいた、プロフェッショナルで使いやすい外国為替取引システムです。 W・D・ガン。このインジケーターは、ストップロスとテイクプロフィットレベルを含む正確な買いと売りのシグナルを提供します。 PUSH通知を利用して外出先でも取引可能です。 ご購入後、取引方法の説明と優れた追加インジケーターを無料で入手するには、私にご連絡ください! おそらく、ギャンの取引手法についてはすでに何度も聞いたことがあるでしょう。通常、ギャンの理論は初心者のトレーダーだけでなく、すでにある程度の取引経験がある人にとっても非常に複雑なものです。なぜなら、ギャンの取引手法は理論的にはそれほど簡単に適用できるものではないからです。私はその知識を磨き、最良の原則を私の外国為替インジケーターに組み込むために数年を費やしました。 このインジケーターは非常に簡単に適用できます。必要なのは、それをチャートに添付し、簡単な取引推奨事項に従うだけです。このインジケーターは常に市場分析の仕事を行い、取引の機会を探します。適切なエントリーポイントを検出す
Prop Firm Sniper MT4  is a professional market structure indicator that automatically identifies high-probability BUY and SELL opportunities using BOS and CHoCH analysis. Recommended Timeframes: For backtesting, use the indicator on   M5 or M15   for Gold (XAUUSD), and   M15 or H1   for more volatile Forex pairs such as   GBPUSD, USDJPY, EURGBP , and similar markets. CONTACT ME AFTER PURCHASE TO CLAIM YOUR FREE BONUSES! Prop Firm Sniper  is a professional market structure indicator designed t
M1 SNIPER は使いやすいトレーディングインジケーターシステムです。M1時間足向けに設計された矢印インジケーターです。M1時間足でのスキャルピングのためのスタンドアロンシステムとして、また既存のトレーディングシステムの一部としても使用できます。このトレーディングシステムはM1時間足での取引に特化して設計されていますが、他の時間足でも使用できます。元々、この手法はXAUUSDとBTCUSDの取引用に設計しましたが、他の市場においても役立つと考えています。 インジケーターのシグナルは、トレンドの方向と逆方向に取引できます。インジケーターのシグナルを利用して両方向に取引するのに役立つ特別な取引テクニックをご紹介します。この手法は、特別な動的なサポートとレジスタンスの価格帯を利用することに基づいています。 ご購入後、M1 SNIPER矢印インジケーターをすぐにダウンロードできます。さらに、M1 SNIPERツールのすべてのユーザーに、以下のスクリーンショットに表示されているApollo Dynamic SRインジケーターを無料で提供しています。この2つのインジケーターを組み合わせることで
Dynamic Forex28 Navigator - 次世代の Forex 取引ツール。 現在 49% オフ。 Dynamic Forex28 Navigator は、長年人気のインジケーターを進化させたもので、3 つの機能を 1 つにまとめています。 Advanced Currency Strength28 インジケーター (レビュー 695 件)  + Advanced Currency IMPULSE with ALERT (レビュー 520 件) + CS28 コンボ シグナル (ボーナス)。 インジケーターの詳細 https://www.mql5.com/en/blogs/post/758844 次世代の Strength インジケーターが提供するもの  オリジナルで気に入っていたすべての機能が、新機能と精度の向上によって強化されました。 主な機能: 独自の通貨強度計算式。 すべての時間枠でスムーズかつ正確な強度ライン。 トレンドの特定と正確なエントリーに最適です。 ダイナミックマーケットフィボナッチレベル (マーケットフィボナッチ)。 このインジケーターに固有
BTMM State Engine Pro is a MetaTrader 4 indicator for traders who use the Beat The Market Maker approach: Asian session context, kill zone timing, level progression, peak formation detection, and a multi-pair scanner from a single chart. It combines cycle state logic with a built-in scanner dashboard so you do not need the same tool on many charts at once. What it does Draws the Asian session range; session times can follow broker server offset or be set in inputs. Tracks level progression (L
Scalper Inside PRO Scalper Inside PRO は、独自の内蔵アルゴリズムを用いて相場の方向性や主要なターゲット価格を評価する、デイトレード向けのトレンド&スキャルピングインジケーターです。本インジケーターはエントリーポイントとエグジットポイント、および複数の利益確定ターゲット価格を自動的に計算し、詳細なパフォーマンス統計を表示します。これにより、さまざまな銘柄や戦略がヒストリカルデータ上でどのように機能したかを確認できます。これは、現在の相場環境に適した銘柄を選ぶのに役立ちます。また、ご自身の矢印インジケーターを Scalper Inside PRO に接続し、その統計やヒストリカルシグナルをすばやく確認することも可能です。 Scalper Inside PRO マニュアルおよび設定の説明: こちらをクリックして読む 本インジケーターはあらゆる銘柄および時間足で動作し(デイトレードには M5 を推奨)、複数の内蔵戦略を備えています。単独のスキャルピングツールとして、またトレードシステムの分析コンポーネントとして使用できます。 主な機能 独自の次世代トレ
MetaBands M4
Vahidreza Heidar Gholami
3.5 (6)
MetaBandsは、強力でユニークなアルゴリズムを使用してチャンネルを描画し、トレンドを検出して、トレーダーに取引の入出ポイントを提供することができます。チャンネル指標に加えて、強力なトレンド指標でもあります。入力パラメータを使用して新しいチャンネルを作成するために、異なるタイプのチャンネルを統合することができます。MetaBandsは、市場のイベントについてユーザーに通知するために、すべてのタイプのアラートを使用します。 特徴 ほとんどのチャンネルアルゴリズムをサポート 強力なトレンド検出アルゴリズム 異なるタイプのチャンネルを統合する能力 マルチタイムフレームおよびマルチカレンシー(シグナルマトリックス) すべてのタイプのアラート機能(サウンド、画面フラッシャー、プッシュ通知、メール、ポップアップ、矢印) 再描画しない トレンド検出 MetaBandsは、チャネル内を振動する青いラインを使用してトレンドを検出します。ラインがチャネルの上部バンドに達すると、下降トレンドの開始を示し、下部バンドに達すると上昇トレンドの開始を示します。青いラインが中心ラインに近づくと、市場はコンソリ
Genesis Matrix Pro is a professional multi-timeframe trend detection indicator designed to help traders identify high-quality market alignment with clarity and structure. It combines 12 different technical indicators into one visual alignment matrix, allowing traders to quickly see when market conditions are bullish, bearish, or neutral. A signal is generated only when the selected strategies are aligned, helping reduce noise and improve decision-making. PLEASE CONTACT ME AFTER PURCHASE TO GET
この製品は 2026 年の市場向けに更新され、最新の MT5 ビルドに最適化されています。 価格更新のお知らせ: Smart Trend Trading System は現在 $99 で提供されています。 次の 30 件の購入 後、価格は $199 に上がります。 特別オファー: Smart Trend Trading System を購入後、私にプライベートメッセージを送ることで、 Smart Universal EA を無料 で受け取り、Smart Trend のシグナルを自動売買に変えることができます。 Smart Trend Trading System は、リペイントなし、再描画なし、遅延なしの完全なトレーディングシステムです。よりクリーンなシグナル、より明確なトレンド方向、そしてより整理された取引方法を求めるトレーダー向けに作られています。 Online course , manual and download presets . このシステムは、トレンド検出、反転ゾーン、Smart Cloud、トレーリングストップロジック、サポートとレジスタンス、ローソク足の色分け、ア
Advanced Supply Demand
Bernhard Schweigert
4.91 (300)
現在30%オフ 初心者にもエキスパートトレーダーにも最適なソリューション このインジケーターは独自の機能と新しい公式を多数内蔵しており、ユニークで高品質かつ手頃な取引ツールです。このアップデートでは、2つの時間枠ゾーンを表示できるようになります。より長いTFだけでなく、チャートTFとより長いTF(ネストゾーンを表示)の両方を表示できます。すべてのSupply Demandトレーダーの皆さんのお気に召すはずです。:) 重要情報の公開 Advanced Supply Demandの可能性を最大化するには、 https://www.mql5.com/ja/blogs/post/720245 にアクセスしてください。   エントリーまたはターゲットの正確なトリガーポイントを正確に特定できれば取引がどのように改善されるか想像してみてください。新しい基盤となるアルゴリズムに基づいて構築されているため、買い手と売り手の間の潜在的な不均衡をさらに簡単に特定できます。これは、最も強い需要と供給のゾーンと、過去のパフォーマンス(古いゾーンを表示)がグラフィカルに表現されるためです。これらの機能は、最適な
Gannスクエアインジケーターは、W.D. Gannによって執筆された「市場予測のための数学的な式」の記事に基づく強力な市場分析ツールです。このツールは、解析に数学的な概念を応用し、Gann理論に基づいています。それは、144、90、52のスクエアや9のスクエアなど、Gannの関連テクニックの要素を取り入れています。さらに、の方法を組み込んでおり、9のスクエアとその関連性についてのチャネルやスターパターンに焦点を当てています。 ユーザーマニュアルと使用方法: このインジケーターを使用する前に、ユーザーマニュアルを読んで疑問点を解決するためにお問い合わせいただくことをお勧めします。ユーザーマニュアルの完全版は、当社のウェブサイトで入手できます。 MT5の完全版は購入できますし、MT4の無料版も試すことができます。両方のバージョンへのリンクを提供していますので、ご利用ください。 主な機能と機能: Gannスクエアインジケーターは、市場分析のための完全なツールセットを提供し、幾何学的な概念とGann理論に基づいて的確な判断を行う手助けをします。以下に主な機能を示します。 9のスクエアの分析:
Price & Time Market Structure Indicator A professional market structure tool that analyzes waves through both price and time — not price alone. Main Description NeoWave PRO is a professional market structure indicator for MetaTrader 4 designed for traders who want to move beyond traditional one-dimensional wave tools such as ZigZag, swing indicators, and basic high/low systems. Most wave indicators analyze only one thing: Price. But a real market wave is not only a price movement. A true wave de
Enigma Scalper  Overview Enigma Scalper Pro is a multi-filter breakout indicator designed for traders who want clean entry signals with confirmation from several technical conditions instead of relying on a single trigger. The indicator combines: 3-Bar Breakout pattern detection Higher Timeframe confluence Bollinger Band extreme filtering RSI momentum analysis Optional EMA trend filtering ATR-based SL/TP projection Signals are generated only after candle close to ensure stable non-repainting beh
PRO Renko Systemは、特別にRENKOチャートを取引するために設計された高精度の取引システムです。 これは、様々な取引商品に適用することができる普遍的なシステムです。 システムは効果的に正確な逆転信号へのアクセスを与えるいわゆる市場の騒音を中和する。 表示器は非常に使いやすく、信号の生成に責任がある1つの変数だけがあります。 あなたは簡単にお好みの任意の取引ツールとレンコバーのサイズにツールを適応させることができます。 私はいつもあなたが私のソフトウェアで収益性の高い取引を支援するために余分なサポートを提供する準備ができています! 私はあなたに幸せで収益性の高い取引をしたいです! ご購入後にご連絡ください! 私はあなたに私のレンコチャートジェネレータを送信します。 私はまた、私の個人的な推奨事項やシステムの他のモジュールを無料で共有します!
Scalper Vault は、スキャルピングを成功させるために必要なすべてを提供するプロフェッショナルなスキャルピング システムです。このインジケーターは、外国為替およびバイナリー オプションのトレーダーが使用できる完全な取引システムです。推奨される時間枠は M5 です。 システムは、トレンドの方向に正確な矢印シグナルを提供します。また、トップとボトムのシグナルとギャン マーケット レベルも提供します。 インジケーターは、プッシュ通知を含むすべてのタイプのアラートを提供します。 インジケータの購入後にご連絡ください。私の個人的な取引の推奨事項と素晴らしいボーナス指標を無料で共有します! 幸せで有益な取引をお祈りします!
CRT Candle Range Theory HTF MT4.   Ultimate CRT Indicator: Advanced ICT Concepts and Malaysian SnR Trading System Discounted   Price   $50  !!     Secure your lifetime access   now   before it switches to   subscription-only ! Master the Market Maker's Footprints with the Most Advanced Candle Range Theory Indicator Unlock the true power of   Smart Money Concepts (SMC)   and trade precisely like the institutions with the   Ultimate CRT Indicator . Built exclusively for serious traders, this indic
Trend Breakout Arrows Indicator The Trend Breakout Arrows Indicator is a momentum-based signal tool designed to identify potential bullish and bearish breakout opportunities. It displays clear arrow signals directly on the price chart, helping traders quickly recognize possible trend changes and continuation setups. Up Arrow (Buy Signal) A magenta up arrow appears below a candle when bullish momentum begins to strengthen. This signal indicates that buying pressure may be overtaking selling press
Pinpoint は、 xauusd の正確な売買シグナルのために設計された、再描画せずに遅延することなく、非常に効率的な取引指標です。 この指標は、急速に変化する市場で、リアルタイムで、迅速かつ正確かつ視覚的なソリューションを必要とするトレーダーのために設計されています。 この指標は既製の取引戦略として機能します。 これは、組み込みのアルゴリズムに従って資産の価格の動作を分析し、理想的なエントリポイントを決定するだけでなく、利益をロックする場所を示しています。 潜在的な変化をより正確に識別するために、指標には、現在の市場の状況に応じて動的に調整するインテリジェントなトレンドラインツールが組み込まれています。 標準的なライン設定に従って: 緑-イニシアチブを購入します。 赤は販売イニシアチブです。 オレンジ-以前のイニシアチブを傍受することは可能です。 Pinpoint mt5 Pinpoint Blog Pinpoint にはさまざまなフィルタが含まれており、誤った信号を減らし、入力の品質を向上させるのに役立ちます。 デフォルトの設定は、 TF m15、m30、および1時間の
The indicator scans for Dinapoli thrust pattern in multiple timeframes for the all markets filtered and shows the results on Dashboard. Key Features Dashboard can be used for all markets It can scan for thrust pattern on MN1, W1, D1, H4, H1, M30, M15 ,M5, M1 timeframes Ability to choose number of bars required above/below displaced moving average to define thrust Parameters UseMarketWatch: Set true to copy all symbols available in market watch MarketWatchCount : Set the number of symbols that
現在40%オフ 初心者やエキスパートトレーダーに最適なソリューション! このインジケーターは、独自の機能と新しい計算式を取り入れた、ユニークで高品質、かつ手頃な価格のトレーディングツールです。たった1枚のチャートで28の為替ペアの通貨強度を読み取ることができます。新しいトレンドやスキャルピングチャンスの引き金となるポイントを正確に特定することができるので、あなたのトレードがどのように改善されるか想像してみてください。 ユーザーマニュアルはこちら  https://www.mql5.com/en/blogs/post/697384 これが最初の1本、オリジナルだ! 価値のないクローンを買わないでください。 特別な サブウィンドウの矢印で強い通貨の勢いを表示 GAPがあなたのトレードを導く! 基準通貨や気配値が売られすぎ・買われすぎのゾーン(外相フィボナッチレベル)にあるとき、個別チャートのメインウィンドウに警告表示。 通貨がレンジの外側から反落した場合、プルバック/リバーサルのアラート。 クロスパターンの特別なアラート 複数の時間枠を選択可能で、トレンドを素早く確認できます
新たな王者の登場 ― インジケーター + 注文管理機能(TP1 + TP2 + TP3)搭載(完全トレーディングシステム) このインジケーターは、高度なトレーディング戦略、カスタマイズ可能な注文管理システム、そしてエンベロープ拡張を活用した平均回帰(Mean Reversion)システムを組み合わせた総合トレーディングソリューションです。さらに、RSIをはじめとする複数のインテリジェントな確認フィルターを搭載し、高確率の反転ポイントを捉えるBUY(買い)およびSELL(売り)シグナルを提供します。 本インジケーターはリペイントしません(No Repaint)。 単にエントリーのタイミングを学ぶだけでなく、複数ポジションを効率的に管理し、既存の利益ポジションを活用して損失ポジションをカバーする実践的な資金管理手法も身につけることができます。 M5(5分足)専用に開発・最適化されており、ほぼすべての通貨ペアおよび取引銘柄で優れたパフォーマンスを発揮します。また、バックテストにも対応しており、さまざまな市場環境におけるシステムの有効性を検証することが可能です。 インジケーターは明確なロング(
このインジケーターは実践的なトレードに最適な自動波動分析のインジケーターです! 場合... 注:   Tang Lun (Tang Zhong Shuo Zen) の命名規則の影響で、私は波のグレーディングに西洋の名前を使用することに慣れていません。基本的な波を ペン 、二次波のバンドを セグメント と名付けました。同時に、 セグメント にはトレンドの方向が指定されます (この命名方法は将来のノートで使用されます。最初に言っておきます)。ただし、アルゴリズムは曲がりくねった理論とはほとんど関係がないため、付けるべきではありません。これは、私の市場分析 によって要約された、絶えず変化する複雑な運用ルール を反映しています。 バンドは標準化され、人によって異なることがないよう定義されており、市場参入を厳密に分析する上で重要な役割を果たす人為的な干渉の描画方法が排除されています。 このインジケーターを使用することは、取引インターフェイスの美しさを改善することと同等であり、元の K ライン取引を放棄し、取引の新しいレベルに連れて行きます。また、宣伝の観点から顧客の認識も向上します。 イ
Introduction Harmonic Patterns are best used to predict potential turning point. Traditionally, Harmonic Pattern was identified manually connecting peaks and troughs points in the chart. Manual harmonic pattern detection is painfully tedious and not suitable for everyone. You are often exposed under subjective pattern identification with manual pattern detection. To avoid these limitations, Harmonic Pattern Plus was designed to automate your harmonic pattern detection process. The functionality
多くの矢印インジケーターは、シグナルだけを表示して、その後の判断はすべてトレーダー任せです。KT Alpha Hunter Arrows は、最初から完成されたトレードプランを提供します。 各シグナル矢印が表示されると、エントリーライン、ストップロス、4つのテイクプロフィット水準、そして現在の銘柄と時間足を今トレードする価値があるかを示すリアルタイムのエッジ判定が、チャート上にまとめて描画されます。付属の Trade Manager EA は、手動でエントリーした後の管理をサポートし、相場が荒れて感情が揺れやすい場面でも、トレードの規律を保ちやすくします。リペイントなし。確定足のみでシグナルを表示。Forex、ゴールド、指数、その他あなたが取引するあらゆる銘柄向けに設計されています。 主な機能 リペイントしない買い・売り矢印。シグナルは足が確定した後にのみ表示されます。 各シグナルにエントリーライン、構造的なストップロス、4つのテイクプロフィット水準を表示。 Edge Dashboard が、現在のチャート上で買いと売りのセットアップを個別に評価。 判定システム:No Edge、Ma
BreakAxis — 転換点における高精度シグナル 最新情報を見逃さないよう、チャンネルに参加してください: https://www.mql5.com/en/channels/forexnewadvisor 軸のクロスに基づくシグナルロジック BreakAxis Signal は、ゼロ軸のクロスを基に価格の方向転換を検出するよう設計されています。 ヒストグラムの変化により市場のモメンタム転換が視覚的に強調され、方向矢印によって確認されます。 シグナルの確定と安定性 各シグナルは特定の数学的条件が満たされたときに生成され、リペイントを回避し、履歴データの一貫性が保たれます。 買いと売りのシグナルは、それぞれ最近の高値と安値に基づく平滑化された値の動的変化によって独立して示されます。 ビジュアルとアラート 方向転換はチャート上で視覚的に確認され、リアルタイムで監視できるようアラートの有効化も可能です。 このアルゴリズムは一般的なインジケーターに依存せず、プライスアクションの処理に特化したクリーンなロジック構成です。 柔軟なパラメーター設定 軸のクロスとヒストグラムに基
このインジケータは、AB = CDリトレースメントパターンを検出します。 AB = CDリトレースメントパターンは、初期価格セグメントが部分的にリトレースされ、プルバックの完了から等距離の動きが続く4ポイントの価格構造であり、すべての調和パターンの基本的な基盤です。 [ インストールガイド | 更新ガイド | トラブルシューティング | よくある質問 | すべての製品 ] カスタマイズ可能なパターンサイズ カスタマイズ可能なACおよびBD比率 カスタマイズ可能なブレイクアウト期間 カスタマイズ可能な線、色、サイズ CD fiboレベルに基づいてSLおよびTPレベルを表示します パターンとブレイクアウトの視覚/音声/プッシュ/メールアラート AB = CDリトレースメントは、かなり拡大して再描画できます。物事を簡単にするために、このインディケーターはひねりを実装します。トレードをシグナルする前に、正しい方向へのドンチャンブレイクアウトを待ちます。最終結果は、非常に信頼性の高い取引シグナルを備えた再描画インジケーターです。ドンチャンのブレイクアウト期間が入力として入力されます。 強
トレンドラインプロ   市場の真の方向転換点を理解するのに役立ちます。この指標は、真のトレンド反転と主要プレーヤーが再び参入するポイントを示します。 分かりますか     BOSライン   複雑な設定や不要なノイズなしに、より長い時間足でのトレンドの変化と重要なレベルを把握できます。シグナルは再描画されず、バーが閉じた後もチャート上に残ります。 VERSION MT 5     -     RFI LEVELS PRO インジケーター と組み合わせることで、その潜在能力を最大限に発揮します。 インジケーターが示す内容: 本当の変化   トレンド(BOSライン) 一度シグナルが現れたら、それは有効です!これは、リペイント機能を持つインジケーターとの重要な違いです。リペイント機能を持つインジケーターは、シグナルを発した後、それを変更し、資金の損失につながる可能性があります。これにより、より高い確率と精度で市場に参入できます。また、矢印が現れた後、目標値(利益確定)に達するか、反転シグナルが現れるまで、ローソク足の色を変更する機能もあります。 繰り返しエントリ       主要プレーヤーの
作者のその他のプロダクト
StrxInfoPanel
Francesco Strappini
5 (3)
StrxInfoPanel is an essential tool for every trader It gives you an immediate idea about your account and realtime informations about the current symbol and timeframe you are analyzing Every information line can be hidden and shown via parameters, even panel position can be changed via input parameters Parameters list: Corner : the screen corner where you want the panel to be shown Left, Top, and Width : customizable position and panel dimensions BgColor : background color Show XXX : every infor
FREE
Levels and risk calculator for the Antimartingale (or Antimartingala) technique Totally visual, setup everything from control panel Decide your risk and margin, it will calculate and show trading lavels on the chart Free version of the orginal Antimartingale EA:  https://www.mql5.com/en/market/product/53653 Public Signals using the Antimartingale's technique: https://www.mql5.com/en/signals/1016250 https://www.mql5.com/en/signals/1018964 This EA does not open trades, it only shows the trading le
FREE
Strx Super Grid is a grid system with many advanced features. It places the first 2 orders as BUY_STOP and SELL_STOP distanced from current price by the GridPoints specified; when an order becomes active, the other is canceled. User can also choose to open immediately a position or a pending order via the new FirstImmediateOrder input. If GridPoints is 0 (default), grid is auto-sized based on last 500 bars (max-min closes) divided by MaxOrders input parameter. If trade becomes profitable, after
Buy or rent it and request a copy of the Antimartingale EA for free  Trendline based utility, you design your trendlines or horizontal lines, the EA opens trades for you Possibility to trade on break and/or bounce events Indipendent break and bounce settings Configurable market, stop and limit orders T1T2 Logic to lock profits and minimize losses Trailing Stop Loss Max Spread check Notifies you when your trendlines are crossed No strange trendline name or syntax, you decide the color of tr
Public Signals using this EA: https://www.mql5.com/en/signals/1016250 https://www.mql5.com/en/signals/1018964 It waits for the first executed order available and then opens a grid of pending stop orders in the same direction of the first one The first order that we usually call the   master trade  can be opened manually, on day and hour specified or via any other EA, indipendent from this one There is a dedicated Telegram Group with use cases and best settings   here, feel free to join and as
Public Signals using this EA: https://www.mql5.com/en/signals/1016250 https://www.mql5.com/en/signals/1018964 The EA waits for the first executed order available and then opens a grid of pending stop-type orders in the same direction of the first one The first order that we usually call the master trade  can be opened manually, on specified day and or via any other EA, indipendent from this one There is a dedicated Telegram Group with use cases and best settings, feel free to join and ask for
This is a   Semi-Automatic Martingale EA It is Semi-Automatic because It waits for the first executed order available and then opens a grid of pending limit orders in the same direction of the first one The first order that we usually call the   master trade  can be opened manually or via any other EA, indipendent from this one There is a dedicated   Telegram Group   with use cases and best settings   here , feel free to join and ask for a functional copy in demo accounts before buying  
フィルタ:
レビューなし
レビューに返信