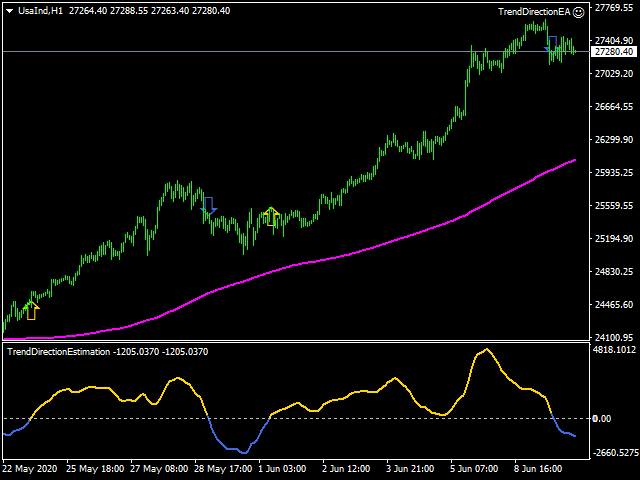
Trend Direction Estimation
- インディケータ
- バージョン: 2.30
- アクティベーション: 5

Trend Direction Estimation
* Please use the free demo before renting or buying.
This indicator works in all kinds of frames and presents you the trend in the time period you choose.
This trial period (Rental for 1 month) offered for promotion is valid for a limited number of copies.
At the end of the trial period, longer term rental and unlimited purchase options will also be opened in it's new prices.
My expert advisor work is continuing for the strategies I have been developing for the Trend Direction Estimation indicator.
When these studies are completed, you can find the article I will write for my strategies on my page.
I wish you happy trading.