Fractal Reverse MTF
- インディケータ
- バージョン: 1.5
- アップデート済み: 14 2月 2020
- アクティベーション: 8
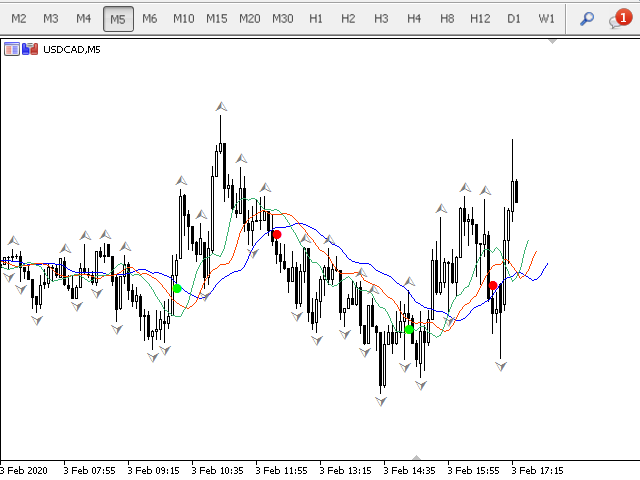
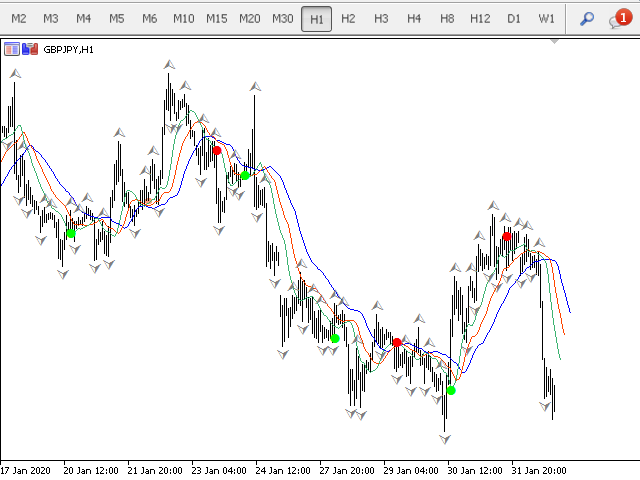
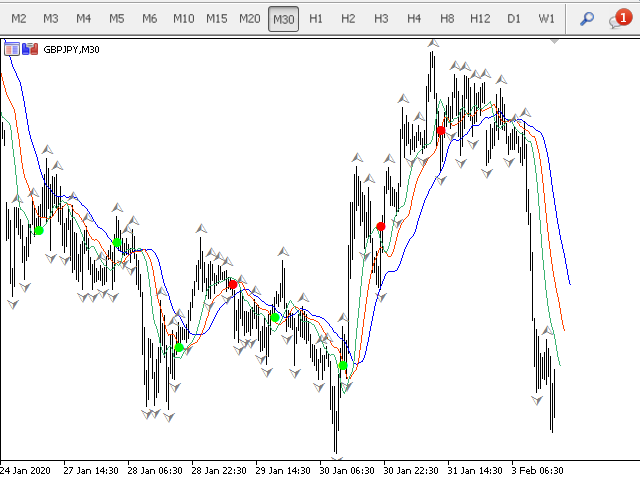
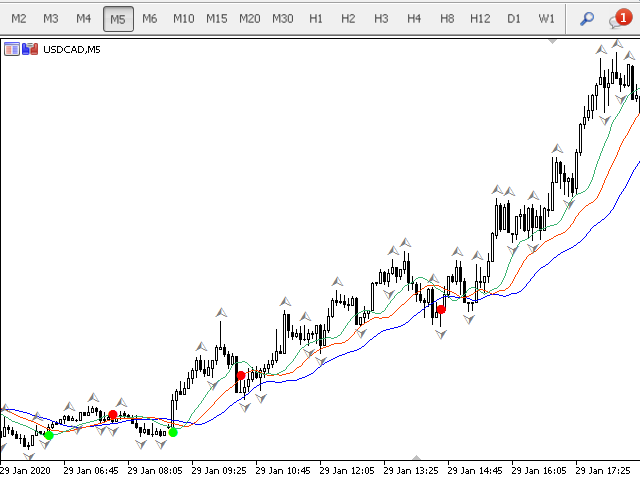
Fractal Reverse MTF - Indicator for determining the fractal signal to change the direction of the trend for МetaТrader 5.
The signal is determined according to the rules described in the third book of B. Williams:
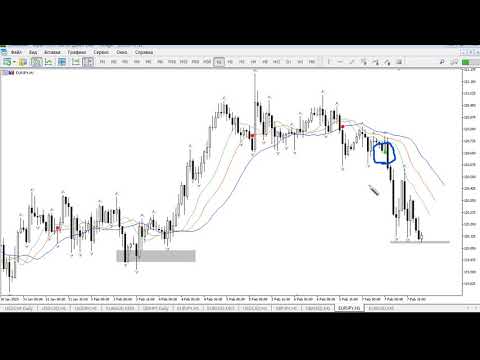
- In order to become a signal to BUY, the fractal must WORK ABOVE the red line
- In order to become a signal for SALE, the fractal must WORK BELOW the red line
- Signals are not redrawn/ not repainting
The main idea of the indicator:
- Determine the change in the direction of the trend using the fractal and the Alligator and make it as close as possible to the pivot point
Indicator Features:
- The signal appears at the moment of crossing the fractal level behind the red line of the Alligator
- Displays the signal on the selected timeframe
- Searches for a signal on given timeframes
- The indicator does not redraw
- The filter has a built-in filter that reduces the number of signals when the price is in correction
- The signals in the trend must be filtered out with the Alligator
- Mark the fractal signal on the chart
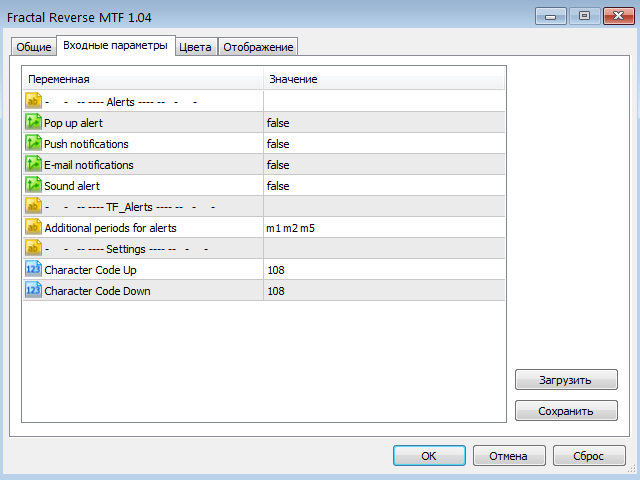
- Choose timeframes that need to be tracked
- Choose the type of alert: Alert, Push, Email, Sound
- Select the direction for which the notification will appear
- Ability to indent for arrows on the chart
- If your working timeframe does not have a fractal signal, but a trend changes, then the fractal structure changes on the lower timeframe. Therefore, you need to set the tracking signal -1 / -2 timeframe from the worker, so as not to miss the reversal
To change the display symbol on the chart, use this table:
https://www.mql5.com/ru/docs/constants/objectconstants/wingdings


Полезный, простой индикатор на разворот. Но надо знать в какой фазе следовать ему.