The Mode
- インディケータ
- バージョン: 1.6
- アップデート済み: 17 7月 2019

Overview
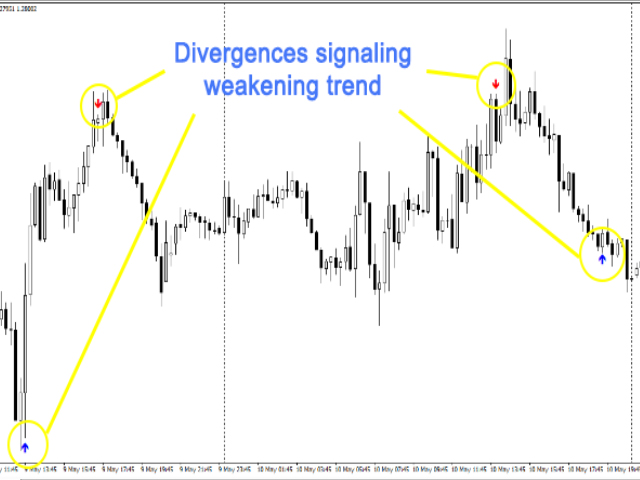
The M.O.D.E stands for Multiple Oscillator Divergence Exit.
It is an MT4 indicator that checks for divergence between price and multiple oscillators. The purpose is to help traders observe potential weakening in the current price movement when price and oscillator behavior disagree.
The indicator was originally designed as an exit and warning tool, but traders may also use it as a divergence reference within their own analysis process.
Key Features
- Checks divergence across multiple oscillators.
- Helps identify possible disagreement between price and oscillator behavior.
- Designed for closed-chart analysis without requiring several oscillator windows.
- Supports terminal alerts.
- Supports mobile push notifications.
Settings
GetAlerts: Enables or disables MT4 terminal alerts when a new divergence signal is detected.
PushNotifications: Enables or disables mobile push notifications when a new divergence signal is detected.
Important
Divergence is a context signal, not a standalone trading system. This indicator does not guarantee reversals, entries, exits, or trading results. Use it with your own market structure analysis and risk management.


Good.