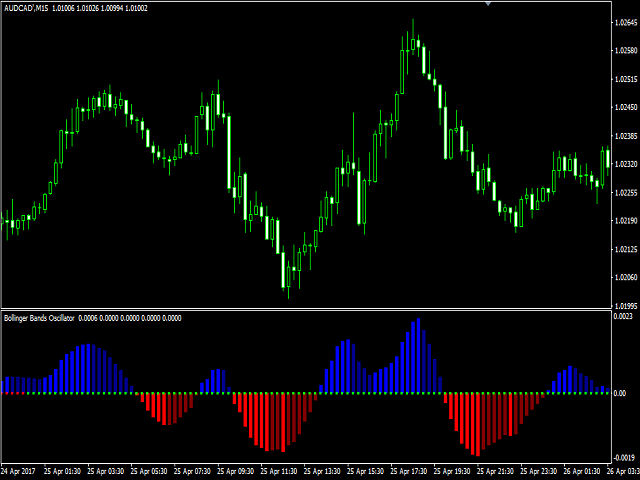
Bollinger Bands Oscillator
- インディケータ
- バージョン: 1.0
- アクティベーション: 20

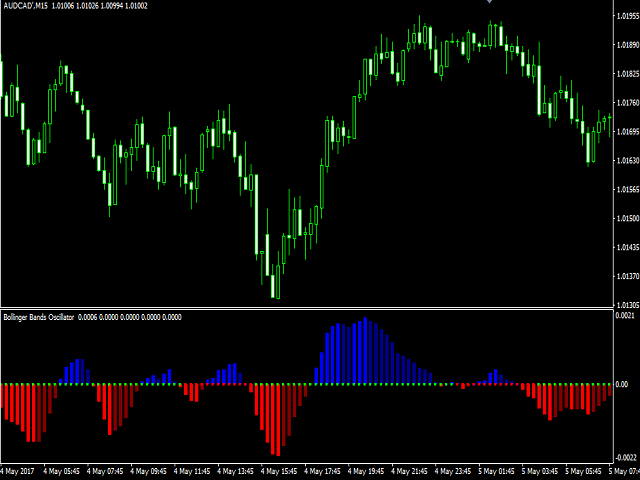
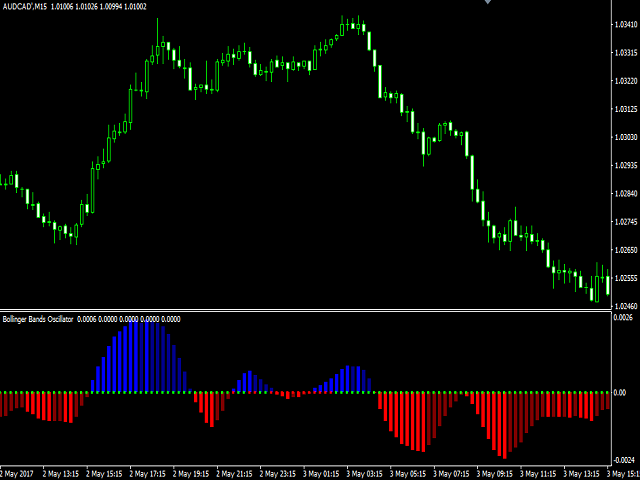
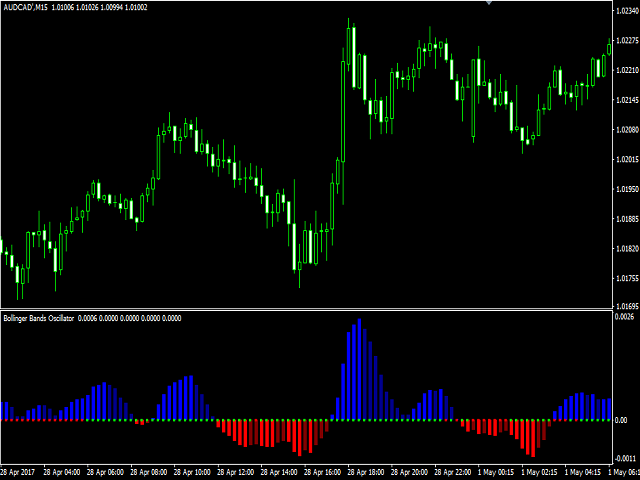
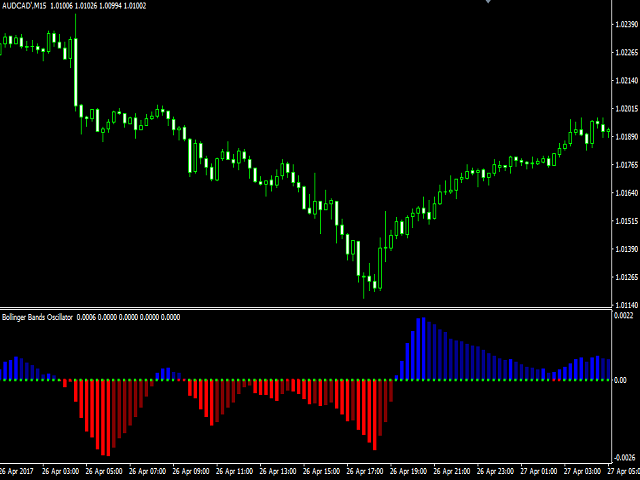
The Bollinger Bands Oscillator is an oscillator based on the "Mastering the Trade" strategy by John Carter. The strategy aims to track the movement from low to high volatility.
The Bollinger Bands Oscillator measures the market's momentum. If volatility increases, Bollinger Bands is expanding and encircling the Keltner channel. Bollinger Bands Oscillator uses Bollinger Bands and Keltner Channel. The Momentum indicator is also used as a confirmation of open positions.
Recommendations
Currency pairs: Any currency pairs (suggested Major)
Timeframe: Any, H1 and above recommended
Parameters
- Bollinger_Period - Standard Bollinger Bands period.
- Bollinger_Deviations - Standard Bollinger Bands deviations.
- Keltner_Period - Keltner channel period.
- Keltner_Factor - Keltner channel factor.
- Momentum_Period - Standard Momentum period.