FFx Pivot SR Suite PRO
- インディケータ
-
Eric Venturi-Bloxs
 Below some of my FFx trading tools available on MQL:
For MT5 platform:
- FFx Pivot SR Suite: https://www.mql5.com/en/market/product/25794 - バージョン: 1.1
- アップデート済み: 8 4月 2020
- アクティベーション: 20
MetaTrader 5 version available here: https://www.mql5.com/en/market/product/25794
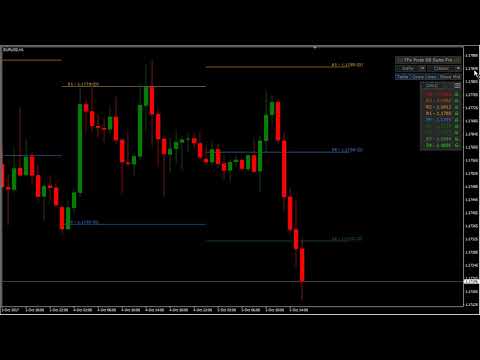
FFx Pivot SR Suite PRO is a complete suite for support and resistance levels. Support and Resistance are the most used levels in all kinds of trading.
Can be used to find reversal trend, to set targets and stop, etc.
The indicator is fully flexible directly from the chart
- 4 periods to choose for the calculation: 4Hours, Daily, Weekly and Monthly
- 4 formulas to choose for the calculation: Classic, Camarilla, Fibonacci and Woodies
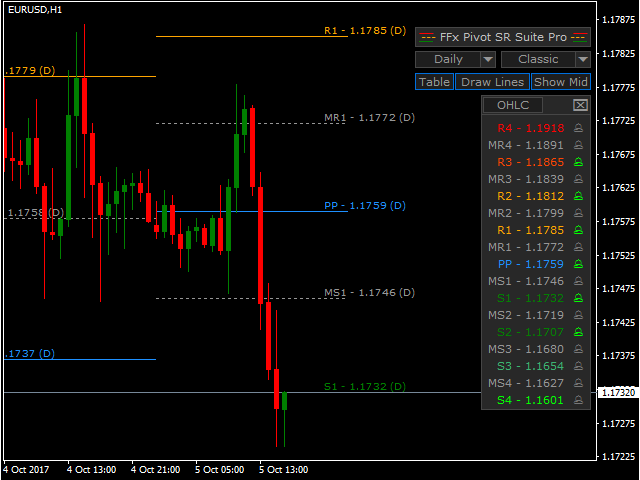
- Options to choose your own price OHLC for a custom calculation
- Alert selectable for each level separately
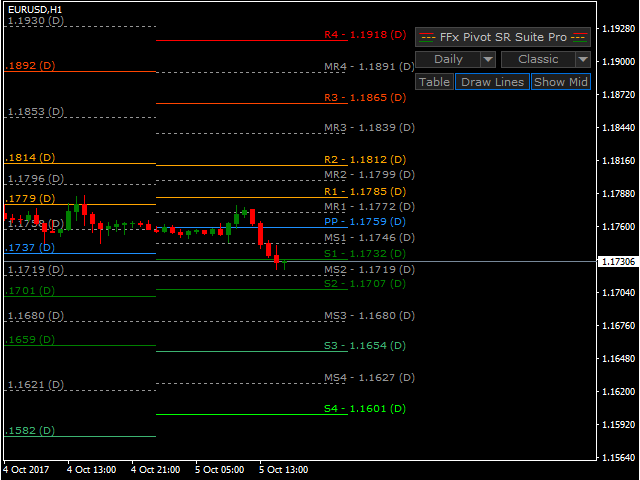
- Each level can be hidden
- Levels can be set to display multiple periods in history (great for studying past trading setups)
- Panel can be moved (drag and drop) anywhere on the chart
- Show or hide the levels table
- Show or hide the levels lines
User Inputs
- Panel ID - number for each instance applied on the same chart
- History Back Period - set here the number of periods in history to draw the SR lines
- Show Lines Text - set here if you want the name and price to be shown with each level
- Lines Text Shift - set here the shift of the lines text from the current candle
- Lines Style - select here the style for the lines (solid, dot, etc.)
- Lines Width - set here the width for the lines
- Levels Colors - set here the colors for each levels
- Fibo Levels - set here the Fibo % for the Fibo SR calculation
- Alert at Candle close - select here to enable the alert at candle close
- Sound Alert - select here to enable the sound alert
- Sound File - set here the sound file name
- Popup Alert - select here to enable the popup alert
- Email Alert - select here to enable the email alert
- Push Alert - select here to enable the push notification


ユーザーは評価に対して何もコメントを残しませんでした