VWAP Bands and Volume Profile

VWAP Bands and Volume Profile combines two common volume tools in one indicator: an anchored VWAP with deviation bands, and a volume profile with its main levels.

What it shows

  • VWAP anchored to a session start time of your choice, the day, the week or the month.
  • Up to three volume-weighted standard-deviation bands (default 1 and 2, with 3 optional), each with its own multiplier.
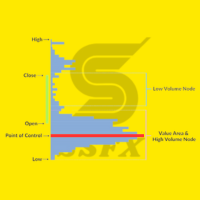
  • A volume profile of the current VWAP period or of the bars visible on your chart, drawn as horizontal rows.
  • Point of Control (POC), Value Area High (VAH) and Value Area Low (VAL), with the value-area percentage adjustable (default 70%).

Volume source

Many forex and CFD brokers, including for XAUUSD, only provide tick volume (the number of price changes). In automatic mode the indicator uses real volume when the broker supplies it and tick volume otherwise. It prints which one it is using in the Experts tab. You can also force either source. Tick volume is a measure of activity, not of traded contracts.

How it calculates

VWAP is the running sum of typical price times volume divided by the running sum of volume since the anchor. Values on closed candles do not change. The value on the current candle updates until it closes. The first candle of each period is left blank so lines from different periods are not joined. The profile spreads each candle's volume evenly across its high-low range, using M1 data where possible and a higher timeframe for long ranges. The profile of the running period updates every few seconds, and the visible-range profile updates when you scroll or zoom.

Forex and gold

No settings are in pips, so it works the same on EURUSD, USDJPY and XAUUSD. A daily anchor suits intraday charts on forex and gold; a weekly anchor suits H1 and H4.

Inputs

VWAP: anchor period, session start time, volume source, bands on or off and their multipliers.

Volume profile: mode (off, current period, visible range), number of rows, value area %, row length, colours, level labels.

Notes

  • This indicator does not open, modify or close trades. It is an analysis tool and not financial advice. Past behaviour of price does not guarantee future results, and no result is guaranteed.

Questions and suggestions are welcome in the comments section of this product.

おすすめのプロダクト
Stackable VWAP
Flavio Javier Jarabeck
3.5 (4)
Volume Weighted Average Price (VWAP) is a trading benchmark commonly used by Big Players that gives the average price a Symbol has traded throughout the day. It is based on both Volume and price. Additionally we put in this indicator the MVWAP (Moving Volume Weighted Average Price). For those who do not know the usage and the importance od this indicator I recommend a great article about this subject at Investopedia ( https://www.investopedia.com/articles/trading/11/trading-with-vwap-mvwap.asp
FREE
VWAP + Volume Profile Combined Indicator FREE Launch Offer OVERVIEW Professional combination of VWAP (Volume Weighted Average Price)  and Volume Profile in a single MT5 indicator. This powerful tool  combines two of the most respected institutional trading tools  into one seamless display. KEY FEATURES 1. VWAP with 6 calculation modes 2. Volume Profile with Value Area analysis 3. Point of Control identification 4. Standard deviation bands 5. Dynamic color changing 6. Separate buy/sell vol
FREE
IBI Vwap draws the Volume-Weighted Average Price calculated on the real volume of the exchange , with ±1 and ±2 standard-deviation bands. What you see VWAP : the average price paid by all participants since the session start, weighted by real traded volume. Institutions use it as a benchmark: above it buyers are in control, below it sellers are. ±1 and ±2 standard-deviation bands : how far price stretches from its average. The ±2 band marks an extension zone. Short labels on the right: VWAP (wit
FREE
VWAP Indicator
LUC JACOBUS A VERHEECKE
4.11 (27)
Volume Weighted Average Price (VWAP) The volume weighted average price (VWAP) is a  trading   benchmark  used by traders that gives the average price a security has traded at throughout the day, based on both volume and price. It is important because it provides traders with insight into both the trend and value of a security. This indicator VWAP V2 is free and is the manual version of the extended Easy VWAP indicator (30 Euro), where the date and time properties are automatically entered. With
FREE
PivoTrack VP MetaTrader 5向けのピボット起点ボリュームプロファイル指標。連続するPivot HighとPivot Lowの間のボリューム分布を可視化し、価格が受け入れられた領域と拒否された領域を明確に示します。 PivoTrack VPはMetaTrader 5向けのボリューム分析指標です。任意のチャート上でPivot HighとPivot Lowを自動検出し、各区間のボリュームプロファイルを完全に描画します。コントロールポイント(POC)、バリューエリアハイ(VAH)、バリューエリアロー(VAL)、バリューエリアの背景塗りつぶしを表示し、各価格スイングのボリューム分布を明確に把握できます。また、直近の確認済みピボットから現在のバーまでの区間を追跡するデベロッピングプロファイルをリアルタイムで更新します。   概要 この指標は、左右のバー数を設定可能なPivot HighとPivot Lowを検出することでチャート履歴を区間に分割します。完了した各区間では、設定可能な価格行数にわたってボリュームがどのように分布しているかを計算し、ヒストグラムを描画、最大ボリュー
FREE
VWAP and MVWAP
Flavio Javier Jarabeck
4 (9)
Volume Weighted Average Price (VWAP) is a trading benchmark commonly used by Big Players that gives the average price a Symbol has traded throughout the day. It is based on both Volume and price. Additionally we put in this indicator the MVWAP (Moving Volume Weighted Average Price). For those who do not know the usage and the importance od this indicator I recommend a great article about this subject at Investopedia ( https://www.investopedia.com/articles/trading/11/trading-with-vwap-mvwap.asp )
FREE
Session and Anchored VWAP は出来高加重平均価格(VWAP)を表示します。VWAP とは、ある期間に支払われた価格を出来高で加重した平均です。2つのバージョンを含みます。日・週・月ごとにリセットされるものと、指定した時点を起点とするものです。 仕組み - 期間 VWAP:毎日(ブローカーのサーバー時間)、毎週(月曜日)、または毎月の始めにリセットされ、そこから価格 × 出来高を累積します。 - 指定した標準偏差の倍数で最大2本のバンドを表示し、価格が平均からどれだけ離れたかを示します。 - Anchored VWAP:指定したサーバー日時(たとえばニュースの発表や大きなスイングロー)から始まり、最新のバーまで続きます。 - 価格には、典型価格 (H+L+C)/3、終値、中央値 (H+L)/2 のいずれかを使えます。 - 出来高には、MT5 で常に利用できるティックボリューム、またはブローカーが提供していればリアルボリュームを使えます。 - すべての値はインジケーターバッファとして出力されるため、データウィンドウに表示され、他のプログラムから iCustom で
FREE
THV Daily VWAP MT5 – Daily Volume Weighted Average Price THV Daily VWAP MT5 is a technical indicator designed to display the Daily Volume Weighted Average Price (VWAP) directly on your MetaTrader 5 chart. Unlike traditional VWAP indicators that may only display limited session data or reset at specific trading sessions, this indicator plots a continuous VWAP line throughout the trading day, making it easy to observe how price behaves relative to the daily volume-weighted average price. The VWAP
FREE
Phoenix Measured Box
Nigel Nii Darku Narnor Darko
PHOENIX MEASURED BOX DASHBOARD, engineered specifically for Phoenix Au Trading to provide "No dreams, just the tools" for high-precision institutional-style trading. 1. THE INDICATOR DEFINITION The Phoenix Measured Box is a multi-dimensional analysis tool designed for SMC (Smart Money Concepts) and ICT-style traders. It combines time-segmented price action with real-time volume metrics and automated target projections. Key Components: 15m Range Boxes: Automatically identifies and boxes every 15
FREE
DS RVOL: The Relative Volume Indicator for MT5 RVOL is a straightforward Relative Volume (RVOL) indicator for MetaTrader 5. It shows you how current volume compares to a historical average, providing a quick way to gauge the strength of a price move. How it Works Relative Volume is a simple ratio: R V O L = C u rre n t V o l u m e ​/ A v er a g e H i s t or i c a l V o l u m e RVOL > 1.0 : Volume is higher than usual. This suggests there's strong interest and potential for a sustained move. RVOL
FREE
Midas VWAP
Paulo Henrique Faquineli Garcia
4 (2)
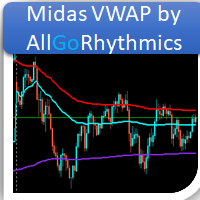
Volume Weighted Average Price (VWAP) is a trading benchmark commonly used by Big Players that gives the average price a Symbol has traded throughout the day. It is based on both Volume and price. This indicator contains Daily VWAP and MIDAS' VWAP, which means you are able to anchor the beggining of MIDAS' calculations and, therefore you will be able to use this methodology to study price versus volume moves after anchor point. You will be able to anchor up to 3 HIGH MIDAS VWAP's and 3 LOW. Wish
FREE
MIDAS Super VWAP
Flavio Javier Jarabeck
4.27 (11)
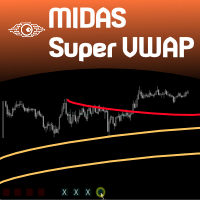
Imagine VWAP, MVWAP and MIDAS in one place... Well, you found it! Now you can track the movement of Big Players in various ways, as they in general pursue the benchmarks related to this measuring, gauging if they had good execution or poor execution on their orders. Traders and analysts use the VWAP to eliminate the noise that occurs throughout the day, so they can measure what prices buyers and sellers are really trading. VWAP gives traders insight into how a stock trades for that day and deter
FREE
Frato Vwap Bands
Francisco Felipe Alves Da Silva Rocha
Frato VWAPバンド — 標準偏差付き出来高加重平均価格 Frato VWAPバンドは、従来のVWAPと動的なボラティリティバンドを組み合わせたインジケーターです。出来高加重平均価格を複数期間にわたって表示します。 主な機能: このインジケーターは、VWAP(出来高加重平均価格)を計算し、標準偏差に基づいて最大3つの上下バンドをプロットします。計算は、選択された各期間(1時間足、4時間足、日足、週足、月足)の開始時にリセットされるため、日中および長期トレンド分析が可能です。 標準偏差バンドは、VWAPと同じ出来高で加重されます。これにより、バンドは動的で市場の動きに敏感に反応し、平均から外れた価格変動や潜在的な反転ゾーンを特定するのに役立ちます。 解釈ガイド:VWAPラインは、加重平均価格の基準としてよく使用されます。VWAPラインより上の取引は買い圧力を示唆し、下の取引は売り圧力を示唆します。バンドは動的な基準レベルとして機能し、外側のバンドは統計的に有意な極値を示します。 設定パラメータ: 期間:VWAPのリセット頻度を定義します。 - 1時間足(H1):0
FREE
Macro-R Pro Signal — Advanced Trading Signal Indicator Macro-R Pro Signal is a professional trading indicator designed to deliver high-quality BUY and SELL signals with enhanced precision and reduced market noise. By combining Bollinger Bands, RSI, and adaptive volatility filtering , this indicator helps traders identify high-probability reversal points while avoiding unfavorable market conditions. How the Strategy Works This indicator is built on a mean reversion + momentum confirmation concep
FREE
Weis Waves(ワイス・ウェーブ) は、デビッド・ワイスが開発し、リチャード・ワイコフの理論に基づいたテクニカル指標です。 従来の出来高がバーごとに表示されるのとは異なり、Weis Waves は出来高を上昇または下降の「波」として蓄積し、価格の方向が変わると新しいカウントを開始します。 この方法により、トレーダーは市場の動きの 本当の強さ を明確に把握することができます。 主な特徴: 出来高を買いと売りの波にまとめる。 支配的な圧力(買い手または売り手)を強調。 トレンドの継続 または 反転の可能性 を識別。 ワイコフ理論に基づき、出来高・フロー分析で広く使用される。 Weis Waves は、価格と出来高のバランスを評価するために、多くのプロトレーダーによって利用され、市場ダイナミクスの詳細な視点を提供します。
FREE
SnR PREMIUM Smart Support & Resistance Indicator Trade from the Zone. Manage with Precision. SnR Premium adalah indikator Support & Resistance yang dirancang untuk membantu trader membaca area penting pada chart dengan visual yang bersih, sederhana, dan mudah digunakan. Tidak hanya menampilkan zona Support & Resistance, SnR Premium juga dilengkapi dengan panel trading management untuk membantu trader melakukan pengelolaan posisi secara lebih praktis. KEY FEATURES SMART SUPPORT & RESISTANCE
FREE
Adaptive Volume Profile 直近のバーのボリュームプロファイルをチャート上に直接描画します。ポイントオブコントロール(POC)、バリューエリア(VAH / VAL)、高ボリュームノード(HVN)、低ボリュームノード(LVN)、オプションのボリュームヒストグラムを表示します。価格行のサイズは現在のボラティリティ(ATR)に適応するため、どの銘柄・時間足でも見やすいプロファイルになります。 機能 POC - ウィンドウ内で最も出来高の多い価格水準 Value Area (VAH / VAL) - 選択した割合の出来高を含む価格帯(デフォルトは70%) HVN / LVN - 高ボリューム・低ボリュームのノード(価格が停滞しやすい、または素早く動きやすい水準)。プロファイルの平均出来高との比較で統計的に検出します。隣接する行は1つのゾーンに統合され、チャートがすっきり保たれます 適応型の行幅 - 価格行はATRから決まり、最大行数で制限されます リアルタイムのローリングプロファイル - 新しいバーごとに直近N本から再計算されます 固定日付プロファイル - 選択した日付(例
FREE
The   Real Flow Defense Levels   indicator is a proprietary tool designed to identify and plot   significant, high-conviction price zones   directly onto your main trading chart. It uses a dynamic, volume-based analysis to determine where the market has previously demonstrated the   strongest defense or concentration of activity . These plotted lines serve as   dynamic support and resistance levels , highlighting the prices where major participants are most likely to enter or defend their positi
FREE
VWAP Fibo Bands RSJ は、選択した期間の VWAP を描画し、その周囲にフィボナッチ比率に基づくバンドを作成します。 このインジケーターは VWAP の周囲に10本のバンドを描画します。バンドは価格が出来高加重平均価格からどれだけ離れたかを示し、エントリー、決済、ストップを計画するための参考レベルとして利用できます。 バンドは30分足以下の時間足で特に読み取りやすくなります。 入力パラメータ Calculation Volume Type Calculation Price Type VWAP Period Time 各バンドは VWAP から一定のフィボナッチ距離に描画されるため、同じレベルを日ごとに比較できます。 ご質問がありましたら、ダイレクトメッセージでお送りください: https://www.mql5.com/en/users/robsjunqueira/
FREE
Daily VWAP
Riccardo Moreo
4.8 (5)
This is the Volume Avarage Weighted Price (VWAP) it's a indicator that shows where is the avarage of the current volumes and the levels at which the price is considered premium, above the second upper band, or discount, under the second lower band, it's also very usefull to use the VWAP level as a target for operations since it's a very liquid level so the price it's attracted to it. feel free to leave a feedback either positive or negative based on your expereince with this indicator, enjoy the
FREE
VWAP Diaria
Samuel De Souza Ferreira
Daily VWAP — Institutional Reference for Intraday Value The Daily VWAP is a professional indicator based on the Volume-Weighted Average Price (VWAP) , designed to reveal the true balance between price and volume throughout the trading session. Unlike traditional moving averages, the Daily VWAP incorporates the weight of traded volume in every price movement, providing a much more accurate reference to the behavior of institutional traders and large market participants. What the indicator deliver
FREE
Delta Aggression Volume は、成行買いと成行売りのどちらが多く取引されたかを足ごとに表示します。B3 や CME 先物など、実際の約定データがある銘柄で動作します。 機能 各足のアグレッション・デルタ(成行買いの出来高 − 成行売りの出来高)を計算します。 各足の差をサブウィンドウに描き、優勢だった側の色で表示します。 動作条件 実際の約定がある取引所銘柄:B3 の先物と株式(WIN、WDO、PETR4 …)、CME 先物(ES、NQ、CL、GC とそのマイクロ契約)。 ブローカーのデータが各約定のアグレッサー(買いまたは売り)を提供している必要があります。FX、暗号資産、CFD のデータにはこの情報がないため、指標は表示されません。 パラメーター 出来高の種類:実出来高または約定回数(ティック出来高)。 計算開始:直近1日から利用可能な全期間まで。 DELTA AGGRESSION VOLUME PRO Delta Aggression Volume PRO は同じ計算を使い、リバースバー、2つの計算モードを持つレンジチャネル、総出来高の移動平均、6つの設定可能
FREE
Value Chart Candlesticks
Flavio Javier Jarabeck
4.57 (14)
The idea of a Value Chart indicator was presented in the very good book I read back in 2020 , " Dynamic Trading Indicators: Winning with Value Charts and Price Action Profile ", from the authors Mark Helweg and David Stendahl. The idea is simple and the result is pure genius: Present candlestick Price analysis in a detrended way! HOW TO READ THIS INDICATOR Look for Overbought and Oversold levels. Of course, you will need to test the settings a lot to find the "correct" one for your approach. It
FREE
VP hidden
Emr Aljnaby
4.33 (12)
The indicator works to convert normal volume into levels and determine financial liquidity control points. It is very similar in function to Fixed Volume Profile. But it is considered more accurate and easier to use than the one found on Trading View because it calculates the full trading volumes in each candle and in all the brokers present in MetaTrade, unlike what is found in Trading View, as it only measures the broker’s displayed prices. To follow us on social media platforms: telegram
FREE
Liquidity Pressure Index
Murtadha Majid Jeyad Al-Khuzaie
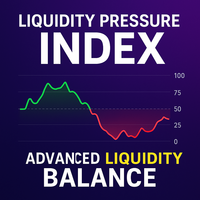
Liquidity Pressure Index (LPI) is an advanced technical indicator designed to uncover the hidden battle between buyers and sellers in the market. Unlike conventional oscillators that only rely on price movements, LPI integrates market depth (order book data), ATR-based volatility compression, and adaptive smoothing to give traders a deeper view of true liquidity dynamics. By combining price action with volume absorption and order flow pressure, the LPI helps traders anticipate shifts in market
FREE
Candlestick Patterns Context labels well-known candle patterns. It also lets you hide the small or out-of-context ones that make most pattern tools noisy. Patterns (each can be switched on or off) - Bullish and bearish engulfing - Hammer and shooting star - Bullish and bearish harami - Piercing line and dark cloud cover - Morning star and evening star - Three white soldiers and three black crows (off by default) - Doji (off by default; labelled with no direction) Filters - Minimum size: the sign
FREE
Wave Box Market Frenquency
Jean Jacques Huve Ribeiro
4.75 (4)
Totally linked to the result of a movement and the duration he had. Its height records how many ticks the asset walked during a given movement, its width shows us the duration that movement had. Its configuration must be in line with the Weis Wave Indicator configuration to observe the movement force and can indicate a possible accumulation or distribution of the movement;
FREE
Aggression Volume
Flavio Javier Jarabeck
4.29 (17)
Aggression Volume Indicator is the kind of indicator that is rarely found in the MQL5 community because it is not based on the standard Volume data provided by the Metatrader 5 platform. It requires the scrutiny of all traffic Ticks requested on the platform... That said, Aggression Volume indicator requests all Tick Data from your Broker and processes it to build a very special version of a Volume Indicator, where Buyers and Sellers aggressions are plotted in a form of Histogram. Additionally,
FREE
Vegas indicador
Valter Cezar Costa
3.5 (2)
Esse Indicador é uma boa opção para quem gosta de operar a longo prazo e com paciência. Ele trabalho com os níveis de fibo na media de 200 são  9 níveis  onde você pode operar nas reversões o mercado partir do níveis abaixo.    Level 1 = 550 pontos    Level 2 = 890 pontos    Level 3 = 1440 pontos    Level 4 = 2330 pontos    Level 5 = 3770 pontos    Level 7 = 9870 pontos    Level 8 = 15970 pontos   Level 9 = 25840 pontos      Level 6 = 6100 pontos
FREE
White Weis Volume This indicator shows the sum of the volume in each wave, bulish or bearish, as idealized by David Weis , but it brings an important addition , which is the marking of the bar with the highest volume of the wave (White Bar)! In coding the indicator, it was sought to optimize the code to require minimal processing during use and not to overload mt5. The indicator can be used for pre-trading analysis and study, where the trader analyzes possible points of support and resistance
このプロダクトを購入した人は以下も購入しています
Trend Sniper X
Sarvarbek Abduvoxobov
4.86 (44)
Trend Sniper X は、トレードの方向性と潜在的な反転ポイントを明確かつ正確に特定するのに役立つ、MetaTrader 5 用のマルチタイムフレーム・トレンドフォロー指標です。 MT4用: https://www.mql5.com/en/market/product/193245 価格情報: 現在の価格はプロモーション価格であり、今後のアップデートや新機能のリリースに伴い変更される場合があります。 ボーナス特典: このインジケーター用の無料自動売買アシスタントEAを入手するには、購入後に an 著者(開発者)へメッセージをお送りください。 Code2Profit チャンネル マルチタイムフレーム分析で相場をマスターしよう! Trend Sniper X で勝率を最大化する方法:重要なルールとセッションのコツ 技術仕様 プラットフォーム MetaTrader 5 インジケータータイプ マルチタイムフレーム・トレンドインジケーター 操作タイムフレーム あらゆるチャートタイムフレームに対応。個別に選択可能な上位タイムフレーム (M1–MN1) を搭載 主要銘柄 FX、ゴールド (X
新たな王者が登場 - インジケーター + 注文管理表示(TP1 + TP2 + TP3)+ オプションのTelegramシグナル送信機能付き(無料) (完全なトレード&シグナルシステム) ゴールド向け最高のEA: Gold Slayer このインジケーターには、高度な戦略、カスタマイズ可能な注文管理システム、そしてエンベロープ拡張を組み合わせた平均回帰システムが搭載されています。さらに、RSIなど複数のインテリジェントな確認フィルターによって、高確率の反転エントリーをBUY・SELLシグナルとして検出します。 単にトレードを学ぶだけでなく、複数ポジションを効果的に管理し、過去に利益を出しているオープンポジションで損失トレードをカバーする方法も学べます。 M5向けに構築・最適化されており、流動性が高くシグナルの精度が安定しているBTCUSDとXAUUSDで優れたパフォーマンスを発揮します。 このインジケーターは、ATRを基に自動計算されたエントリー、ストップロス、テイクプロフィットレベルを備えた明確なLong・Shortシグナルを提供するため、リスク管理が最初から組み込まれています。 マ
Smart Trend Trading System — MetaTrader 5 ご購入後、MQL5で私にメッセージをお送りいただくと、Smart Universal Expert Advisorを無料で受け取れるほか、オンライン講座、PDFマニュアル、非公開グループへのアクセスもご利用いただけます。 STTSは、トレンドの方向、エントリー・決済シグナル、反転ゾーン、重要な価格水準をチャート上にまとめて表示します。システムを参考に手動で取引することも、別の対応EAを接続し、ご自身で選んだ設定に基づいて自動売買することもできます。 ひとつのシステム、4つのトレードアプローチ STTSのトレードアプローチは、大きく4つのカテゴリーに分かれています。 • スキャルピング — 短期的なシグナルや相場の動きを捉えます。 • トレンドトレード — 方向性を評価し、トレンド内の機会を探します。 • 反転トレード — 反転の可能性があるゾーンや方向の変化を見つけます。 • 出来高トレード — 出来高に基づく情報を使い、市場の活発さを評価します。 エントリー・決済の矢印、トレンド情報、サポート・
Zoryk Gold
Reda El Koutbane
4.78 (18)
割引は 24 時間後に終了します — 次の価格は$ 69 ZORYK — MetaTrader 5専用 XAUUSDシグナル・トレードプランニングシステム このような経験はありませんか。 ゴールドを分析し、エントリーを待ち、ようやくポジションを持った直後に価格が逆方向へ動く。 早すぎる決済をしてしまったり、Stop Lossを動かしたり、数秒迷っている間にチャンスを逃したりする。 その後、相場は自分が最初に予想していた方向へ進み、目標へ到達する。 問題は常に方向判断ではありません。 本当の問題は、明確な計画がなかったことです。 どこでエントリーすべきか。 どこでトレードの前提が無効になるのか。 近い利益を確保すべきか、より大きな値動きを待つべきか。 現在のsetupが本当に強いのか、それとも無理にトレードを探しているだけなのか。 ゴールドは非常に速く動きます。 正しい分析でも、明確なプランがなければ数秒で悪い判断に変わることがあります。 ZORYKは、その問題を解決するために開発されました。 ZORYKとは ZORYKは、MetaTrader 5とXAU
あなたのトレード優位性を視界に入れよう! M5 Sniper は MeanFX による新しいインジケーターです。 正確なトレードシグナル と 適応型TP/SLレベル を組み合わせることで、結果として可能な限り最高の統計的トレードを実現します! 5回購入されるごとに価格が上昇し、次の価格は69$です 購入後に私にメッセージを送っていただければ、ヒント/ガイドとボーナスEAをお受け取りいただけます 何が他と違うのでしょうか? Gold XAUUSDにおける 実証済みの統計的パフォーマンス ( ほぼすべてのアセットで機能します 。一貫した結果が得られないまま何でも扱おうとするのではなく、1つの時間足をマスターすることに重点を置いています) 1日あたり1~8回のトレード を各シンボルで実行し、高い勝率と、すべての統計的優位性をこちら側に持つことができます チャート上には 確認済みの BUYおよびSELLシグナルのみを表示 適応型TPおよびSLレベル を各トレードごとにインジケーターが生成 平均Winrate 75%+ 平均 Signal Ratio 最低1.1+ アラーム と通知を 携帯電話
Entry Points Proは、注文を出す前に、どこでエントリーし、どこにストップを置き、どのロットで取引するかを示します。 価格 現在 199 USD、この価格での販売は 10 本です。その後は 249 USD、最終価格は 349 USD です。 私は相場のトレードで収入を得ており、それを公開しています。だから、このインジケーターを誰にでも売る必要はありません。自分の頭で考えるトレーダーのためのツールであり、魔法のボタンではありません。 矢印はローソク足の確定時に表示され、リペイントしません。設定は2つ:あなたの資金と1回のトレードあたりのリスクです。 お支払い前にご確認ください:無料デモはMT5のストラテジーテスターで動作し、2分で済みます。ご購入後は、私が個人的に設定をお手伝いします。 2019年、私はこのインジケーターの実力を世界中に示しました。そのシグナルに従って手動で、リアル口座で、公開の場でトレードしたのです。口座はMyfxbookでモニタリングされ、私はこの実験の経過をFacebookで詳しく発信していました。結果:4か月で10,000ドルが941,411ドルにな
ULTRAは、「オールインワン」方式で機能するテクニカル指標です。市場を独自に分析し、売買シグナルを生成し、ストップロス注文を設定するための水準を表示し、利益を確定したり損失を最小限に抑えたりするためにポジションを決済すべきタイミングを提案します。 つまり、市場の分析方法や、水準(ストップロスをどこに設定すべきか)の見極め方がわからなくても、あるいは資金管理に苦労していても問題ありません。ULTRAがすべて代行してくれます! 購入者限定特典 :「ULTRA」インジケーターをご購入後、私にプライベートメッセージをお送りいただければ、「ULTRA BOT」を無料プレゼントとしてお受け取りいただけます。これは、このインジケーターからのシグナルに基づいて、オープンしたトレードを管理するのに役立つ特別なツールです(各トレードにストップロスを設定し、最適な結果が得られるよう、戦略のルールに従って自動的にトレードを決済します)。  また、インジケーターを最大限に活用できるよう、さまざまな資産向けの既成の設定も購入者の皆様に提供しています。これらの「超お得な特典」を無料で入手するには、私へダイレクトメ
Gann Made Easy   は、ミスター・ギャンの理論を使用した取引の最良の原則に基づいた、プロフェッショナルで使いやすい外国為替取引システムです。 W・D・ガン。このインジケーターは、ストップロスとテイクプロフィットレベルを含む正確な買いと売りのシグナルを提供します。 PUSH通知を利用して外出先でも取引可能です。 ご購入後、取引方法の説明と優れた追加インジケーターを無料で入手するには、私にご連絡ください! おそらく、ギャンの取引手法についてはすでに何度も聞いたことがあるでしょう。通常、ギャンの理論は初心者のトレーダーだけでなく、すでにある程度の取引経験がある人にとっても非常に複雑なものです。なぜなら、ギャンの取引手法は理論的にはそれほど簡単に適用できるものではないからです。私はその知識を磨き、最良の原則を私の外国為替インジケーターに組み込むために数年を費やしました。 このインジケーターは非常に簡単に適用できます。必要なのは、それをチャートに添付し、簡単な取引推奨事項に従うだけです。このインジケーターは常に市場分析の仕事を行い、取引の機会を探します。適切なエントリーポイントを検
SuperScalp Pro
Van Minh Nguyen
4.54 (37)
SuperScalp Pro - Professional Multi-Layer Confluence Scalping System SuperScalp Proは、複数の高度な確認フィルターを追加することで、従来のSupertrendを強化したスキャルピング向けインジケーターです。誤ったシグナルを大幅に減らしながら、成功する可能性がより高いBuy/Sellの取引機会を見つけるのに役立ちます。 BuyとSellの矢印がチャート上に明確に表示され、ATRに基づくStop LossとTake Profitのレベルもリアルタイムで自動計算されます。 ご購入後、MQL5で私にメッセージを送っていただくと、SuperScalp Pro Auto Trader EAを無料で受け取れるほか、ユーザーガイドとプライベートグループへのアクセスもご利用いただけます。 推奨設定ファイルをダウンロード: [Set File] 詳細なドキュメントは製品ブログでご覧いただけます: [User Guide] 最新情報を受け取るには公式チャンネルにご参加ください: [Official Channel] Sup
GoldenX Entry MT5
VividMind Digital Solutions
5 (17)
GoldenX Entryは、MT5向けのインジケーターであり、適応型Smart Entry Trendアルゴリズム、シグナルスコアリングシステム、マーケットレジーム検出機能、およびボラティリティフィルターを備えています。各シグナルには、計算されたエントリーレベル、3つのテイクプロフィット(TP1、TP2、TP3)、およびストップロスレベルが含まれます。本インジケーターは、異なる市場環境に適応するために設計された複数の分析レイヤー上に構築されており、マルチレイヤー分析システムと内蔵オプティマイザーおよび統計トラッキングシステムを組み合わせています。リスク・リワード(RR)指標および過去のトレード履歴に基づく定量分析を提供します。 使い始めは簡単です — 選択した時間足でオプティマイザーを実行し、そのままチャート上でインジケーターを使用します。 コア機能 GoldenX Entryは、シグナルエンジンとトレード管理機能、そして過去統計トラッキングを1つのチャートに統合しています: - 内蔵オプティマイザー: オプティマイザーはチャート上でワンクリックで実行できます。200通りのパラメー
Gold Trend Coach MT5
Cristhian Alexander Gaibor Cuasquer
4.27 (11)
MetaTrader 5 向け、ゴールド(XAUUSD)のリペイントしない売買シグナル。すべてのシグナルに損切りラインと3つの利確ラインが付きます。BOS と CHoCH を使った Smart Money Concepts フィルターで、相場の構造に逆らわず、構造に沿ってトレードできます。パネル上のライブ・メンターが、エントリーから TP3 まで一歩ずつナビゲート。アラートはスマホとあなた自身の Telegram チャンネルに直接届きます。それが Gold Trend Coach。もう一人でトレードすることはありません。 ご購入特典・無料の購入者キット: 1. Telegram Alert Bridge: シグナルをあなた自身の Telegram チャンネルへ。チャートのスクリーンショットと日次レポート付き。 2. ユーザーマニュアルと設定ガイド。 受け取り方: キットはダウンロードファイルには含まれていません。購入後に MQL5 のメッセージでご連絡ください。当日中にお送りします。 $39 と $45 のローンチ価格分は完売しました。現在は次の10本まで $59、その後は $79
SMC Intraday Formula
VividMind Digital Solutions
5 (26)
まず正直に言いましょう。 どんなインジケーターも、それ単体であなたを利益化させることはできません。もしそう言う人がいるなら、それは夢を売っているだけです。完璧な売買シグナル(矢印)を表示するインジケーターは、いくらでも“完璧に見せる”ことができます。正しい過去の区間を拡大して、勝ちトレードだけを切り取ればいいだけです。私たちはそれをしません。 SMC Intraday Formula はツールです。 市場構造を読み取り、最も高い確率の価格ゾーンを特定し、今この瞬間のスマートマネーの痕跡をシンプルな言葉で正確に示します。最終判断はあなたが行います。トレードを実行するのもあなたです。しかし今は「希望」ではなく「精度」でエントリーできます。 私たちはこのインジケーターを、ゴールド(XAUUSD)および主要FX通貨ペアで約3年間、日々のスキャルピングに使用してきました。M1、M5、M15、M30の主要ツールです。これは未来を予測しようとするのではなく、今まさに形成されている高確率セットアップを示し、その理由を説明します。 他のすべてのインジケーターと何が違うのか? ほとんどのトレーディングイ
Boba Analysis Suite
Trade Ready Solutions LLC
5 (2)
Boba Analysis Suite Boba Analysis Suite は、MetaTrader 5 向けの分析インジケーターです。市場構造、重要な価格帯、相場全体の状況を、一つのチャート画面にまとめて表示します。 トレーダーおよびトレーディング指導者としての実務経験をもとに開発され、市場の方向性の評価、重要な価格水準の特定、複数の時間足を組み合わせた分析など、体系的な分析プロセスを支援します。 相場の背景を踏まえた分析 個々のシグナルの意味は、相場の状況によって変わります。Boba Analysis Suite は、現在のチャート状況をより大きな市場構造と関連付け、あらかじめ定めたルールに沿って取引アイデアを検討するための分析を支援します。 主な分析機能: トレンドと市場構造: 市場の方向性と、その背景にある構造を評価します。 重要な価格帯と価格水準: さらに分析すべき重要な領域を視覚的に表示します。 複数の時間足: 異なる時間足の情報を組み合わせ、相場全体の状況を評価します。 視覚的な分析プロセス: 分析情報をチャート上で直接確認できます。 自主的な取引判断を支援 Boba
Gold Entry Sniper – ゴールドスキャルピング&スイングトレード用プロフェッショナル多時間足ATRダッシュボード Gold Entry Sniper は、XAUUSDや他の銘柄向けに正確な 売買シグナル を提供する、MetaTrader 5用の高度なインジケーターです。 ATRトレーリングストップロジック と 多時間足分析ダッシュボード を搭載し、スキャルピングからスイングトレードまで対応します。 主な特徴と利点 多時間足シグナル分析 – M1、M5、M15 のトレンドを同時表示。 ATRベースのトレーリングストップ – ボラティリティに応じて動的に調整。 プロ仕様のチャートダッシュボード – シグナル状況、ATRレベル、回帰線、売買方向を表示。 明確な売買マーカー – 自動矢印とテキストラベル。 エグジットアラートとトレード管理 – 利益確定のための自動検出。 完全カスタマイズ可能 – パネル位置、色、フォント、ATR/回帰設定を調整可能。 ゴールド(XAUUSD)に最適化 – M1〜M15のスキャルピングに最適、FXや指数、暗号資産にも対応。 Gold Entry
次回アップデート — バージョン 2.52 近日公開!【新機能】 市場分析とトレードワークフローを強化する、4つの主要な新機能にご期待ください 皆様のトレードニーズに応える4つの新機能により、市場分析を次のレベルへと引き上げます。新機能をご紹介します: 1. TRADE OVERVIEW DASHBOARD 2. CONFLUENCE AT ZONE 3. STRONG & WEAK HIGH/LOW 4. OTE 1. TRADE OVERVIEW DASHBOARD 市場全体の状況をより簡単に把握できるダッシュボードです。トレード判断をサポートするガイダンスを提供し、市場分析とトレード計画を体系的に行えるよう支援します。すべてを1つの画面で確認できます。 マルチタイムフレーム市場概要(Multi-Timeframe Market Overview) 市場の方向性と価格構造をより明確に把握 市場状況をすばやく確認 体系的な市場分析とエントリー計画のためのガイダンス 2. CONFLUENCE AT ZONE 価格が重要なゾーンに入るとき…いくつのサポート要因が一致しているかを確認で
FX Power: 通貨の強弱を分析して、より賢い取引を実現 概要 FX Power は主要通貨と金の実際の強弱をあらゆる市場状況で理解するための必須ツールです。強い通貨を買い、弱い通貨を売ることで、 FX Power は取引の意思決定を簡素化し、高い確率の取引機会を見出します。トレンドを追従する場合でも、極端なデルタ値を使用して反転を予測する場合でも、このツールはあなたの取引スタイルに完全に適応します。ただ取引するだけではなく、 FX Power で賢く取引をしましょう。 1. なぜ FX Power がトレーダーにとって非常に有益なのか 通貨と金のリアルタイム強弱分析 • FX Power は主要通貨と金の相対的な強弱を計算し、マーケットダイナミクスに関する明確な洞察を提供します。 • どの資産がリードしているか、または後れを取っているかを監視して、取引するペアを賢く選びましょう。 マルチタイムフレームの包括的なビュー • 短期、中期、長期のタイムフレームで通貨と金の強弱を追跡し、マーケットトレンドに基づいて取引戦略を調整できます。 • スキャルピングからスイングトレード
M1 SNIPER は使いやすいトレーディングインジケーターシステムです。M1時間足向けに設計された矢印インジケーターです。M1時間足でのスキャルピングのためのスタンドアロンシステムとして、また既存のトレーディングシステムの一部としても使用できます。このトレーディングシステムはM1時間足での取引に特化して設計されていますが、他の時間足でも使用できます。元々、この手法はXAUUSDとBTCUSDの取引用に設計しましたが、他の市場においても役立つと考えています。 インジケーターのシグナルは、トレンドの方向と逆方向に取引できます。インジケーターのシグナルを利用して両方向に取引するのに役立つ特別な取引テクニックをご紹介します。この手法は、特別な動的なサポートとレジスタンスの価格帯を利用することに基づいています。 ご購入後、M1 SNIPER矢印インジケーターをすぐにダウンロードできます。さらに、M1 SNIPERツールのすべてのユーザーに、以下のスクリーンショットに表示されているApollo Dynamic SRインジケーターを無料で提供しています。この2つのインジケーターを組み合わせることで
FiboSniper Pro – Multi-Filter Fibonacci System with Auto SL/TP and Control Panel FiboSniper Proは、動的なFibonacci Envelopesと複数の確認フィルターを組み合わせ、選別されたBuyおよびSellシグナルを生成するテクニカルインジケーターです。FibonacciレベルはMoving AverageとATRを基に計算され、その後ADX、EMA、RSI、ATR、Volume、Time、Candle構造によってフィルタリングされます。インジケーターは、ATRに基づく自動Stop LossおよびTake Profitレベルをチャート上に直接表示し、さらに迅速な調整が可能なインタラクティブControl Panelを提供します。 ご購入後、MQL5で私にメッセージを送っていただくと、Auto Trader Xを無料で受け取れるほか、このインジケーターの取引シグナルを自動化する方法についての説明もご利用いただけます。 User GuideとSet Files: [Click here] 完全
Auto Optimized SpeedAngle は、継続的なウォークフォワード最適化(WFO:Walk-Forward Optimization)によりカーブフィッティング(過剰最適化)を排除した、機関投資家レベルのモメンタムベクトルシステムです。市場レジームの変化時に効果が低下する静的な入力に依存せず、アウトオブサンプル(OOS)検証を用いてパラメーターを動的に再キャリブレーションすることで、表示されるシグナルが単なる過去の偶然ではなく、確実な統計的優位性に基づいていることを保証します。 主な機関投資家向けフレームワーク ウォークフォワード最適化エンジン: ルックバック期間やしきい値の数千に及ぶ組み合わせを継続的にスキャンし、データをインサンプルとアウトオブサンプルに厳格に分離します。未検証のデータ環境において数学的優位性が証明された場合にのみ、新しいパラメーター設定を採用します。 定量的目的関数: 単なる純利益の追求ではなく、機関投資家レベルの安定性指標をターゲットとします。システム品質ナンバー(SQN)、期待値(1トレードあたりの平均Rマルチプル)、またはネットRの最適化を選
Sqn Max Indicator Sqn Max is an exclusive indicator to trade the market with high effectiveness. The indicator is based on price action, volatility and trend. This indicator is as simple as possible but not too simple. The indicator can generate alerts to ease the trading process. You don't have to stay all day in front of your screen. The indicator can be used with any class of assets and with any time frame. It is possible to achieve better results trading our list of selected assets. We achi
Smc Pro ToolKit
Talal N Z Aljarusha
5 (14)
SMC PRO TOOLKIT — SMART MONEY ANALYSIS & STRUCTURED TRADE PLANNING SMC Pro ToolKit is a professional Smart Money Concepts analysis workspace for MetaTrader 5. It combines market structure, multi-timeframe analysis, institutional price zones, setup evaluation, confirmation tools, volume context, alerts, and risk planning inside one organized chart environment. One workspace. Multiple layers of confirmation. One structured trading plan. OPEN COMPLETE USER GUIDE MULTI-CONDITION SETUP ENGINE At
SIO Oscillator:自己最適化型セミバリアンス・インバランス・オシレーター インジケーターをご購入いただくと、それをベースにしたエキスパートアドバイザー(EA)を無料でお受け取りいただけます。 多くのオシレーターは、すべての価格変動を同じように扱います。SIOは上昇圧力と下降圧力を分けて捉え、その間のインバランス(不均衡)を測定することで、買い手と売り手のどちらが本当に相場を支配しているかを示します。インバランスが極値に達すると、SIOはエントリー、ストップロス(Stop Loss)、テイクプロフィット(Take Profit)の水準を伴う明確なシグナルを表示します。 SIOの大きな特長は、固定パラメーターに頼らないことです。内蔵の自己最適化機能が、現在の銘柄と時間足に適したパラメーターを継続的に探索し、使用する前に検証します。 2つのシグナルモード 平均回帰(Mean Reversion):インバランスの極値で取引し、均衡への回帰を狙います。 トレンドフォロー(Trend Following):持続的で優勢なインバランスの方向に取引します。 自動モード:最適化機能が直近のデ
Power Candles V3 - 自己最適化型強弱インジケーター Power Candles V3は 、通貨や銘柄の強さを、適用されたすべてのチャート上で実行可能なトレードプランに変換します。単にローソク足を色分けするだけでなく、バックグラウンドでリアルタイムの自動最適化を実行し、目の前の銘柄に対して最適なストップロス、テイクプロフィット、およびシグナルの閾値を提示します。ワンクリックで実取引に適用でき、エントリーポイント、ストップロス、テイクプロフィットのラインが正確な価格位置にチャート上に表示され、方向性を示すアラートがリアルタイムで発動します。 このツールは、Stein Investmentsのエコシステムの一部です。  18種類以上のツールをすべて閲覧し、AIを活用したセットアップの推奨事項を入手し、  https://stein.investments でコミュニティに参加しましょう クローズしたバーごとに3,000回以上のトレードシミュレーション。9つの強さの状態。2つの戦略を並行してテスト。勝率の高い設定をワンクリックで適用。 なぜこれが必要なのか ほとんどの強
Atomic Analyst — MetaTrader 5 ご購入後、MQL5で私にメッセージをお送りいただくと、Smart Universal Expert Advisorを無料で受け取れるほか、オンライン講座、PDFマニュアル、非公開グループへのアクセスもご利用いただけます。 Atomic Analystは、プライスアクション、トレンドの方向、エントリー・決済シグナル、損切り水準、複数の利確水準をチャート上にまとめて表示します。 シグナルを確認し、取引の状況を理解する Atomic Analystは、分析結果をわかりやすい視覚情報として表示します。 • エントリーの候補を見つけるための買い・売りの矢印。 • 取引計画に役立つ損切り水準と複数の利確水準。 • 市場の方向性を評価するトレンド、強さ、モメンタムの指標。 • より広い市場背景を比較する複数時間足の分析。 • 変化する状況を追うための色分けされたローソク足とアラート。 シグナルと補助分析を併せて確認し、その取引機会がご自身のルールに合うかを判断してください。 短期の取引機会から、より大きな値動きまで Atomic A
Unix Scalper — MetaTrader 5 ご購入後、MQL5で私にメッセージをお送りいただくと、Smart Universal Expert Advisorを無料で受け取れるほか、オンライン講座、PDFマニュアル、非公開グループへのアクセスもご利用いただけます。 セットアップを見つけ、取引プランを確認し、取引方法を選ぶ。 UNIX Scalperは、市場分析、BUY/SELL/WAITの判断、Entry、Stop Loss、TP1、TP2の水準を、見やすいパネルにまとめています。 シグナルと取引プランを確認 • 明確な判断:BUY、SELL、WAIT。 • 明示された水準:Entry、Stop Loss、TP1、TP2。 • 複数時間足の一覧:パネル上で各時間足のシグナルを比較。 • 判断を支える分析:トレンド、モメンタム、出来高、ボラティリティ、サポートとレジスタンス、市場の質。 • 選べるレイアウト:Minimized、Compact、Standard、Full。 シグナルと各水準を確認し、そのセットアップがご自身の取引ルールに合うか判断してください。 ゴール
Tokyo Indicatorは、トレンドの方向性、潜在的な取引シグナル、および市場状況を視覚的に分かりやすく表示します。 色分けされた階段状のトレンドラインにより、強気局面(青色)と弱気局面(マゼンタ色)が明確に区別されます。トレンドの変化に合わせて表示される方向矢印は、売買の好機を強調します。 統合されたダッシュボードには、現在のシグナル、市場のバイアス(傾向)、モメンタム、ボラティリティ、シグナルの品質がひと目で分かるようにまとめられています。これにより、トレーダーはパネルを切り替えることなく、価格変動(プライスアクション)とインジケーターの数値を照らし合わせて分析を行うことができます。 すっきりとしたチャート表示と簡潔な市場概要により、Tokyo Indicatorはトレンド分析や取引判断における体系的なアプローチをサポートします。 あらゆる時間足や銘柄に対応しており、特に金(ゴールド)の取引に適しています。 トレンド スキャナーの強力なサポートを利用して、無料のインジケーターを入手し、プライバシーを守ります。あーみー!     設定 ShowHUD - チャート上のパネ
Astral Structure セットアップを評価し、初期プランを確認。 発売記念価格 - $99. 発売記念期間終了後は $149。 市場構造に基づくセットアップでは、上位の見方が一致しているか、ストップの参照値はどこか、目標はどう定義されるかという複数の疑問が生じます。Astral Structure は、市場構造を判断の軸とする裁量トレーダーのために、これらを一つの画面にまとめます。 対象のセットアップに集中。 最新の適格なセットアップ、その方向、条件の充足状況をまとめて確認できます。 時間足間の一致を確認。 評価中のセットアップを見失わずに、選択した時間足の値を比較できます。 初期プランとのつながりを維持。 各要素を別々に組み合わせることなく、そのセットアップに紐づくストップと目標の参照値を確認できます。 Structure は、最新の条件を満たしたセットアップを一貫した手順で評価するために活用できます。背景と初期の価格プランを同時に確認できます。 セットアップを背景とともに読む 最新の BUY または SELL セットアップ、その Structure Level、選択した
Crystal Heikin Ashi Signals—Professional Trend & Signal Detection Indicator Advanced Heikin Ashi Visualization with Intelligent Signal System for Manual & Automated Trading Final Price: $149 ---------> Price goes up $10 after every 10 sales . Limited slots available — act fast . Overview User Guide PDF Crystal Heikin Ashi Signals is a professional-grade MetaTrader 5 indicator that combines pure Heikin Ashi candle visualization with an advanced momentum-shift detection system. Designed for both m
トレンドキャッチャーインジケーター トレンドキャッチャーインジケーターは、開発者独自の適応型トレンド分析指標を組み合わせることで、市場価格の動きを分析します。短期的なノイズを除去し、根底にあるモメンタムの強さ、ボラティリティの拡大、価格構造の挙動に焦点を当てることで、真の市場方向性を特定します。また、移動平均線、RSI、ボラティリティフィルターなどの平滑化およびトレンドフィルタリング機能を備えたカスタマイズ指標も使用します。 実際の運用状況のモニタリングやその他の製品については、こちらをご覧ください: https://www.mql5.com/en/users/mechanic/seller ご注意ください。私はTelegramでEAや設定を販売していません。詐欺です。すべての設定はブログで無料で公開しています。 重要!ご購入後すぐにご連絡ください。手順とボーナスをお送りします!
マルチ通貨強度・モメンタム・インジケーター MT5 Dynamic Forex28 Navigator は、長年ご愛用いただいている人気インジケーターの進化形であり、5つの力を1つにまとめたものです。 Advanced Currency Strength28 Indicator (700件のレビュー) Advanced Currency IMPULSE with ALERT (530件のレビュー) Currency Strength EXOTICS GOLD Impulse with Alert CS28 Combo Signals (最近のボーナス) 4つのインジケーターを購入してチャートに重ねる必要はありません。すべてが1つの強力なインジケーターに統合されています。28通貨ペアの強度、それらを導く市場のモメンタム、そして両方のアラートを、1つのウィンドウ、1つのチャートで。 上記のプログラムは MQL5 Market で1,200件以上のレビューを獲得し、2016年から MT4 コミュニティで定番となっています。Dynamic Forex28 Navigator MT5 は、実証済
作者のその他のプロダクト
Fibonacci Ribbon and Levels brings the usual Fibonacci tools together on one chart and draws them automatically. EMA ribbon - Up to seven EMAs whose periods are Fibonacci numbers, starting from a chosen index (5-8-13-21-34-55-89 by default). - Choice of applied price. Automatic Fibonacci levels - The latest swing is the highest high and lowest low within a lookback (120 closed candles by default). The leg direction comes from which extreme came first. - Retracement levels 0, 23.6, 38.2, 50, 61.8
FREE
Candlestick Patterns Context labels well-known candle patterns. It also lets you hide the small or out-of-context ones that make most pattern tools noisy. Patterns (each can be switched on or off) - Bullish and bearish engulfing - Hammer and shooting star - Bullish and bearish harami - Piercing line and dark cloud cover - Morning star and evening star - Three white soldiers and three black crows (off by default) - Doji (off by default; labelled with no direction) Filters - Minimum size: the sign
FREE
Session Range and ADR Monitor shows how far price has moved in each trading session and how that compares with what is normal for that session on the symbol you are watching. Many session indicators only shade the session hours. This indicator also measures each session. Every box is labelled with its range in points and a ratio to the average range of the same session over the previous 20 sessions. For example, "London 820 (64%)" means the London session has covered 820 points, which is 64% of
FREE
Chart Time Assistant puts three small time helpers in one light indicator. Candle countdown - Time left in the current candle. The format adapts to the timeframe: mm:ss below one hour, h:mm:ss up to a day, and days plus hh:mm on D1, W1 and MN1. - Uses the trade server time, so the countdown keeps moving in quiet markets when no ticks arrive. - Shown in a chosen chart corner, or next to the current price. - Turns a warning colour in the last 10% of the candle. - Optionally shows the current sprea
FREE
SMC Structure and Imbalance Map draws the main Smart Money Concepts elements on your chart from fixed, visible rules, so you can read structure quickly and check exactly why each mark is there. What it shows Swing highs and lows labelled HH, HL, LH and LL. Break of Structure (BOS, dashed line) and Change of Character (CHoCH, solid line) when a candle closes beyond the last swing. Order blocks: for each break, the opposite-colour candle at the origin of the move that broke structure. Fair value g
Killzones and Liquidity Sweeps shows the time windows and price levels that ICT-style traders watch, and marks when price trades through one of those levels and closes back on the other side. What it shows Killzone boxes for Asia (20:00-00:00), London (02:00-05:00), New York AM (07:00-10:00) and optionally London Close (10:00-12:00). Times are in New York local time and can be changed. Previous day high and low (PDH, PDL), previous week high and low (PWH, PWL), and the high and low of the Asia k
Support and Resistance Zones with Touch Count finds price areas where the market has turned more than once and shows how many times each one has been touched. What it shows Zones built from confirmed swing highs and lows. Each new swing either starts a zone or is merged into an existing one nearby. A touch count on each zone (for example "R 4x"): the number of swings that formed inside it. The nearest zones above price (resistance) and below price (support), up to the number you choose, plus any
Session and ADR Scanner shows, for a list of symbols, how far each one has moved today and in each session compared with what is normal for that symbol. What it shows One row per symbol, from Market Watch or your own list (default: the seven forex majors and XAUUSD). ADR: the average daily range over the days you choose (default 14), in pips, points or price. Used: today's range as a percentage of ADR. Daily change in percent. Tokyo, London and New York columns: the latest session range as a per
SMC Entry Models and Liquidity shows where common smart-money setups appear on the chart. It also shows the liquidity they usually target. Our SMC Structure Map shows the whole structure map. This tool shows only the moments a setup completes. Entry models - MSS (market structure shift): the first close beyond the last confirmed swing against the current trend. - Liquidity sweep + break: a wick through a swing high or low that closes back, followed by a structure break in the other direction wit
A structure break on its own is often followed by a pullback. An EMA crossover on its own fires often in ranges. This indicator marks only the candles where both line up within a window you set. Signal sources (choose one or all) - BOS: a close beyond the last confirmed swing in the direction of the current structure. - CHoCH: the first close beyond a swing against the current structure. - Equal highs / lows: two swing highs (or lows) within a tolerance of ATR, with no trading through the level
Session Opening Range measures the first part of each session and follows what price does with it for the rest of the session. What it shows - A box over the opening range of up to three sessions, with high, low and optional midline extended for the session. - The first breakout candle: close or wick beyond the range, with an optional buffer. - T1 and T2 target lines at 1x and 2x the range size (adjustable), and markers when they are reached. - A failed-breakout marker when price closes back thr
Many FVG tools mark every three-candle gap, including the tiny ones that appear in quiet markets. This indicator starts from the candle that caused the gap. A gap is only kept when the middle candle was a real displacement candle: a large body compared with its range, and a range several times ATR. What it shows - Displacement candles outlined, with the ATR multiple printed ("2.1x"). - Bullish and bearish fair value gaps anchored on those candles: a box, an edge line on each side and a dotted 50
A doji in the middle of nowhere means little. This indicator mainly asks where the candle is, then what price did next. Candle types - Doji (body up to 5% of the range), long-legged doji, and spinning top (optional). - Dragonfly and gravestone dojis (optional). In range mode, a dragonfly counts only at the range low and a gravestone only at the range high. - Minimum candle size as a multiple of ATR, so tiny candles in quiet hours are ignored. Location filter (can be switched off) - The range is
フィルタ:
レビューなし
レビューに返信