SR Zones Sync
- インディケータ
- バージョン: 1.0
- アクティベーション: 5

SR Zones Sync: Support & Resistance Zones with Break-on-Close Logic
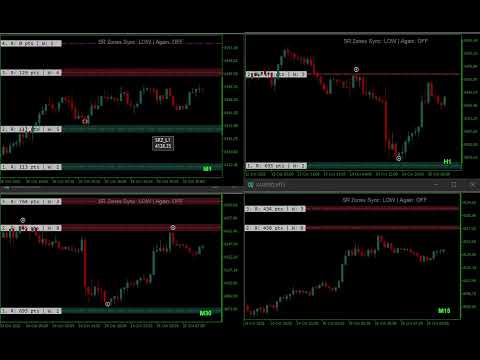
SR Zones Sync automatically draws support and resistance zones from swing pivots, then recolours them when price actually breaks through. Only a fully closed candle can break a zone, so wicks and the still-forming candle never trigger a false signal.
How it works
- Zones are built by clustering swing highs and lows into price areas. Each zone’s thickness adapts to the average candle range.
- Each zone gets a role from its latest pivot: pivot high = resistance (red), pivot low = support (teal).
- Resistance is broken when a candle closes above the zone. Support is broken when a candle closes below it.
- Broken zones change colour and stop at the break bar. You can hide them completely.
- Optional “show again” mode: if price closes back on the original side (a fake-out), the zone returns to normal.
Key features
- Break-on-close detection. Wick tests do nothing.
- Three sensitivity levels (LOW / MED / HIGH) to match your swing size.
- Touch points on each zone, plus a gold early-touch marker when a candle has touched a zone but the pivot is not yet confirmed.
- Zone labels showing zone height in points and number of touches (W).
- Smart filtering:
- maximum number of zones
- prefer the most recent zones
- show only the N nearest zones above and below price
- minimum touches
- minimum gap between zones
- auto-hide zones price hasn’t touched for N bars
- Fully customisable colours, opacity, arrows and labels.
Hotkeys and multi-chart sync
- H: show/hide zones
- B: cycle sensitivity LOW > MED > HIGH
- N: toggle “broken zone shows again”
- Changes sync instantly to every chart in the same group (same symbol, plus optional aliases like XAUUSD.h, and timeframes you choose, e.g. M5,M15,H1). Ideal for multi-timeframe analysis.
Usage tips
- Attach one instance per chart.
- Start with MED sensitivity, then press B to adapt to the market.
- To compare timeframes, open several charts of the same symbol and the hotkeys will control them all together.
Main inputs
| Group | Examples |
|---|---|
| Zones | BarsCalc, Sensitivity, MaxZones, MinTouches, WidthScale, NearestPerSide |
| Display | Zone colours, opacity, touch points, labels |
| Broken zones | Show broken zones, colours, revive on reclaim |
| Hotkeys and sync | Hotkeys, sync timeframes, symbol aliases |
Works on all symbols and timeframes. This is an analysis tool, not a trading signal and not financial advice.