Trend Pulse Multi Timeframe
- インディケータ
-
Jorge Eliecer Valencia Ferreira
 🤖 Quantitative Developer & Algorithmic Trading Specialist | MQL5 & Python
Welcome to my official MQL5 profile. I am a Quantitative Developer and Algorithmic Trader focused on creating high-quality, institutionally robust Expert Advisors with strict risk management. - バージョン: 1.20
- アクティベーション: 5
**What it does**
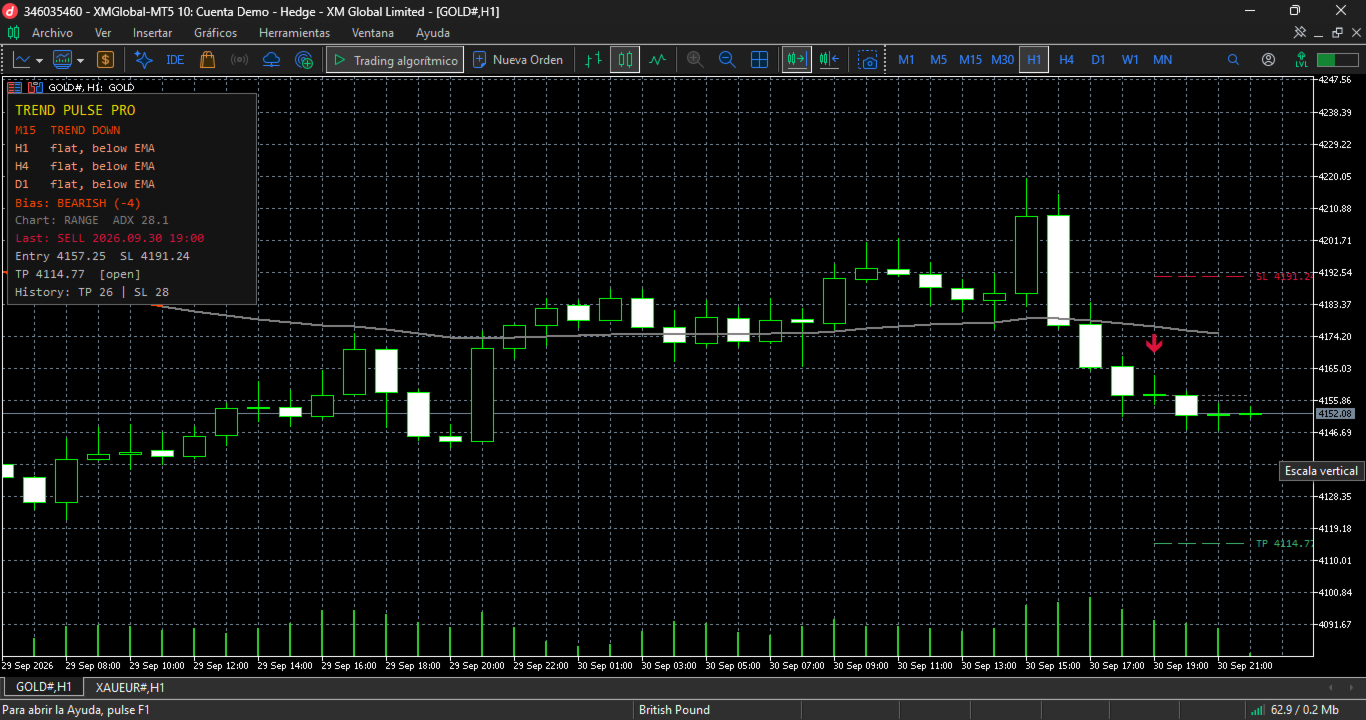
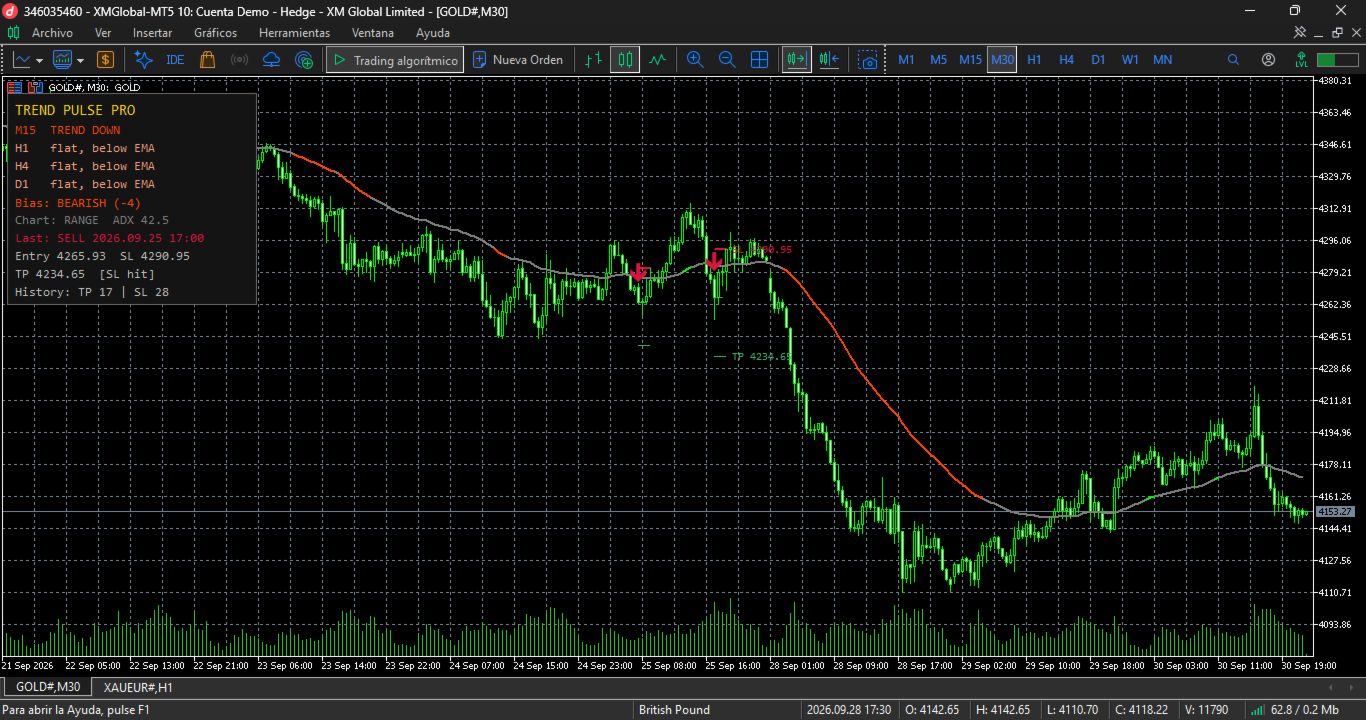
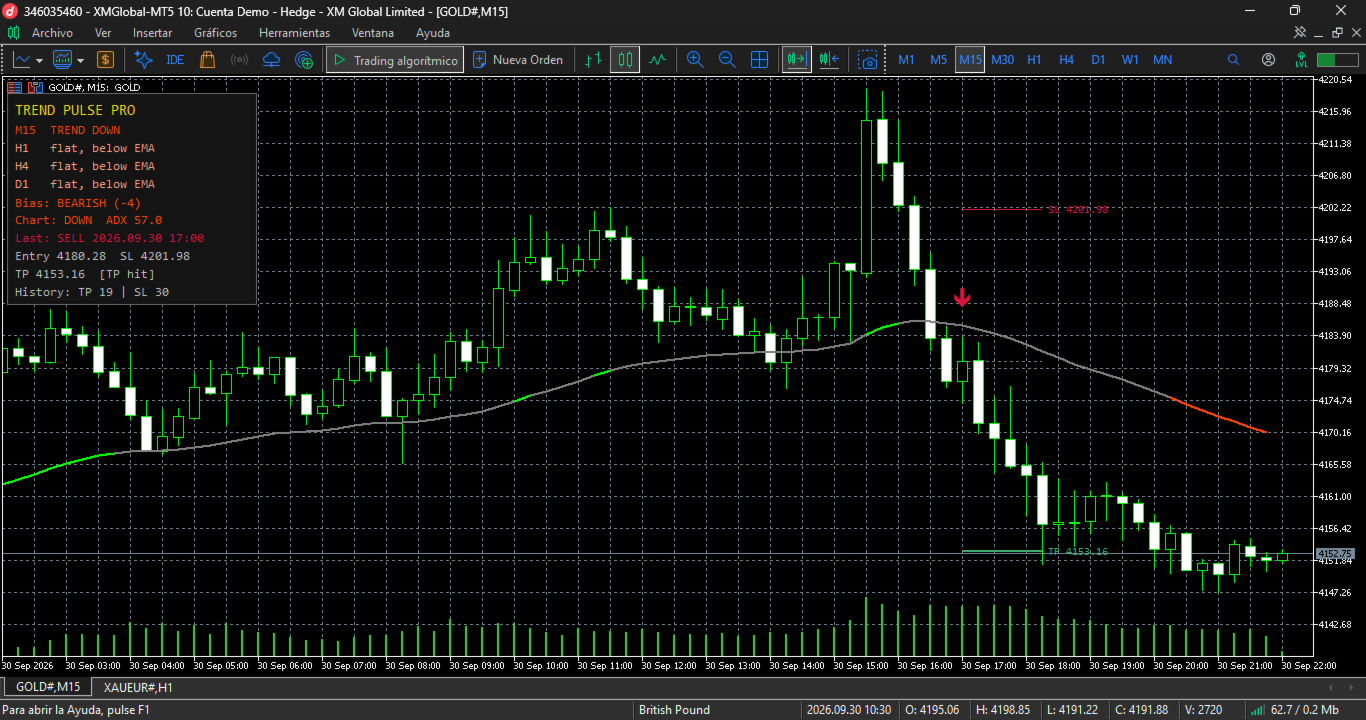
Trend Pulse Pro colors a 50 EMA according to the market state: green in an uptrend, red in a downtrend, and gray in a range. To decide which is which, it combines two things: trend strength (ADX) and the moving average's slope divided by the ATR. Dividing by the ATR ensures the same threshold works on gold, a forex pair, or an index, without readjusting it every time volatility changes.
Along this line, the indicator prints buy and sell arrows based on a 9/21 EMA crossover. Most crossover arrows appear at any time, even in sideways markets. Here, an arrow is only drawn if two conditions are met simultaneously:
1. On the chart, the ADX is above the minimum, and the 50 EMA is pointing in the direction of the crossover.
2. In net terms, at least 2 of the 4 timeframes on the panel closed their last candle on the correct side of their 50 EMA (above for a buy, below for a sell).
There is no requirement that the line must already be green or red on the crossover candle. The 9/21 crossover often happens at the end of a pullback, right when the 50 EMA flattens out, and requiring this would leave almost no arrows.
If the market is ranging, or the timeframes do not agree, there is no arrow. Both conditions can be turned off separately.
**Stop loss and take profit via ATR**
Each arrow comes with three lines: the entry (close of the signal candle), the stop loss, and the take profit. The distances are derived from the ATR of that same candle: by default 2×ATR for the stop and 3×ATR for the target. With high volatility, the levels widen; with low volatility, they narrow, without touching any parameters.
- While the trade remains open, the lines are dashed and extend with each new candle.
- When the price touches either level, the line stops at that candle, and the one that was hit becomes thicker. The chart clearly shows how each signal ended.
- If both levels are hit within the same candle, it counts as a stop loss. With closed candles, it's impossible to know which was hit first, so the worst-case scenario is assumed.
- The last signal displays the exact SL and TP price next to its lines.
The levels are calculated once, at the close of the signal candle, and do not move. It is not a trailing stop.
**Panel**
Shows the state of four timeframes (M15, H1, H4, and D1 by default, all four configurable): "TREND UP/DOWN" if there is a strong trend, and "flat, above/below EMA" if there isn't, indicating which side of the moving average the price is on. Below, it shows the net bias from -4 to +4 and the current chart's regime with its ADX. Below that, the last arrow with its entry, SL, TP, and status (open, TP, or SL), along with a count of how many signals from the loaded history hit TP and how many hit SL. This count comes from the same chart you are looking at, so you can verify it candle by candle. It does not include spread or commissions.
**No repainting**
- Everything is calculated on closed candles. The forming candle never has a line or arrow.
- Higher timeframes are read at their last closed candle at the exact moment the chart's candle closed. An H1 arrow in the history uses the H4 state known at that time, not the one known hours later.
- An arrow that appears does not move or disappear. What you see in the history is exactly what you would have seen live.
**Alerts**
- Pop-up alert when a new arrow appears, showing entry price, SL, and TP (enabled by default).
- Pop-up alert when the chart's trend changes direction (disabled by default).
- Push notification to mobile as an extra option (disabled by default).
Each alert is sent only once per closed candle.
**Parameters**
Trend regime
- `Baseline EMA period` (50): moving average to be colored.
- `Slope lookback (bars)` (3): candles used to measure the slope.
- `ATR period` (14): ATR to normalize the slope.
- `Min |slope|/ATR to call a trend` (0.10): minimum slope to consider a trend.
- `ADX period` (14) and `Min ADX to call a trend` (22).
Entry arrows
- `Fast EMA period` (9) and `Slow EMA period` (21): the crossover that generates the arrow.
- `Arrow only if ADX >= min and baseline slopes with it` (true).
- `Arrow only if MTF bias agrees` (true).
- `Min net TFs closing on the arrow side of the EMA` (2): from 1 to 4. With 3 or 4, fewer arrows appear.
Stop-loss / take-profit (ATR)
- `Draw SL/TP lines for arrows` (true).
- `Stop-loss distance (x ATR)` (2.0) and `Take-profit distance (x ATR)` (3.0).
- `Draw SL/TP for the last N arrows` (10): how many recent signals display their lines. The panel count uses all of them.
- `Stop-loss line color` and `Take-profit line color`.
Multi-timeframe
- `Timeframe 1` to `Timeframe 4`: the panel and filter timeframes.
Alerts and display
- `Pop-up alert on new arrow`, `Pop-up alert on trend flip`, `Also send push notifications`.
- `Show panel` and `Bars to process` (5000).
**Suggested use**
It works on any symbol and timeframe. On M15–H1, the four default timeframes provide a reasonable context. On H4 or D1, you should increase them (e.g., H1, H4, D1, and W1) so the panel looks up and not down.
**What it does not do**
- It does not open trades. It is an indicator: it draws, shows the panel, and alerts. The SL and TP are reference levels that you must set yourself in the order.
- It does not move the stop (no trailing or breakeven).
- The TP/SL count on the panel is not a backtest: it does not account for spread, commissions, or slippage.
- It makes no promises of returns. A filtered moving average crossover is still a moving average crossover: it gives fewer signals in ranges, but it isn't always right. Use it for trend reading and confirmation, with your own risk management.
**Free version**
Trend Pulse Lite has the same regime line on the chart's timeframe, with an arrow every time the trend changes direction. It does not have the multi-timeframe panel, entry filter, or SL/TP. Use it to test the regime reading before deciding.