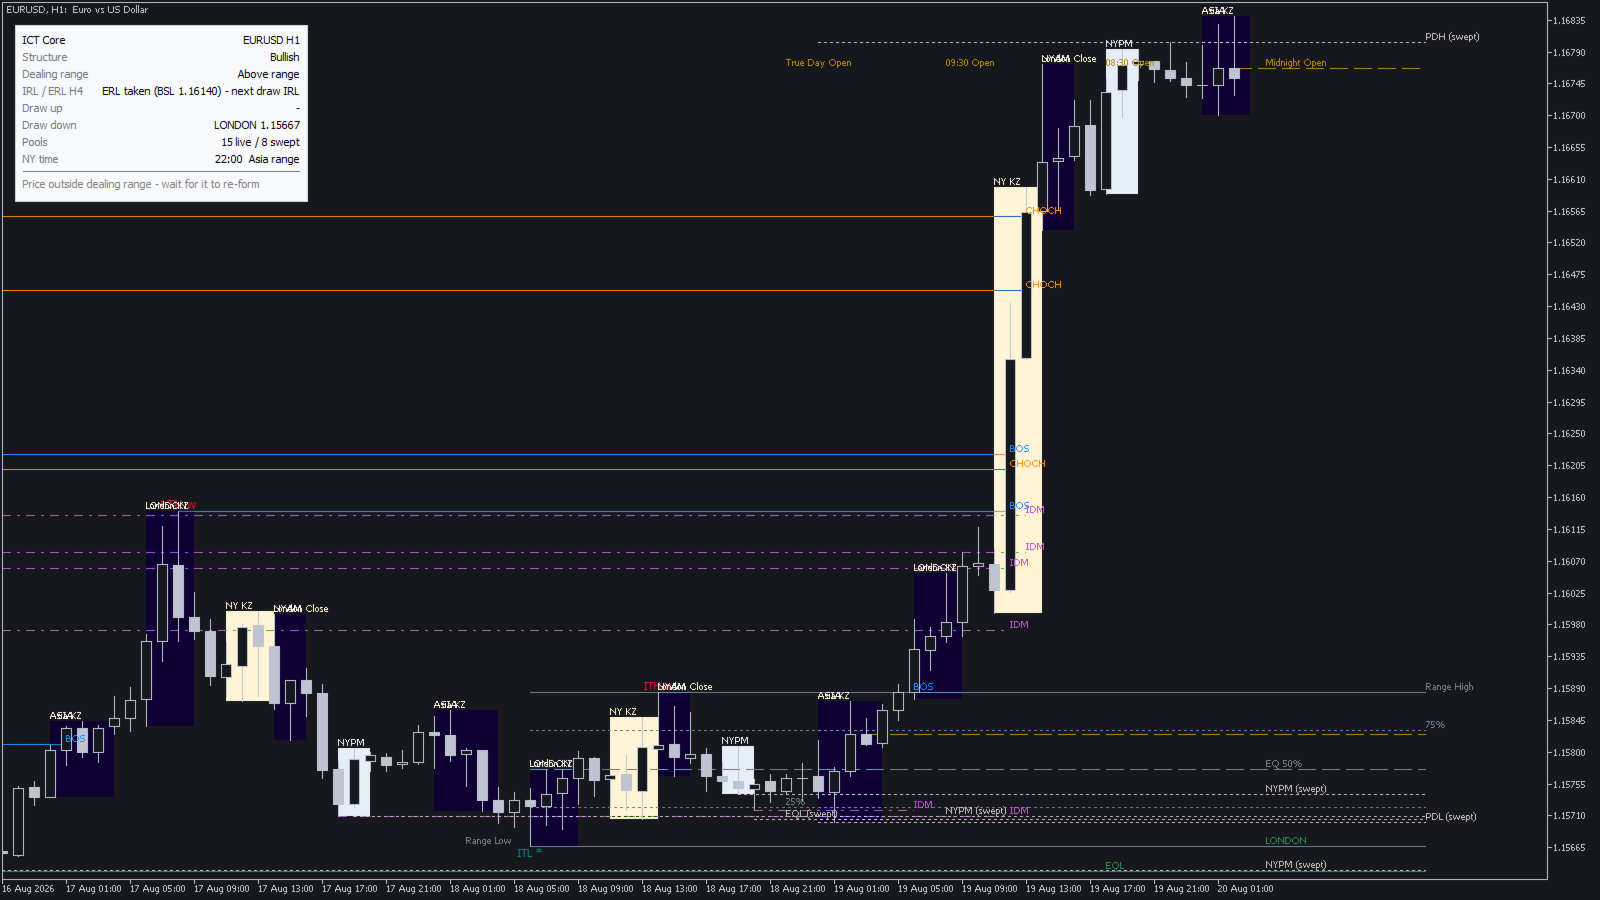
ICT Core
- インディケータ
- バージョン: 1.0
- アクティベーション: 20

I read through about 900 pages of ICT and SMC material before I wrote a line of this. Not because I enjoy reading. Because I wanted to know exactly where the popular shortcut versions drift away from what the concept actually says, and then build the version that doesn't drift.
Here's what I found.
Where the shortcut version goes wrong
| What the material says | The shortcut that got popular | What ICT Core does |
|---|---|---|
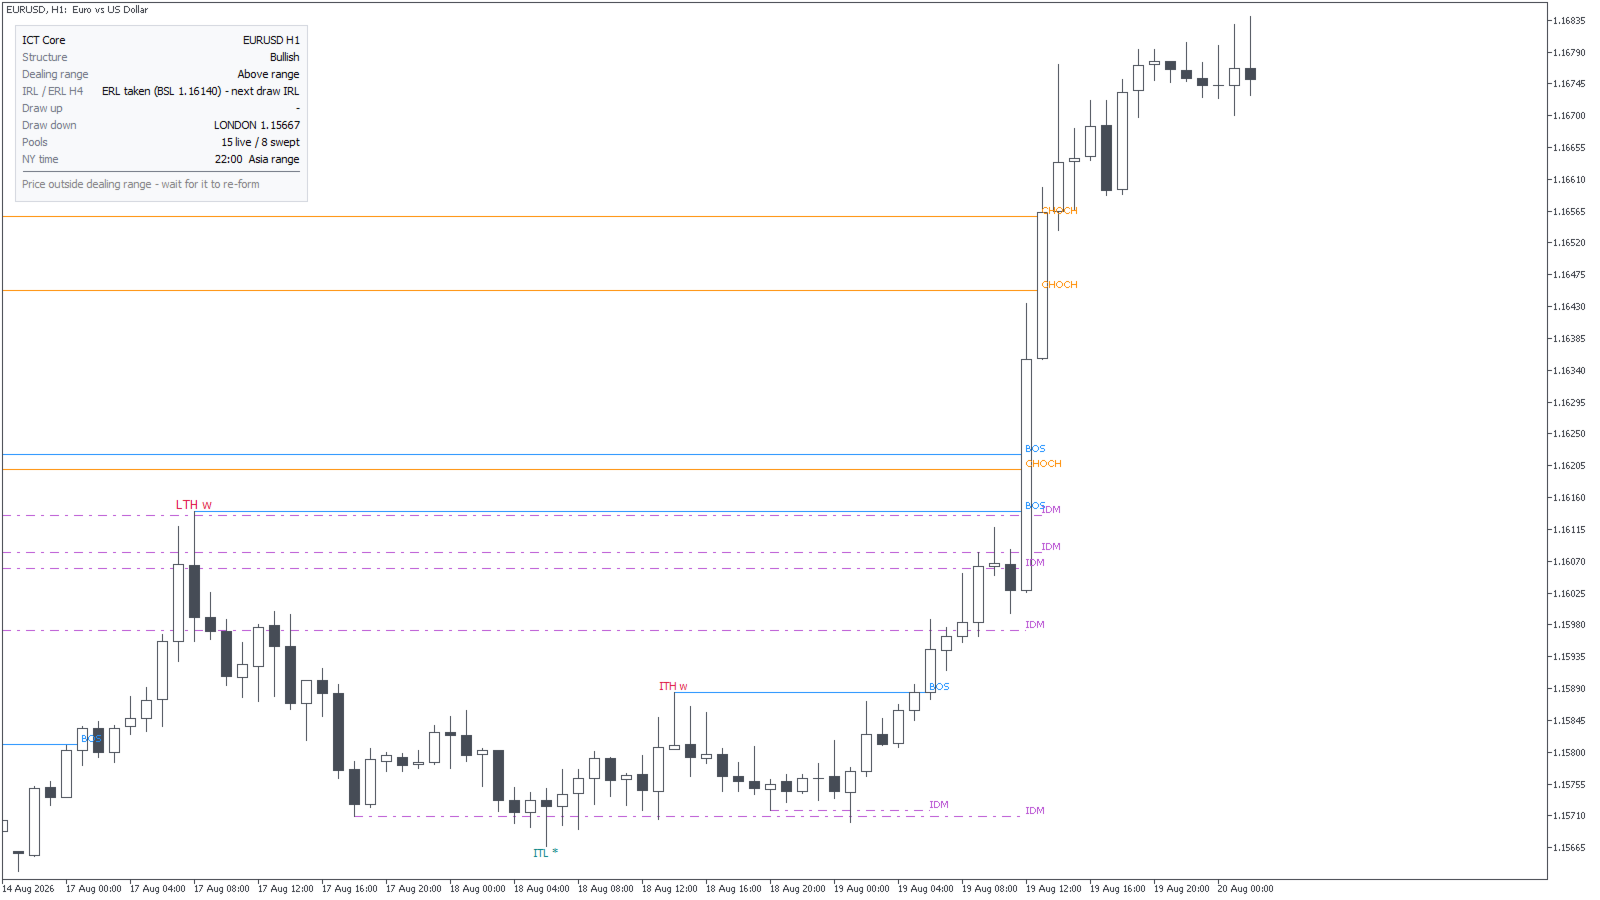
| Only a break of an intermediate or long term point is a structure break | Every broken high gets labelled "BOS" | Grades every swing ST / IT / LT, labels only IT and above |
| A break needs a body close. A wick through and back is a sweep, which means the opposite thing | Wick and close treated identically | Two separate objects, drawn differently |
| Price alternates between the liquidity inside a range and the liquidity at its edges | Levels and gaps drawn everywhere, with no sense of which one is next | One line naming which was taken last, so you know what's next |
| A level with a body close through it is spent | Levels stay on the chart forever | Dead pools get deleted |
| Killzones are New York hours, and New York changes its clocks twice a year | One fixed offset | DST worked out per bar |
| Nothing may be read off the bar that hasn't closed | Levels that move after you've traded them | Closed bars only, no exceptions |
That top row is the one that costs money. If a broken short-term high looks the same as a broken intermediate high, you'll spend your week trading internal noise and wondering why structure keeps lying to you.
And the second row is worse, because a wick through a level and a close through it point in opposite directions. One is your entry trigger. The other kills the setup. A tool that draws them the same way isn't simplifying, it's hiding the signal.
What it draws
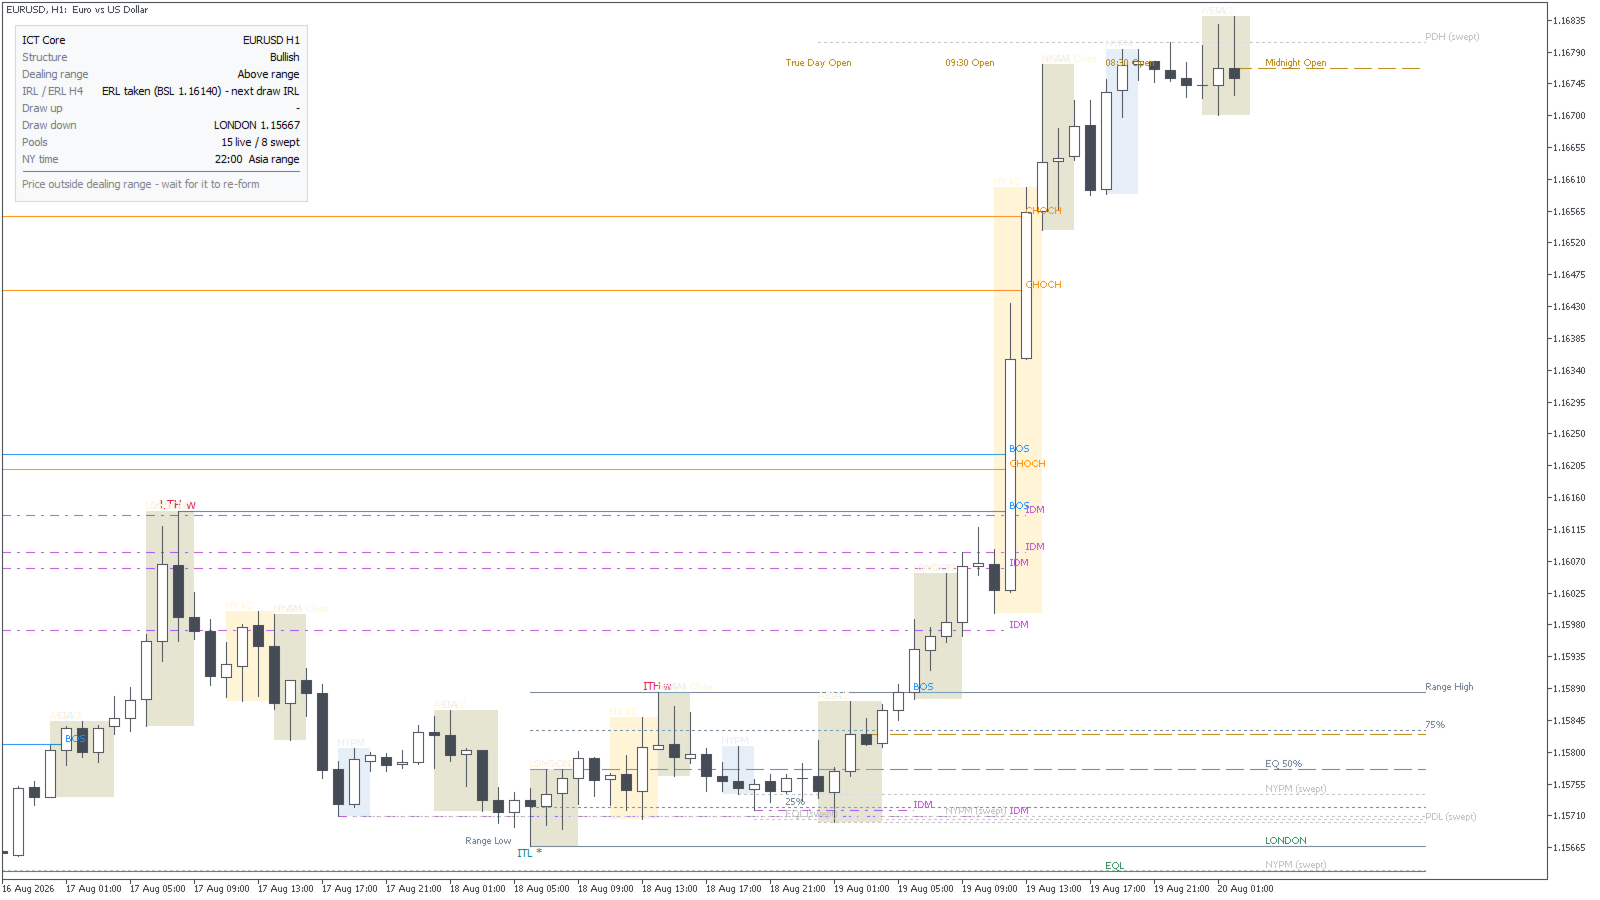
Structure. Three tiers. A short-term high with lower short-term highs on both sides becomes intermediate; an intermediate high with lower intermediates on both sides becomes long term. Only intermediate and above produce a BOS or CHOCH label. Wick-only breaks get their own grey dotted line, tagged with the point they swept. Each swing is marked strong ( * ) or weak ( w ), because weak points are what price reaches for and strong ones defend. The inducement gets drawn too.
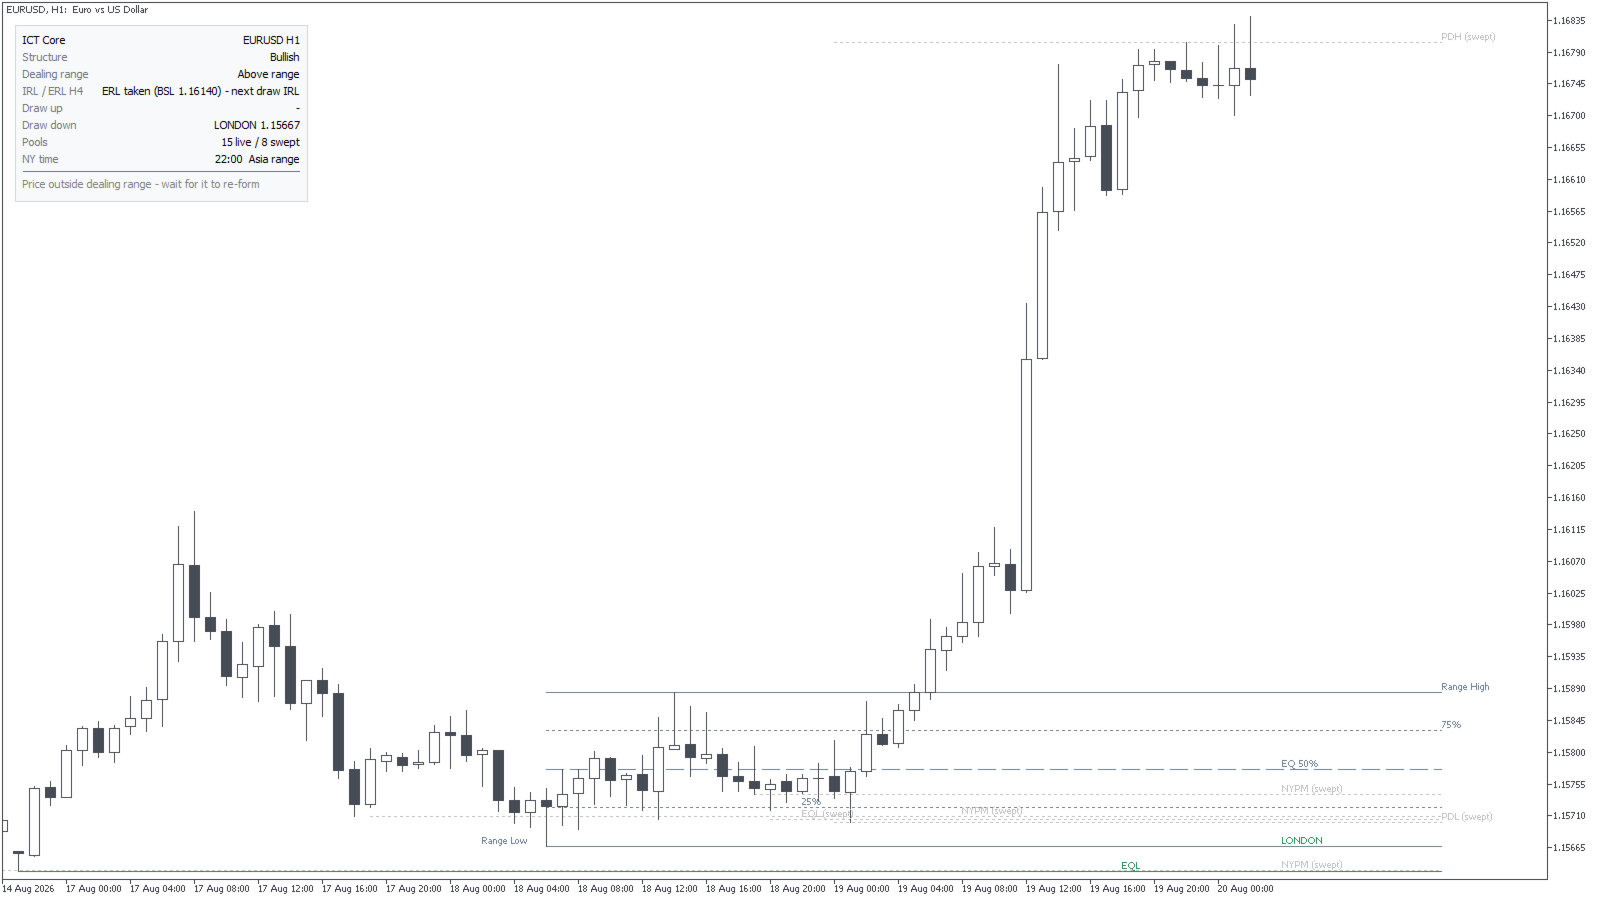
Liquidity. Previous day, week and month highs and lows, pulled off D1, W1 and MN1 so they're exact. Plus the four session ranges and equal highs and lows. Three states: live, swept, dead. Dead ones disappear. Same price from two sources keeps the stronger label, so a weekly high never hides under a daily one. Levels that land within a fraction of an ATR of each other step their labels sideways instead of printing on top of one another.
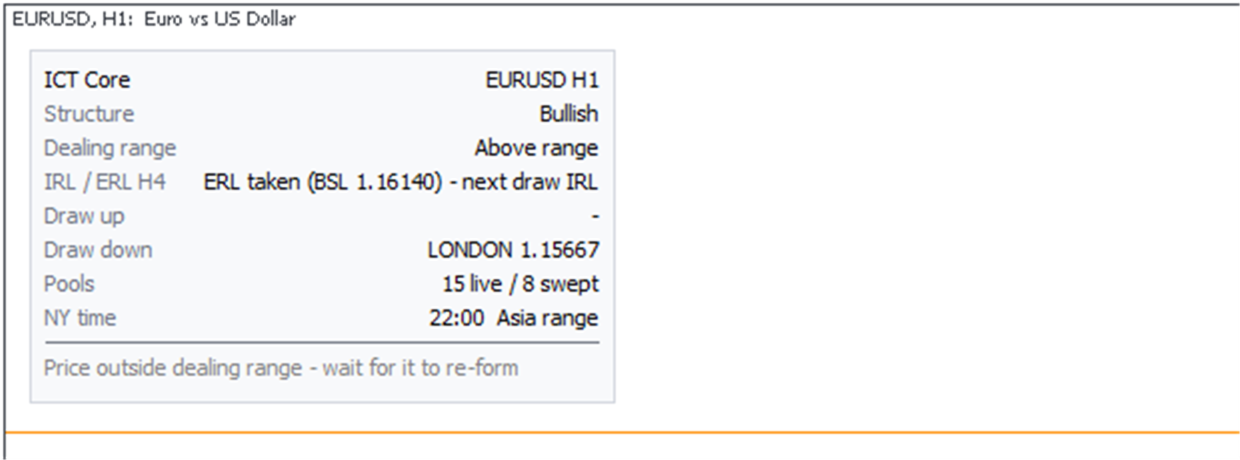
Internal and external liquidity. The material is blunt that price alternates: it reaches for the imbalance sitting inside a range, then the buy or sell side parked at the edge, then back again. So the panel carries a line naming which of the two price delivered to last, and therefore which one is next. It reads that off H4 by default, because on a 15-minute chart the range redraws every few bars and the alternation stops meaning anything. If the higher timeframe hasn't formed a usable range, the line is left out rather than guessed at.
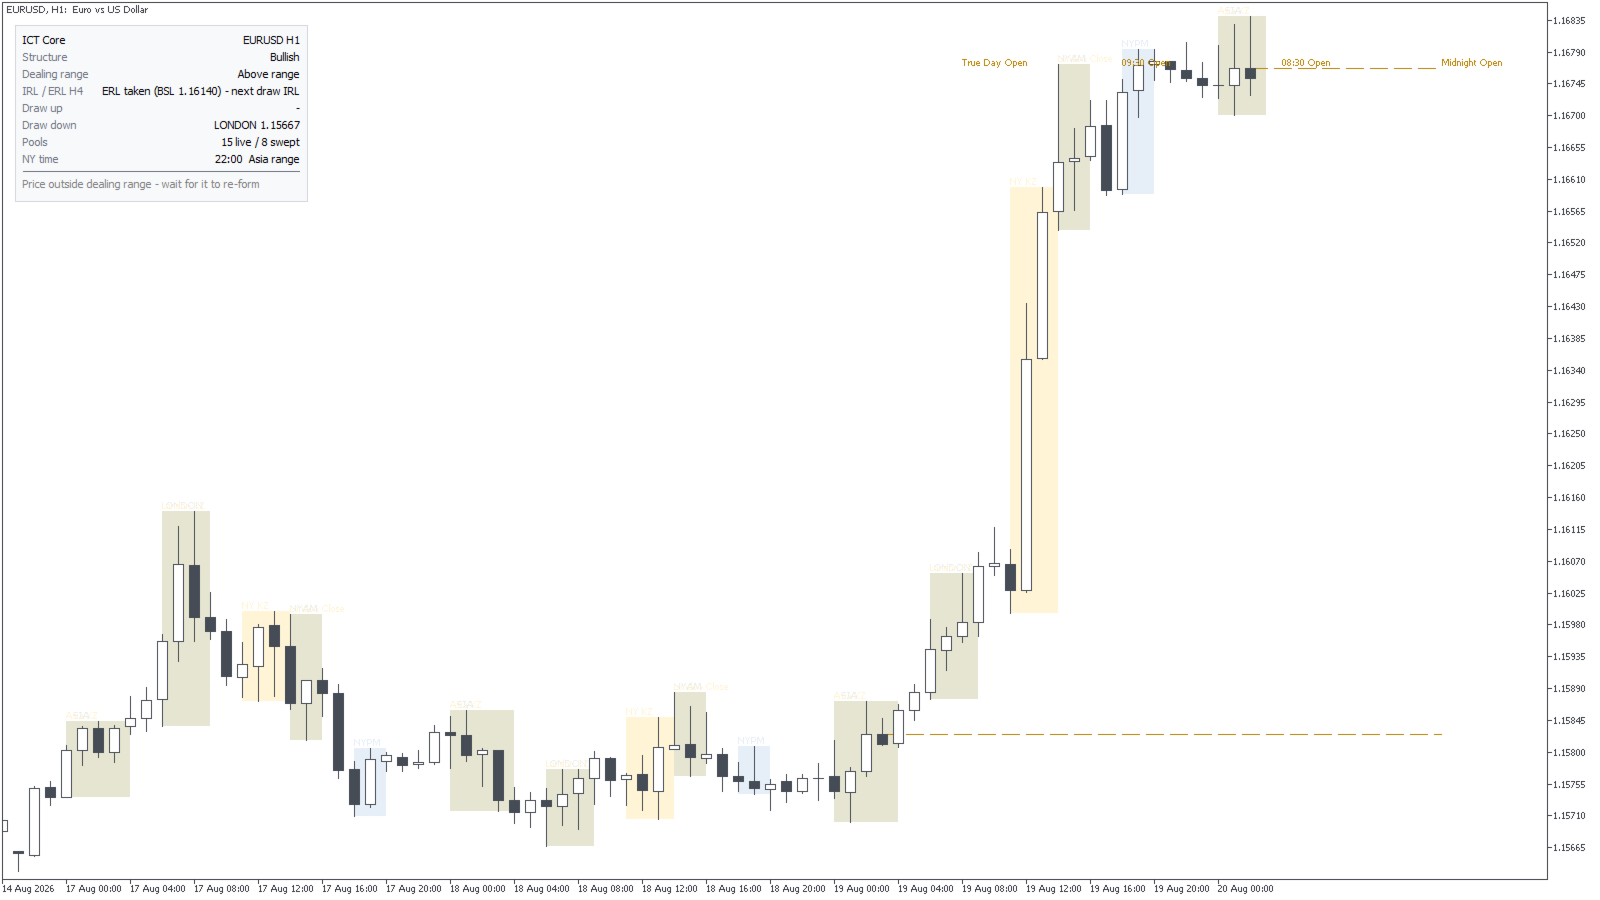
Time. Sessions, killzones, silver bullet windows, the eight 20-minute macros, and four opening prices including the 18:00 true day open. All in New York time with daylight saving handled.
Dealing range with equilibrium and the 25% / 75% quadrants.
The panel, and the plan line
ICT Core EURUSD H1 Structure Bullish Dealing range Discount 35% IRL / ERL H4 ERL taken (BSL 1.15630) - next draw IRL Draw up NYAM 1.15994 Draw down EQL 1.15631 Pools 12 live / 7 swept NY time 19:00 Outside killzone ───────────────────────────────────────────────── Bullish, in discount - wait for EQL sweep @ 1.15631
The bottom line is a state readout, not a signal. It never says buy now. It names the condition that's still missing, in order: bias, then location in the range, then the liquidity grab, then the clock.
So you'll see it move through wait for discount below 1.15692 , then wait for EQL sweep @ 1.15631 , then swept - valid, but outside killzone , and only then does it turn green. Only that last state gets colour. Colour everything and you stop noticing any of it.
Three alerts, at most one per bar: a pool getting swept, a structure break, and a killzone opening. The break alert fires on the open of the bar after the close that confirmed it, because a break isn't a break until a body has closed through it.
How to trade with it
| On the chart | Read it as |
|---|---|
| ITH / ITL tag | Real structure. A break here counts |
| * / w after a tag | Strong point holds. Weak point is a target |
| Blue BOS / orange CHOCH | Body close, with trend / against it |
| Grey dotted "ITH swept" | Wick only. Not a break |
| Dash-dot IDM | Has to be taken before the break means anything |
Long: bullish structure, price in discount, a pool below flips to swept, you're inside a killzone, plan line turns green. Then drop to your execution chart, take your own confirmation, and target the Draw up level. Short is the same thing inverted.
Skip it when: structure reads Unclear, price is sitting on equilibrium, both draw levels are already swept, or there's a weak level parked in front of your target. That last one will get taken and your runner won't survive it.
What this version can't do
The plan line always ends in "on confirmation". That's not hedging, it's the honest limit: the indicator knows your bias, your position in the range, which pool just went, and what time it is. It can't see the market structure shift or the fair value gap on your 1-minute chart. Saying BUY without that qualifier would be selling you something it doesn't measure.
Order blocks aren't in this version. Deliberately. The real definition needs a candle that both took liquidity and left an imbalance, and then you still have to pick which of the blocks matters, because the material is blunt that only two per leg do and the rest are traps. Getting that right is a bigger job than everything above put together, so it's in Pro rather than half-done here.
Price sometimes trades clean out of the dealing range before the swing that would replace it has been confirmed. When that happens the panel says Below range and the plan line asks you to wait for the range to re-form. It won't invent a discount percentage for a range price has already left. That's the correct answer, but it does mean there are stretches where the panel tells you nothing actionable.
Equal high and low detection uses an ATR tolerance, so it won't always match what your eye would pick. Tighten it if the pairs look wrong to you.
And it makes no claim about profitability. It's an analysis tool: it shows you where the levels are and what state they're in, and the trading decision stays yours. You won't find a win rate table in this listing, and I'd treat any indicator listing that has one with some care.
Honestly, the part that ate the most time wasn't the structure engine. The swing array runs oldest to newest and I read it backwards in four separate places before I caught it. Compiled clean the whole time, which is the annoying bit.
Questions you'll have
M1? You can, but I wouldn't. Below M5 the intermediate points churn too fast to give you a bias.
Gold and indices? Yes. Structure and liquidity are symbol-agnostic, and index traders get more from the killzone shading than an Asian-pair scalper will.
Higher timeframe levels on a lower chart? Daily, weekly and monthly pools, yes, and the internal/external liquidity line reads off H4 or D1. Higher timeframe order blocks are Pro.
Core or Pro? Pro is a superset: all of this, plus a scored order block and fair value gap engine that picks the two zones per leg the material says are worth trading. If you already choose your own zones off the structure and the sweep, Core is the whole tool and Pro won't change how you trade. If you'd rather have that choice made and scored for you, skip this and go straight to Pro.
MT4? There's a build for it. Same engine, same inputs, listed separately because MetaQuotes keeps the two platforms apart.
Support
Message me on MQL5 with a screenshot showing the panel, plus symbol and timeframe. That's normally enough for me to find it. Updates are free.
Analysis tool. It places no trades and makes no profitability claim. Past price behaviour is not a guide to future price behaviour.