Donchain Trend
- インディケータ
- バージョン: 1.0
- アクティベーション: 12

Definition and theoretical foundation
Donchain Trend Ribbon is a market-structure and breakout-regime indicator based on the Donchian channel methodology. “Donchain Trend Ribbon” is the product name, while the underlying technical method is the Donchian channel.
A traditional Donchian channel is formed from the highest high and lowest low over a selected lookback period:
Upper Donchian Boundary = Highest high recorded over the previous N candles.
Lower Donchian Boundary = Lowest low recorded over the previous N candles.
A close above the previous upper boundary identifies an upward breakout, while a close below the previous lower boundary identifies a downward breakout. The Donchian method was developed for systematic trend and breakout analysis and has historically been associated particularly strongly with commodity and futures trading.
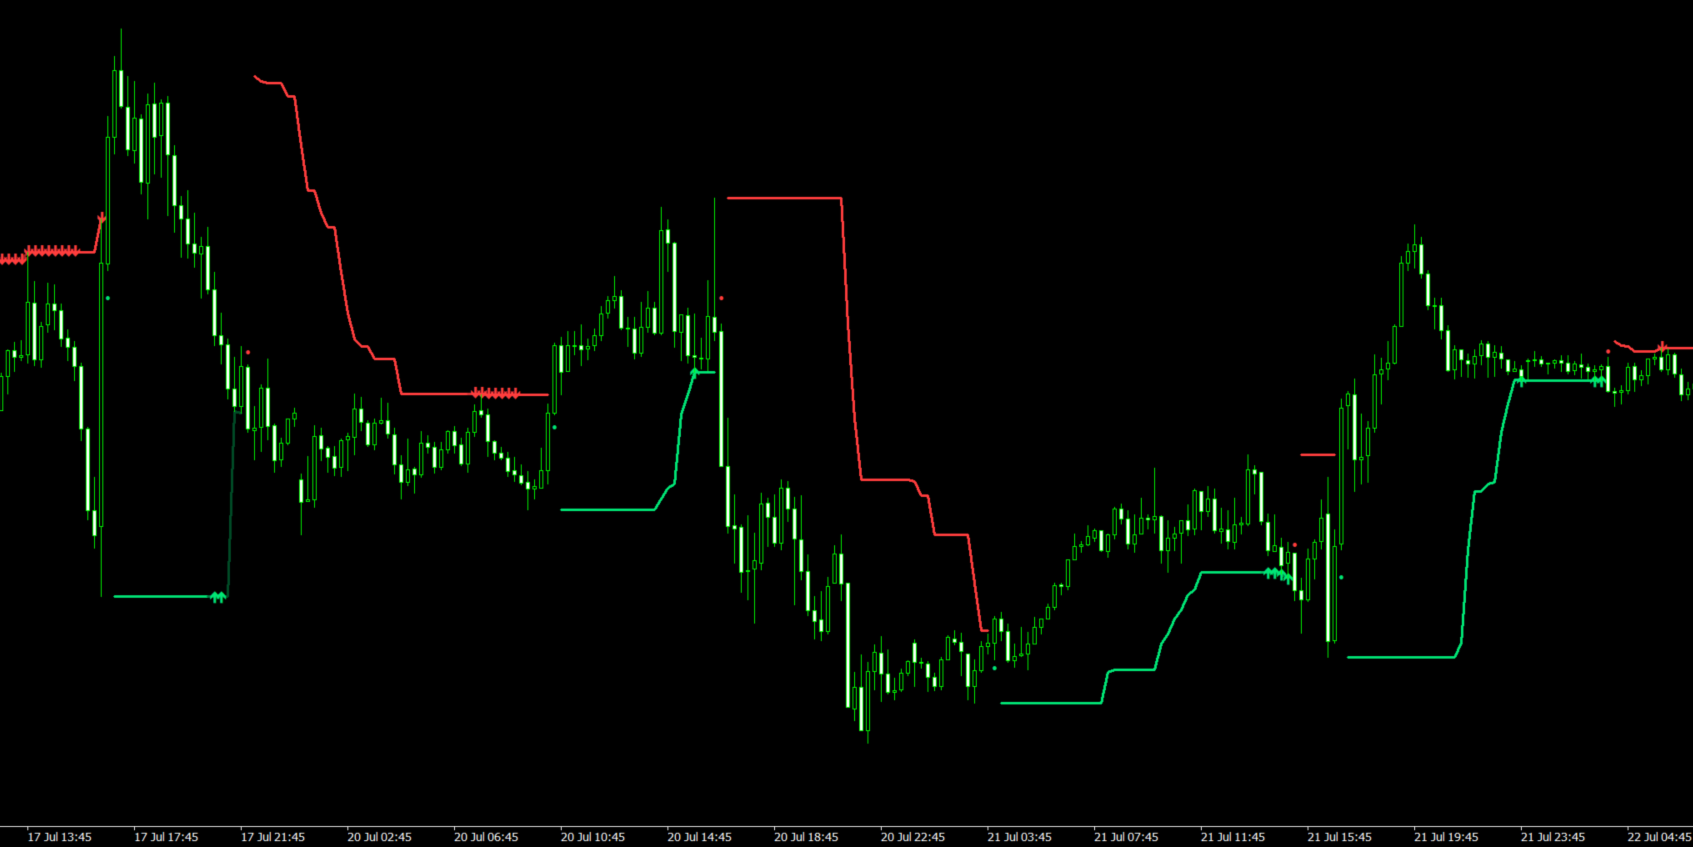
Unlike a conventional channel, this indicator displays only the boundary relevant to the active regime. The design converts market structure into an immediate red-or-green trend surface rather than filling the chart with both channel boundaries.
Indicator description
Donchain Trend Ribbon identifies a bullish regime when the closing price breaks above the preceding Donchian high. It identifies a bearish regime when the closing price breaks below the preceding Donchian low. When price remains between the two breakout boundaries, the most recently confirmed regime continues.
During a bullish regime, the indicator displays the lower Donchian boundary as a stepped green support line. During a bearish regime, it displays the upper Donchian boundary as a stepped red resistance line.
This produces a compact structural overlay that communicates three related elements:
- The direction of the active breakout regime.
- The structural boundary that would challenge that regime.
- The degree of agreement across several related Donchian periods.
Main features
Persistent breakout regime
The default 20-period channel determines the principal direction:
- Close above the previous upper boundary: bullish
- Close below the previous lower boundary: bearish
- No breakout: retain the previous regime
This persistence prevents the trend state from becoming neutral merely because price pauses after a breakout.
Active-boundary display
The indicator does not plot a complete upper-and-lower channel continuously.
In an uptrend, it plots the lower boundary beneath price as trailing structure. In a downtrend, it plots the upper boundary above price as overhead structure. This gives the chart a cleaner appearance and keeps attention on the boundary relevant to the current regime.
Ten-level consensus model
The main Donchian period is supported by nine progressively shorter calculations:
N , N − 1 , N − 2 , … , N − 9 N,\; N-1,\; N-2,\ldots,N-9 N,N−1,N−2,…,N−9The principal regime begins with a score of + 10 +10 +10 for bullish conditions or − 10 -10 −10 for bearish conditions. One point is removed for every shorter window that disagrees with the main regime.
The sign communicates direction, while the magnitude communicates internal agreement:
- Strength 8–10: broad agreement and an established regime
- Strength 4–7: trend remains active, but internal structure is mixed
- Strength 1–3: early, fragile or deteriorating regime
The MQL5 implementation represents this confidence through darker-to-brighter colour levels because individual plot points do not use conventional alpha transparency in the same manner as some chart-rendering systems.
Continuation arrows
Small continuation arrows can appear when the consensus score has more than minimal support and either:
- The shorter Donchian windows have not yet reached complete agreement; or
- Price interacts with the active structural boundary.
These markers provide context about trend continuation or boundary interaction. They are not standalone buy or sell instructions.
Trend-flip markers
A small green circle below price identifies a bearish-to-bullish regime change. A small red circle above price identifies a bullish-to-bearish change.
The first ribbon point following a reversal is intentionally hidden. This prevents the old and new boundaries from being joined by an artificial diagonal line.
Strength-sensitive ribbon
The green or red ribbon becomes brighter as agreement across the ten Donchian calculations increases. A faint line suggests a fragile or internally divided regime, whereas a brighter line indicates broader structural agreement.
Alerts and notifications
The indicator supports:
- Bullish regime-change alerts
- Bearish regime-change alerts
- Popup terminal alerts
- Optional mobile push notifications
- Current-candle or confirmed closed-candle operation
Confirmed closed-candle alerts are used by default to reduce intrabar instability.
Customisable controls
Users can configure:
- Donchian period
- Ribbon width
- Bullish colour
- Bearish colour
- Continuation arrows
- Trend-flip markers
- Popup alerts
- Push notifications
- Current-bar or closed-bar signalling
The design document specifies a default 20-period calculation, a ribbon width of three pixels and optional continuation and reversal markers.
Practical interpretation
Donchain Trend Ribbon is particularly suitable for identifying whether price is operating within an upward or downward breakout structure. The stepped boundary can be used as a reference for trend invalidation, pullback analysis or trailing-exit research.
A bright green ribbon beneath price suggests that several Donchian lookbacks support the bullish regime. A faint green ribbon means that the main bullish state remains active, but shorter structures are beginning to disagree. The same interpretation applies inversely to the red bearish ribbon.
The indicator is inherently reactive. It confirms a breakout after price has already crossed a historical extreme. It may therefore enter late after an explosive candle and can generate repeated regime changes in range-bound markets.