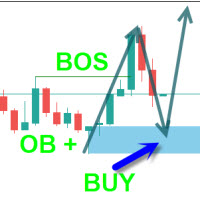
Apex Market Structure MT5
- インディケータ
- バージョン: 1.22
- アップデート済み: 9 6月 2026
- アクティベーション: 5

Apex Market Structure is a complete Smart Money toolkit that maps market
structure, order blocks, liquidity and multi-timeframe trend in real time,
directly on your chart. It is built for traders who read price action the
way institutions do: structure breaks, liquidity sweeps, and reaction zones,
all detected automatically and confirmed at bar close.
Everything is drawn for you. No manual line drawing, no guesswork, no second
indicator needed.
How It Works
The indicator continuously tracks swing and internal pivots to detect Break
of Structure (BOS) and Change of Character (CHoCH). When price closes through
a confirmed level, the event is labelled and the relevant order block,
liquidity zone, or sweep is plotted. All signals are confirmed on the closed
bar and do not repaint.
Market Structure
Two independent structure layers run at the same time. Internal structure
captures the short-term shifts inside the larger trend, while swing structure
tracks the dominant move. Each layer labels BOS and CHoCH separately and can
be filtered to show all events, BOS only, or CHoCH only. Strong and Weak
High/Low labels mark where liquidity is most likely resting.
Order Blocks, FVG and Liquidity
The indicator plots both internal and swing order blocks, filtered by ATR or
range volatility and removed automatically once mitigated. Fair Value Gaps are
detected with an adaptive threshold. Buy-side and Sell-side liquidity sweeps
(BSL / SSL) are flagged the moment price wicks beyond a swing and closes back,
helping you spot stop hunts before the real move. Equal Highs and Equal Lows
(EQH / EQL) highlight engineered liquidity pools.
Zones and Reference Levels
Premium, Discount and Equilibrium zones frame the current dealing range so you
trade from the right side of value. Previous Day, Week and Month highs and lows
can be projected onto lower timeframes as clean reference levels.
Multi-Timeframe Dashboard
A movable on-chart dashboard scans up to nine timeframes (M1 to MN1) at once
and shows internal and swing trend, the last structure event, and how many
bars ago it formed. The panel is fully draggable: grab the title bar and drop
it anywhere, then collapse it to a single line when you want a clean chart. Its
position and state are remembered when you switch timeframes. Read the higher
timeframe bias and the lower timeframe trigger from one place.
Market Sessions Clock
A live session panel shows Sydney, Tokyo, London and New York with an
open/closed status and a real-time countdown to the next change. Broker GMT
offset is detected automatically, so the clock stays accurate on any server.
Alerts
Optional alerts can fire on BOS, CHoCH, new Order Block, new Fair Value Gap,
and Liquidity Sweep. Each alert can be delivered as a terminal pop-up, a push
notification to the mobile app, or an email. Pop-up and push work with no setup.
Email delivery uses the terminal mail settings (Tools, Options, Email); Gmail
users need an App Password rather than the normal account password.
Parameters
Smart Money Concepts: Mode (Historical / Present), Style (Colored / Mono),
Color Candles.
Internal Structure: show, bull/bear filter and colors, confluence filter,
label size.
Swing Structure: show, bull/bear filter and colors, swing length, swing points,
strong/weak high-low.
Order Blocks: internal and swing counts, ATR or range filter, mitigation by
close or high/low, colors.
EQH / EQL: bars confirmation, threshold, label size.
Fair Value Gaps: show, auto threshold, colors, extend.
Highs & Lows MTF: Daily, Weekly, Monthly with style and color.
Premium / Discount Zones: show and colors.
Liquidity Sweeps: show, BSL and SSL colors.
Dashboard: corner, offset, width, font size, colors, per-timeframe rows.
Session Clock: show, auto GMT detection, manual GMT offset.
Alerts: BOS, CHoCH, OB, FVG, Sweep, with pop-up, push and email methods.
Usage
Attach the indicator to any chart and read the dashboard first for the higher
timeframe bias, then trade the structure on your execution timeframe. Use order
blocks and Fair Value Gaps as entry zones, liquidity sweeps as traps to fade,
and the Premium/Discount range to time entries. Drag the dashboard to a corner
that suits your layout and collapse it when you only need the chart.
Compatibility
Built for MetaTrader 5. Works on all symbols and all timeframes. The
multi-timeframe dashboard reads data from the higher timeframes regardless of
the chart it is attached to. Signals are calculated on the closed bar and do
not repaint.
Support
For questions and support, please use the comments section of this product page
or contact the author through the MQL5 messaging system.