Zero Lag BBT3
- インディケータ
- バージョン: 1.0

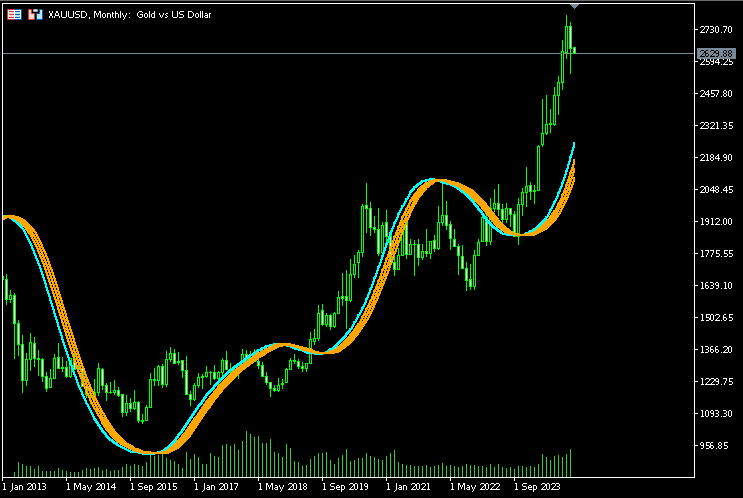
Is Zero Lag profitable? Not always, different system is for different pairs. You can play around with this indicator from Mladen, I have modified it with Bollinger Bands over T3.
You can change the period and how it calculate. MT5 version is available too....
Please leave a review , it helps us and we will share more indicators. ....
Thank you and happy trading