 MetaTrader 5
 エキスパート
 インディケータ
 ライブラリ
 ユーティリティ
 ウィジェット
 ルール
YouTubeにあるマーケットチュートリアルビデオをご覧ください
ロボットや指標を購入する
仮想ホスティングで
EAを実行
EAを実行
ロボットや指標を購入前にテストする
マーケットで収入を得る
販売のためにプロダクトをプレゼンテーションする方法
MetaTrader 5のためのエキスパートアドバイザーとインディケータ - 77
 自動売買ロボットとインジケータを使用して、外国為替取引の収益性を高めます。 自動売買ロボットを使用すると、取引の開始と終了を自動化でき、インジケータは市場の行動をより正確に予測するのに役立ちます。
このページには、MetaTrader5アプリケーションのカタログが掲載されています。
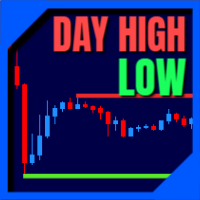
This indicator draw a line on high and low levels of X number of days. It is possible to have an alert (in the software and mobile app) for when the price breaks the high or low of the current day. Configurações: Days - past days to calculate (1 = actual day only).
Alert when reach levels - activate the alert for specific levels or both.
Push notification - enable the alert to the mobile MT5 app.
Appearance
High - high level color.
Low - low level color.
Size actual day - thickness
FREE

Supertrend Premium Institutional Edition is an advanced ATR-based trend-following indicator designed to identify market direction, generate entry signals, and provide real-time trading information. The indicator automatically detects bullish and bearish trends , displays buy and sell signals when trend reversals occur, and includes a professional dashboard showing current trend status, ATR value, active trend band, and signal direction. Key features include: Automatic trend detection usi
FREE

より滑らかで細かい揺れの少ないラインで、トレンドを読めます。5種類の信号処理フィルター。No repaint。
どの通貨ペア、どの市場、どの時間足でも。Strategy Testerで無料デモ。
Get more indicators here
Baselines, volatility filters and oscillators. No repaint.
なぜ必要か ノイズの多いラインは、小さな揺れのたびに転換します。新しいシグナルを見てエントリーすると、値動きが反転します。誤った転換は、そのたびにストップロスを失わせます。 得られるもの Fabii Ehlers Trend Baseline は5種類の信号処理フィルターを持つベースライン型インジケーターです。より滑らかなラインでトレンドを読めます。 1つのメニューに5種類のフィルターがあるため、ご自身の市場に合う滑らかさを選べます。 Super Smoother と Low-Pass は価格の小さな揺れを取り除き、FRAMA は市場の構造に追従するため、ラインの揺れが減ります。 終値が偏差バンドを超えたときだけトレンド転
FREE

Layer Master: Professional Grid Trading Tool for MT5 Transform your grid trading with Layer Master - the most intuitive and powerful order management toolkit designed specifically for professional traders. MT4 Version: https://www.mql5.com/en/market/product/79133
FREE - 7 Day Trial Version available. Please contact me to get your Free trial! Master Grid Trading with Precision
Layer Master revolutionizes how you place and manage grid trades. With our visual interface, you can: Deploy hun

プロダクト名 Turtle Classic Gold Trend EA 簡単な説明 Turtle Classic — 日次および総合ドローダウン保護、ポジションのスケーリング(ピラミッディング)、リアルタイム情報パネルを完備したMT5向けゴールド専用トレンドフォロー型自動売買EA。 詳細説明 はじめに Turtle Classicは、MetaTrader 5向けに設計されたゴールド(XAUUSD)専用のトレンドフォロー型エキスパートアドバイザー(EA)です。1983年の伝説的な「タートルズ(Turtle Traders)」のブレイクアウト手法をベースに、現代の相場環境に即した高度なリスク管理機能を組み込んで再構築しました。本EAはトレンドの発生を的確に捉え、シグナル確認後に段階的にポジションを追加し、多層的な保護ロジックでリスクを制御します。手動での監視を必要とせず、客観的なルールに基づいたゴールド取引を行いたいトレーダーに最適です。 動作原理(コンセプト概要) 内部ロジックによる2種類の時間軸ブレイクアウト判定:短期トレンドを捉える高速ロジックと、より大きな値幅をフォローする低速バッ
FREE

Mr_Luky_NQ_V1 is an Expert Advisor for MetaTrader 5 designed for Nasdaq trading. It analyzes price structure using an internal fractal-based calculation and confirms direction with the Stochastic oscillator. It considers an entry only when both readings agree. The analysis runs once a day at a configurable time based on the broker’s server clock. Take Profit and Stop Loss are set as monetary amounts. Users can also adjust the trading volume, the maximum daily loss, and an equity drawdown limit t
FREE

My other indicators:
https://www.mql5.com/en/market/product/156702 (FREE)
https://www.mql5.com/en/market/product/153968 (FREE)
https://www.mql5.com/en/market/product/153960 (FREE) This indicator displays higher timeframe candles directly on your lower timeframe chart, allowing you to monitor higher timeframe price action without switching between charts. It also plots session highs and lows for the Asia, London, and New York kill zones, giving you key liquidity levels directly on your chart. Wh
FREE

Anchored Periodic VWAP with Deviation Bands A lightweight, interactive VWAP indicator that restarts every Day, Week or Month, with a built-in on-chart control panel. Overview Anchored Periodic VWAP plots the Volume Weighted Average Price and resets it automatically at the start of each Daily, Weekly or Monthly period. Around the VWAP it draws two pairs of standard-deviation bands, so you can see at a glance where price is trading relative to the period’s “fair value”. You can switch the anchor p
FREE

AI ZONE RADAR — サポートとレジスタンスを、ゾーンで見やすく お使いのプラットフォームに合わせて選べます こちらはMT5版です。MT4版もあります。 MT4版の商品ページはこちら MT4版・MT5版は別商品です。この購入に含まれるのは、選んだプラットフォーム用の製品です。 サインを見る前後に、価格の位置も確認したい方へ 買いサインが出ていても、すぐ上にレジスタンスがある。押し目に見えても、近くにサポートが見当たらない。こうした場面では、サインだけでなく「どこで出ているか」も確認したくなります。AI ZONE RADARは、周囲のサポート・レジスタンスと相対的な強さをひとつの画面にまとめ、判断前の確認を手助けします。 AI ZONE RADARはMT5用のチャート分析インジケーターです。パネル・状態表示・ツールチップはMarketの全11言語に対応し、言語は自動・手動で切り替えられます。 English / Russian / Chinese (Simplified) / Spanish / Portuguese / Japanese / German / Korean /

ChopShield Pro — Smart Range Shield & Trend Hunter ChopShield Pro is a technical trend indicator that utilizes the dynamic momentum oscillator (Chande Momentum Oscillator — CMO) to automatically adapt its smoothing period to current market volatility. Unlike standard fixed-period moving averages (EMA, SMA), ChopShield Pro continuously measures market momentum: In the consolidation phase (ranging market / chop): As relative volatility decreases, the smoothing factor drops, and the indicator l
FREE

OEA-ATR Oscillator is a professional technical indicator designed to identify price exhaustion, overbought/oversold zones, and high-probability reversal opportunities. Unlike traditional oscillators based purely on closing prices or fixed percentage moves, OEA-ATR measures the true price stretch relative to current market volatility (ATR) , making it dynamic and perfectly adaptive to any asset or market condition. Key Features Volatility-Based Calculation (ATR): Measures price deviation from an
FREE

GoldPulser EA - マルチ通貨対応の高度なスキャルピング・トレンドフォロー自動売買システム GoldPulser EA は、スキャルピングの精度とトレンドフォローの信頼性を融合させた、洗練された自動売買システム(エキスパートアドバイザー)です。安定した収益を求める外国為替(FX)トレーダーのために設計され、独自開発のアルゴリズムを使用して、複数の通貨ペアにわたる高確率のトレード機会を識別します。 【主な特徴】 マルチタイムフレーム分析: M5(5分足)からH4(4時間足)までの複数の時間軸を同時に分析し、最も精度の高いエントリーポイントを特定します。市場のノイズをフィルタリングし、真のトレンドの転換点やブレイクアウトを捉えます。 高度なリスク管理: 固定ロットに加え、口座残高の一定百分比に基づくダイナミックなロットサイズ計算機能を搭載。最大ドローダウン限度、一日の最大損失限度、トレードごとのリスク設定など、多層的な防衛機制により、資金を保護します。 組み込み経済ニュースフィルター: 高インパクトな経済指標発表前後の極端なボラティリティやスプレッドの急拡大を自
FREE

Session / Killzone / Time Filter
市場が本当に動いている時だけ取引する 多くの自動売買戦略は、デッドアワー、祝日、日次ロールオーバーのスプレッド拡大時間帯に執行されるため、バックテストでは利益が出るのに実運用で損失を出します。 FTMO 、 The Funded Trader 、 MyFundedFX 、 FundedNext のワークフローでテスト済みです。 Session / Killzone / Time Filter は設定したセッション外での新規注文をブロックし、低流動性時間帯にはオープンポジションの決済や指値注文のキャンセルも可能です。一つのツール、チャートへの一回のドロップで、EA の取引時間を完全にコントロールできます。
MetaTrader 4 と MetaTrader 5 に対応。あらゆる銘柄と時間足で動作します。 本フィルターには London、New York、Asia の組み込みセッション、二つの完全カスタム可能な Killzone、欧州および米国ルールに対応する自動サマータイム処理、曜日フィルター、金曜の早期カットオフが含ま

CONFLUENCE DIVERGENCE TRADER Confluence Divergence Trader identifies high-probability reversal setups by combining RSI divergence detection with a weighted multi-factor confluence scoring system — ensuring the EA only trades when the market context genuinely supports the signal. HOW IT WORKS The EA follows a strict step-by-step decision flowchart: RSI DIVERGENCE DETECTED Scans for classic bullish and bearish divergence between price pivots and RSI values over a configurable lookback period. OVER
FREE

Prior Session Break Gold Strategy — FREE Version (1H Session EA) | XAUUSD Free Version — Limited Functionality This is a restricted version of the full Prior Session Break Gold Strategy , designed for traders who want to experience the core breakout logic before upgrading . Overview The Free Version uses the exact same logic as the full system — trading the most important daily levels on gold: When price breaks these levels, the EA executes a trade based on pure structural logic — no indica
FREE

About Golden Rain EA (The EA is built for the current market) Golden Rain EA is a sophisticated algorithmic trading system engineered specifically for XAUUSD (Gold), combining precision entry with intelligent risk management. Operating within the high-liquidity London and New York sessions, the EA excels at identifying key reversal opportunities at validated support and resistance zones. Each trade undergoes rigorous validation through a multi-layer confirmation process, including candlestick p
FREE

# RBEA Volume Candle v1.01 — brief description (EN)
**What it is:** A free visual indicator for MetaTrader 5 that **colors each candle based on its relative volume** and marks **traps** with arrows (new extremes formed with *less* volume than the previous extreme—a classic signal of a potential reversal). It does not trade; it only analyzes.
**Key benefit (in one line):** It tells you at a glance whether the price movement is **backed by volume** or if it is a trap.
## Key features
- **Colo
FREE

======================================================== GOLD WAVE LEVELS (ELLIOTT-ALIGNED) - MQL5/MT5 MARKET DESCRIPTION (formatting: **bold** = Bold button; lines with • = bullet list; UPPERCASE = heading) ========================================================
OVERVIEW ------------------------------------------------------- **Gold Wave Levels** draws a tested wave backbone for gold and validates signals against **Elliott theory hard-rules**, with higher-timeframe context and per-timeframe
FREE

値動きがまだ取る価値のあるうちに転換するMACD。Schaff Trend Cycle MTFはMACDを二回のストキャスティクス処理に通し、MACDのゆっくりした漂いの代わりに、鋭く早い転換を持つゼロから百のサイクルへ圧縮します。そして交差ではなくゾーンからの転換で発火します。どのチャートでも任意の上位時間軸で、読むのは確定した上位足だけです。無料です。試用期間なし、機能制限なし、上位版への誘導なし。 速い指数平均と遅い指数平均から作ったMACDを、サイクル窓の上で二回のストキャスティクス処理に通し、それぞれに二分の一の軽い追加平滑をかけます。すでに差分を取った系列に二回通すことが、結果を有界なサイクルに圧縮し、その転換を鋭く早くしています。 シグナルはゾーンからの転換です。買いは二十五の線を上へ抜ける転換、売りは七十五の線を下へ抜ける転換です。十と九十の水準はシグナルを等級1ではなく2にするだけです。何も除外されず、すべての転換が公開されます。 チャート上の表示 専用ウィンドウには、サイクルを一本の線として、そのゾーン水準とともに描きます。ダイバージェンス線はその線の上に引かれ、望
FREE
This indicator was developed to support multiple timeframe analysis. In the indicator settings, the user can set the color, width, and style of the horizontal lines for each timeframe. This way, when the horizontal lines are inserted into the chart, they will be plotted with the timeframe settings.
MTF Lines also allows visibility control of another objets like rectangles, trend lines and texts.
This is a product developed by Renato Fiche Junior and available to all MetaTrader 4 and 5 users!
FREE

A textbook daily Donchian trend rule for gold — published with its full 9-year test, including the losing year. We build and sell Gold GodTier. Before that, we tested the simplest trend rule there is, with no parameter tuning, under the same rules we use for our paid EA. It did not pass our bar (small edge, t = 0.74), so we are giving it away with every number attached. If you want to see what an honestly tested EA looks like, this is it. Rule (defaults are the tested values) Entry: price breaks
FREE

Trend Meter – Your Tool for Identifying Strong and Reliable Trends Trend Meter is an advanced and highly customizable indicator designed to help traders identify the direction and strength of the current trend with greater accuracy, significantly reducing noise and the reliance on single signals. It's the ideal solution for those seeking reliable signals and wanting to trade with more confidence. Key Features: Three Independent Trend Meters : Choose from various trend logic options, such as MACD

Clone MT5 は、チャート履歴の中から現在と似た相場状況を探すためのインタラクティブなツールです。価格の任意の区間を枠で選択すると、Clone が同じ銘柄の過去から最も似た区間を検索し、チャート上に表示して現在のサンプルと比較できるようにします。 これはシグナルインジケーターでもEAでもありません。「過去に似た状況はどこで起き、その後どうなったのか?」というシンプルな疑問を検証するための市場分析ツールです。
サンプル (Sample) — 青い枠で囲まれたチャート区間です。長さと位置はマウスでチャート上から直接変更できます。 クローン (Clone) — 選択した比較モードに基づき、サンプルに最も似ている同じ長さの過去区間です。 ボラティリティレンジ — 拡張された過去クローン群のその後の値動きをもとに、直近の値動きの可能な幅を推定します。
使い方:
インジケーターは直近のバーに枠を配置し、自動的にクローン検索を開始します。 枠の左右のハンドルをドラッグするとサンプルの長さを変更できます。枠全体をドラッグすると選択区間を移動できます。 マウスボタンを離すと、利用可能な履歴を

Major Market Structure is a technical analysis indicator for MetaTrader 5 designed to display confirmed market structure directly on the chart. The indicator focuses on significant swing points instead of marking every minor price fluctuation. It helps traders observe the relationship between major highs, major lows, structural breaks and potential reaction zones across different market conditions. Main features Displays confirmed Major High and Major Low points Identifies bullish and bearish Br
FREE

プロフェッショナル版エキスパートアドバイザーのご紹介 信頼に基づいて構築され、卓越性を追求して磨き上げられた
2023年9月にオリジナル版エキスパートアドバイザーをリリースした際、私たちの目標はシンプルでした:信頼できる、使いやすい取引ツールを提供し、実際の価値をもたらすこと。以来、世界中の何百人ものトレーダーからのフィードバックを受けて、私たちの無料版は500回以上のダウンロードを達成し、コミュニティから4.5つ星評価を得ています。
私たちは耳を傾け、改良しました。そして今、私たちはプロフェッショナル版を誇りを持ってご紹介します — より強力で機能豊富な新バージョンです。あなたの取引を次のレベルへと引き上げることを目的としています。
プロフェッショナル版の新機能 強化された機能: 世界中のコミュニティのフィードバックを基に、プロフェッショナル版には、取引体験をより効率的で柔軟にするための最もリクエストの多かった機能が追加されています。
パフォーマンスの向上: 新しいバージョンは、先進的な機能と最適化を活用して、取引の実行、戦略の適応性、信頼性を改善しています。
クリーンで
FREE

Darkstone SNR — Support & Resistance Engine by Darkstone Capital Darkstone SNR is a lightweight, non‑repainting Support & Resistance detection system designed for traders who want clean, objective market structure levels without noise or lag. Built on a rules‑based confirmation model, the indicator identifies key swing‑based support and resistance zones and updates them dynamically as market conditions change. This tool is engineered for stability, clarity, and compatibility with any trading sty
FREE

Gmine MOHD-iK PRO is an advanced algorithmic trading system specifically engineered for XAUUSD (Gold). This Pro version is designed for traders who require a sophisticated balance between aggressive growth and professional risk containment. Unlike "black-box" systems, this EA gives you full access to the internal logic parameters, allowing you to tailor the strategy to your specific account size and risk appetite.
Text me after Purchase for Set Files. Strategy & Execution Logic The PRO version
FREE

Ichimoku MTF Dashboard reads the full Ichimoku Kinko Hyo system across four timeframes at once and turns it into a single clear state for each of them. Instead of crowding every chart with five overlapping lines, it answers the question that actually matters at a glance. On M15, H1, H4 and D1, is price above, inside or below the cloud, and is the balance tilting bullish or bearish.
For each timeframe the panel combines four honest Ichimoku readings. It looks at the position of price relative to
FREE

Please Good Review on this indicator, and i will maybe produce more indicators, Coming soon, EA base on this indicators
Linear Weighted Moving Average with HLCC applied price, and Bollinger bands with LWMA as applied price. Interesing Buy and Sell arrow based on this indicator , non Lag indicator as arrow will appear 1 candle after crossed...............
FREE

Introducing VFI (Volume Flow Indicator) – a trading indicator that analyzes the relationship between volume and price movement to identify key trading opportunities. The indicator displays the strength and direction of volume flow, providing clear signals about potential entry and exit points. Signals are formed based on zero line crossovers, crossovers between the VFI line and its exponential moving average (EMA), and when the indicator exits overbought and oversold zones.
Attention! This stra
FREE
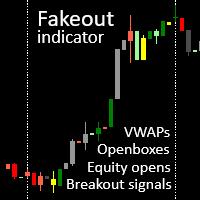
Fakeout candle indicator with session VWAPs, openboxes and openbox breakout signals. Check out our other products for fxer.net:
https://www.mql5.com/en/market/product/114888
https://www.mql5.com/en/market/product/114890 Main features 1. VWAPS for Tokyo, London and NY sessions 2. Openboxes for Tokyo, London and NY sessions 3. Colored candles for breakouts, fakeouts and inside candles 4. Equity open line 5. Openbox expansions 6. Unmitigated equity open prices for Tokyo, London and NY sessions
FREE

ABJ EA DASHBOARD turns your account history into a clean, full-window dashboard on your chart. You can see which Expert Advisors or strategies make money and which lose, without opening the History tab or using spreadsheets. The tool is display-only. It never opens, closes or modifies a trade. Main features Fills the whole chart window. The layout, fonts and buttons scale automatically when you resize or maximize the chart. The A-, Auto and A+ buttons let you adjust the size by hand. Automatic g
FREE

XAU Liquidity Retest EA
17 Years of Algorithmic Trading Experience Built into an XAUUSD Strategy XAU Liquidity Retest EA is not based on random entries or isolated indicator signals. It uses a deterministic strategy that analyzes market structure, liquidity sweeps, displacement, Order Blocks, and retests before validating an entry. XAU Liquidity Retest EA v1.46 is a deterministic MT5 Expert Advisor developed specifically for Gold (XAUUSD). It combines M15 trend structure, M5 liquidity sweeps,

HA Flow Mean HA Flow Mean is a free adaptive equilibrium indicator for MetaTrader 5. It brings candle structure, directional persistence and smoothing together in one color-coded line on the main price chart. An optional information panel provides a clear summary of the most recently closed candle. What the indicator measures The calculation combines three elements of each candle: the direction and relative size of its real body, the imbalance between its upper and lower wicks, and the position
FREE

The OHLC indicator shows the current and historical values of High, Low, Open, Close and Mid for a specific time period. It can plot the current values or the values from the previous session. The indicator's range can be calculated from a daily, weekly, monthly, or user-specified session.
Levels High of the current or previous session. Low of the current or previous session. Open of current or previous session. Close of the current or previous session. Midpoint of the current or prev
FREE

Flow Anchor インジケーターは、MetaTrader 5 用の「非リペイント型」トレンドエンジンです。標準 14 期間 RSI(終値ベース)と、典型価格(high+low+close の平均)に基づく 14 期間 Money Flow Index の平均からなる相対モメンタム指数(RMI)に、レンジ加重移動平均と ATR 由来の適応型バンドを組み合わせています。その結果、支配的なトレンドを追従する 1 本のカラーアンカーラインが生成され、上昇局面では価格の下に、下降局面では価格の上に位置し、ローソク足を貫通することはありません。トレンド状態が切り替わると、チャート上に BUY/SELL の矢印が描画され、最大 4 種類の通知チャネルでアラートを送信できます。
MT4 版はこちら: Flow Anchor MT4 その他の製品を見る: すべての商 品 リアル口座での使用例や新ツールをチェックしたい方は、プロフィールを訪問してフレンドリクエストを送り、最新アップデートを見逃さないようにしてください。 動作概要 ハイブリッド・モメンタム指数(RMI) RMI は 2 つの有
FREE

MACD Advanced with Colored is an enhanced MACD indicator for MetaTrader 5 with a four-color system that makes trend and momentum easy to read at a glance. Features Four-color histogram: strong bullish, weak bullish, weak bearish and strong bearish, so momentum and its trend are clear instantly. Standard MACD engine: keeps the familiar MACD/Signal calculation, just clearer to read. Quick momentum context: the color distinguishes accelerating from fading moves, which a plain MACD does not. Works o
FREE

RiskCalculatorOrders - Professional Risk Management EA RiskCalculatorOrders is an Expert Advisor designed to provide traders with a seamless and efficient way to manage risk and execute trades directly from the MetaTrader 5 chart. Key Features Dynamic Risk Calculation: Automatically calculates the optimal lot size based on your predefined risk percentage (of your account balance) and the distance to your Stop Loss level. Visual Control Panel: Intuitive, user-friendly interface overlaid on the ch
FREE

ほとんどのトレンド指標は選択を迫ります:頻繁なダマシを伴う素早いシグナル、それとも20本遅れるスムーズな出力。問題は移動平均線ではありません——ボラティリティが変化するのに指標が追随しないことが問題です。
Meridian Trendは、ボラティリティ正規化とモメンタムフィルタリングを内蔵した適応型トレンド指標です。リアルタイムで適応——EURUSD、ビットコイン、ナスダックのいずれでも同一の動作。銘柄ごとの調整不要。1つの設定、あらゆる資産、あらゆる時間足。
仕組み
Meridian Trendは、トレンド方向に厳密にラチェット進行するボラティリティ適応型エンベロープを通じて価格を追跡します:
• 上昇トレンドでは、エンベロープは上方にロック——上昇のみ可能で下落はしない • 下降トレンドでは、エンベロープは下方にロック——下落のみ可能で上昇はしない • 反転時には、モメンタムでフィルタリングされたクロスオーバーが方向転換を確認——リボンが反転し、矢印がそのバーをマーク
FREE

High/Low Daily Levels is a robust, lightweight indicator for MetaTrader 5 that plots the High and Low of the trading day as clean horizontal lines directly on your chart. Levels are read from the D1 series, so they are identical on every chart timeframe, from M1 to D1.
Whether you trade breakouts, trend continuations or mean reversion around key session boundaries, the indicator gives you precise visual references without cluttering your workspace.
Key Features: * Three display modes: Current
FREE

WHICH SIDE IS OPEN? You trade gold on M5 or M15, but the trend that matters is on H1. ATS Gold Bias puts the H1 picture on the chart you trade, so you never have to switch timeframes to know which side is open. THE H1 BIAS LINE The H1 EMA 50 drawn on your chart, bar by bar Green while the last closed H1 bar is above it: longs allowed Red while it is below: shorts allowed A dot where the bias turned, plus an optional popup or push alert THE PANEL The side that is open, and since when (date, hour
FREE

Recommendations Time Frame: 1H Minimum Deposit:$400 USD Currency Pair Gold / XAUUSD Setting: D efault Fully automatic adviser Peri Peri Gold do not use any dangerous trading methods: No Grid , No martingale. The strategy was Back-tested Stable from 2018 to 2023 using every tick based on real ticks in MT4 using Exness Real Ticks 100% tick quality. Live trading is going well on my Exness and ic markets broker.
FREE

DESCRIPTION Renamed to Liquidity Boxes and Sweeps. New logo. No changes to how the indicator works. Hurricane Liquidity Boxes and Sweeps finds and draws three price-action structures on your chart automatically: - Boxes: sideways ranges where price was trapped, with the top and bottom marked - Liquidity pools: equal highs and equal lows, marked "$$$" while untouched and "taken" once price runs through them - Liquidity sweeps: candles that pierce a level and close back inside Features - Scan
FREE

MSRLab Yen Long EA MSRLab Yen Long EA is a buy-only London-range breakout EA for selected JPY currency pairs. It monitors the configured pairs for a fresh bullish close above the London-session high. When a valid breakout appears, the EA calculates the stop from the London range and places a buy trade with a pair-specific reward/risk target. The EA does not use: Short trades OCO orders Martingale Grid recovery Loss doubling Manual trade intervention Default symbols The default portfolio contain
FREE

The Expert Advisor is based on the signals of the Stochastic indicator in the overbought zone-we sell, in the oversold zone-we buy. Version for MT4 https://www.mql5.com/ru/market/product/62952 Monitoring the work of the adviser MT4 https://www.mql5.com/ru/signals/1178019 MT5 https://www.mql5.com/ru/signals/1178043 If the Expert Advisor is used in 5/24 mode on a VPS, I recommend using this Expert Advisor in a conservative mode, limiting the number of orders in the grid using the " Count_Order
FREE

Check Live Signal - Click Here
Markets are becoming increasingly volatile these days. Navigating wild price swings requires a systematic, mechanical, and disciplined approach rather than relying on directional guesswork. The Simple Hedge Replace Fibonacci Expert is a highly specialized MetaTrader 5 system designed specifically for active markets like XAUUSD. It utilizes a continuous hedge-replacement framework combined with a mathematical lot progression to manage trades and capitalize on pric

Trend Horizon EA is an expert advisor that follows trends using a moving average and a stochastic oscillator considering the volatility with the atr indicator. When the stochastic oscillator detects a crossover in the direction of the trend, it sends an order to the market, It is configured for use with EUR/USD on the 5-minute timeframe but also works on all markets.
Features: - Works with all currency pairs, commodities, and indices on all timeframes. - Works on multiple charts simultaneousl
FREE

The Time Above Equilibrium Pattern identifies potential exhaustion points by measuring how long price remains above or below a dynamic equilibrium level. Creator: https://www.quant-atlas.com/ The equilibrium line acts as a smoothed reference point for market balance. When price spends an extended period above this line, the indicator tracks the duration of that move and monitors whether upward support is beginning to weaken. A bearish exhaustion signal may appear when price has remained above e
FREE

Pro Candles — Identificação visual de candles de reversão O Pro Candles é um indicador desenvolvido para destacar possíveis candles de reversão diretamente no gráfico do MetaTrader 5. Ele analisa o tamanho do corpo dos candles, compara esse movimento com a média recente e procura formações direcionais de engolfo. Quando encontra uma configuração compatível com seus critérios, o indicador exibe uma seta próxima ao candle analisado. Principais recursos Identificação visual de possíveis reversões d
FREE

The Stochastic RSI (StochRSI) is a technical indicator that combines the characteristics of the Relative Strength Index (RSI) with the Stochastic Oscillator, resulting in a more sensitive tool that generates a higher number of trading signals. Developed by Tushar Chande and Stanley Kroll, the indicator was designed to overcome a perceived limitation of the traditional RSI: the low frequency of overbought and oversold levels activation (commonly 80 and 20), especially in less volatile assets. Ho
FREE

Envelopes RSI Zone Scalper MT5 EA Unleash your trading edge with the Envelopes RSI Zone Scalper MT5 EA , an Expert Advisor for MetaTrader 5, engineered to thrive in any market—forex, commodities, stocks, or indices. This dynamic EA combines the precision of Envelopes and RSI indicators with a zone-based scalping strategy, offering traders a versatile tool to capitalize on price movements across diverse instruments. Whether you’re scalping quick profits or navigating trending markets, this EA del
FREE

This indicator shows colored candles when price are strongly distorted in relation to their averages.
A good time for buy can be seen after the closing of a silver candle. The pattern becomes more reliable if the purchase is opened when the price of the candle after the silver candle is above the maximum price of the silver candle.
A good time for sell can be seen after the closing of a pink candle. The pattern becomes more reliable if the sale is opened when the price of the candle after
FREE

VIX GOLDEN BREAKOUT EA Built with Vix Algo Builder, the free automated Expert Advisor builder created by a team of developers from Vix Algo Trading, this EA has proved to be the ultimate range breakout EA for XAUUSD. This EA is free because it was builtfor FREE but it is a high grade perfomance EA.
CLICK HERE TO VIEW SIGNAL
This Range breaout Expert advisor uses a Stop Order based range breakout coupled with a High Timeframe Filter (H4 EMA 50). The EA places stop orders in the direction of
FREE
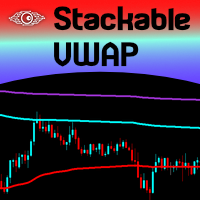
Volume Weighted Average Price (VWAP) is a trading benchmark commonly used by Big Players that gives the average price a Symbol has traded throughout the day. It is based on both Volume and price. Additionally we put in this indicator the MVWAP (Moving Volume Weighted Average Price). For those who do not know the usage and the importance od this indicator I recommend a great article about this subject at Investopedia ( https://www.investopedia.com/articles/trading/11/trading-with-vwap-mvwap.asp
FREE

PipsCounter Basic は MetaTrader 5 用のインジケーターで、未決済ポジションのリアルタイムでのピップ変動を表示し、当日にクローズされた取引のサマリーを提供します。 すべての情報は、チャートのメインウィンドウにわかりやすく控えめな形式で表示されます。 機能 リアルタイムのピップ追跡
各未決済ポジションのピップ差を、市場のティックごとに継続的に更新します。 デイリーピップ合計
当日のすべてのクローズ済み取引の純ピップ値を表示します。 TP/SL 価格ラベル(新機能)
テイクプロフィットおよびストップロスの価格を、それぞれのライン上に自動的に表示。色、フォント、位置はカスタマイズ可能です。 表示のカスタマイズ
パネルの位置(チャートの四隅)、フォント、文字サイズ、利益/損失/ニュートラル状態の色を自由に設定可能。 幅広い互換性
通貨ペア、株価指数、金属、商品、シンセティック資産など、すべての MetaTrader 5 インストゥルメントに対応。ティックサイズ、小数点精度、価格形式に依存しません。 使用例 未決済ポジションのピップ変動を視覚的にモニター。
FREE

GBPUSD Trend Rider EA A rule-based trend-following expert advisor for GBPUSD (H1), combining EMA(8/21) crossover trend direction, 2-candle confirmation, and RSI filtering to avoid overbought/oversold entries. the boot only work in GBPUSd. Features: Session filters — trade only during Asia / London / New York (fully configurable) Risk-based position sizing (% of balance per trade) Fixed 2:1 reward-to-risk (200 SL / 400 TP points, adjustable) Max 1 trade at a time — no overexposure Full trade logg
FREE

どのVWAPクロスが重要か迷うのは終わりです。1本の色付きラインがあなたの側を示します。No repaint。
全通貨ペア対応。日次、週次、月次のアンカー。2分でチャートに表示。Strategy Testerで無料テスト。
Get more indicators here
Baselines, volatility filters and oscillators. No repaint.
必要な理由 多くのトレーダーは出来高加重平均価格(VWAP)を1本の線として見て、タッチのたびに迷います。このベースラインは明確な側を示します。買い手が期間を握っていれば緑、売り手なら赤です。1つのチャートで、2つ目のインジケーターなしに、1秒でバイアスを読み取れます。 得られるもの 得られるもの: 高値と安値のVWAPから作る色付きベースラインで、バイアスをひと目で読み取れます オプションの色付きローソク足で、価格バー上で直接サイドを確認できます 日次、週次、月次のアンカーから選べるので、ラインをスタイルに合わせられます ライン端のライブ値ラベルで、現在のVWAPの位置が分かります サイドが変
FREE

SmartTrend Navigator MT5 is a clean, beginner-friendly multi-timeframe trend dashboard designed to help traders understand market direction quickly and clearly. Instead of switching between several indicators and timeframes manually, SmartTrend Navigator MT5 combines multiple popular technical tools into one simple dashboard. It analyzes the market using EMA, ADX, MACD, and RSI , then displays an easy-to-read final result: BUY , SELL , or WAIT . The indicator is built for traders who want a sim
FREE

Heiken Ashi Direct Standard Heiken Ashi candles with two extra data lines your other tools can read directly. What it does This indicator draws classic Heiken Ashi candles on your chart, calculated the same way MetaTrader's built-in Heiken Ashi indicator does. On top of that, it quietly keeps two extra values available — the real high and low of each Heiken Ashi candle — so that any Expert Advisor or other indicator you run can read them directly, without doing any extra math on its own. It does
FREE

Native Depth Viewer renders the order book of the current symbol directly on the chart: ask ladder, bid ladder, spread, and bid/ask volume imbalance. MarketBookAdd, OnBookEvent and MarketBookGet, the functions this indicator is built on, have no equivalent in MQL4. This reading is native to MetaTrader 5 only.
WHAT IT SHOWS
When your broker does publish a real book for the symbol: Ask ladder (sell side), worst price first, reading top-down like a real DOM Bid ladder (buy side), best price firs
FREE

RSI Divergence Auto Indicator for MT5 RSI Divergence Auto は、 MetaTrader 5 用 の インジケータ ー で、 価格 の 動き と 相対 力 指数( Relative Strength Index、 RSI) の 間 に 発生 する 可能性 の ある 強気 および 弱気 の ダイバー ジェン ス を 自動的 に 検出 し ます。 この インジケータ ー は、 価格 の 高値・ 安値 と RSI の 高値・ 安値 を 比較 し ます。 両者 の 動き に 相違 が 検出 さ れ た 場合、 ダイバー ジェン ス を チャート 上 に 直接 表示 し ます。 主 な 機能 強気 ダイバー ジェン ス の 可能性 を 自動 検出。 弱気 ダイバー ジェン ス の 可能性 を 自動 検出。 Bull および Bear ラベル を 表示。 RSI ライン を 別 ウィンドウ に 表示。 モメンタム の 変化 を 識別 する ため の サポート。 さまざま な 銘柄 や 時間 足 に 対応。 外部 データ は 不要。 ポジション
FREE
Moving Average Convergence/Divergence — схождение/расхождение скользящих средних — технический индикатор, разработанный Джеральдом Аппелем (Gerald Appel), используемый в техническом анализе для проверки силы и направления тренда, а также определения разворотных точек. Встроенный в MetaTrader 5 индикатор MACD не соответствует задумке автора (Gerald Appel):
-линия MACD графически изображена в виде гистограммы, однако гистограммой отражается разница между линией MACD и сигнальной линией;
-сигнальн
FREE

## Spike Hunter PRO
Spike Hunter PRO is a fully automated Expert Advisor for MetaTrader 5, designed to capture profit from sudden high-velocity price movements on XAUUSD (Gold). The EA detects genuine spikes in real time and enters the market within milliseconds of detection.
---
**How it works**
The EA continuously monitors price movement speed on every tick. When price accelerates beyond the configured threshold, the EA opens a trade in the direction of the spike and immediately begins pr
FREE
SyntheticaFX Dex 900 Down EA
The SyntheticaFX Dex 900 Down EA is a specialized trading tool designed exclusively for the Dex 900 Down index. This Expert Advisor is engineered to deliver steady, long-term account growth by leveraging a strategic approach tailored to this unique market. For optimal performance, it is recommended to run the EA on a Virtual Private Server (VPS) with a minimum account balance of $300 using default settings. Ideal for traders seeking consistent progress, SyntheticaF

Professional Non-Repainting TMA Channel Indicator for MetaTrader 5 TMA Channel PRO Non Repaint is a professional trend and volatility channel indicator designed for traders who work with dynamic support/resistance zones, trend continuation, reversals, and channel-based trading systems.
MAIN FEATURES • Non-Repainting Logic
• Dynamic TMA Channel
• Vertical Histogram Cloud
• Median Trend Lines
• Buy & Sell Signal Zones
• Adaptive Volatility Structure
• Multi-Timeframe Compatibility
• Suita

OrderX は MetaTrader 5 用のユーティリティで、チャート上から直接、手動での注文発注、リスクに基づくポジションサイズ計算、トレード管理を行えます。 ウェブサイト: https://orderx.quoc.app
Youtube: https://youtu.be/R0Es4O2qxxI 主な機能 指定したリスク金額と Entry から Stop Loss までの距離から、取引数量を計算します。 チャート上の Entry と Stop Loss の水準を使って、成行注文、指値注文、逆指値注文を発注します。 Entry、Stop Loss、Take Profit の水準をチャート上で直接ドラッグできます。 低い R:R 目標と高い R:R 目標を別々に設定できる、分割 Take Profit(任意)に対応しています。 ChartX(または ZoomX)で描画したロング/ショートのセットアップを、キー 1 つでインポートできます。Entry、Stop Loss、Take Profit は、全か無かの検証を経てドラフトに入力されます。 キーボードだけで操作可能:X で

Engulfing In FVG EA — From Learn to Earn.
The pattern every trader learns first, taken where you have not seen it before: an engulfing validated only when a Fair Value Gap swallows it whole. A PATTERN EVERYONE KNOWS. A CONFIRMATION NO ONE ELSE ASKS FOR. The EA detects the engulfing — full or partial, your choice of strictness — on a higher timeframe, then requires a Fair Value Gap, formed on the timeframes you choose, whose gap swallows the engulfing range. Only a containment above your thresho

Click Here To View All Our Products List We have a Smart Money Concepts Scanner among the product list above Fair Value Gaps (FVG) are areas of supply/demand imbalance around a price area due to rapid price movement caused by bullish or bearish pressure outweighing the market reaction. The areas are identified by a space or gap in-between 3 consecutive candles. These areas can serve as a good support / resistance zone for trend re-entry especially when combined with market structure, liquidity
FREE

「KS Smart FVG With Volume Feature」は、MetaTrader 5向けのFair Value Gap (FVG) インジケーターです。従来のFVG検出機能に、出来高(ボリューム)を考慮した分析を組み合わせることで、ギャップの強度や市場の文脈をより正確に把握できるように設計されています。
基本コンセプト
本インジケーターは「Fair Value Gap(FVG)」、すなわちローソク足の範囲によって生じる価格の不均衡(例:1本目のローソク足の高値と3本目のローソク足の安値の間に隙間ができる状態など)を特定します。これらのギャップは、価格を引き寄せる「磁石」のような役割や、サポート・レジスタンス(支持・抵抗)ゾーンとして機能することがよくあります。
主な機能
1. 出来高加重によるFVGのカラーリング(最大の特徴)
急激な価格変動を伴うローソク足(FVGパターンの中心となる足)の出来高を分析します。
設定期間(InpVolMAPeriod)の平均出来高と比較します。
各FVGを以下の3段階に分類します:
強(高出来高)
標準(平均的な出来高)
FREE

SecondScope MT5 — MetaTrader 5 用 秒足チャート 秒足チャート ― 市場が通常見えない領域 多くのトレーダーは、M1、M5、M15 といった標準的な時間足で取引を行っています。
しかし、これらのローソク足の間には、市場が実際に動いている時間が存在します。
その部分はプラットフォーム上には表示されません。
これが ブラインドゾーン(死角) です。 秒足チャートは、この隠された市場の領域を可視化します。 秒単位で価格の動きを表示することで、分足やそれ以上の時間足では完全に見えない市場構造を確認できます。 SecondScope は完全なチャートです 秒足チャートは、MetaTrader 5 の標準チャートと同じように使用できます。 あらゆるインジケーターを適用可能 エキスパートアドバイザー(EA)の実行 テンプレートの使用 MT5 の標準分析ツールをすべて利用可能 制限はありません。 M1 や H1 と同じ感覚で秒足タイムフレームを使用できます。
違いは、データの時間精度が高い点だけです。 MT5 の Strategy Tester は、カスタムチャート(この
MetaTraderマーケットは、履歴データを使ったテストと最適化のための無料のデモ自動売買ロボットをダウンロードできる唯一のストアです。
アプリ概要と他のカスタマーからのレビューをご覧になり、ターミナルにダウンロードし、購入する前に自動売買ロボットをテストしてください。完全に無料でアプリをテストできるのはMetaTraderマーケットだけです。

取引の機会を逃しています。
- 無料取引アプリ
- 8千を超えるシグナルをコピー
- 金融ニュースで金融マーケットを探索