 MetaTrader 5
 エキスパート
 インディケータ
 ライブラリ
ライブラリ ユーティリティ
 ウィジェット
 ルール
ルール
YouTubeにあるマーケットチュートリアルビデオをご覧ください
ロボットや指標を購入する
仮想ホスティングで
EAを実行
EAを実行
ロボットや指標を購入前にテストする
マーケットで収入を得る
販売のためにプロダクトをプレゼンテーションする方法
MetaTrader 5のためのエキスパートアドバイザーとインディケータ - 469
 自動売買ロボットとインジケータを使用して、外国為替取引の収益性を高めます。 自動売買ロボットを使用すると、取引の開始と終了を自動化でき、インジケータは市場の行動をより正確に予測するのに役立ちます。
このページには、MetaTrader5アプリケーションのカタログが掲載されています。
自動売買ロボットとインジケータを使用して、外国為替取引の収益性を高めます。 自動売買ロボットを使用すると、取引の開始と終了を自動化でき、インジケータは市場の行動をより正確に予測するのに役立ちます。
このページには、MetaTrader5アプリケーションのカタログが掲載されています。 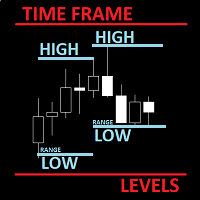
The utility helps to locate in the lower time frames the maximum and minimum of the upper time frame. The length of time frame level line represents the temporal length of the upper time frame. It's possible to OnOff the levels with a button or keys
The indicator draws lines that delimit the upper time frames candle and highlights his high-low price and the pips candle range. How it works:
Firstly . Choose which time frames levels to represent in the lower ones : monthly, weekly, daily

Some professional traders do not enter the market by market orders... they use limit orders... they are creating the market... so how are they profiting with that approach? Lets say GBP-USD is at 1.32545 Program will offer to sell GBP at 1.32548... so 0.03 cents higher... ( advantage is in market spreads in your favor ) if someone takes that trade... EA will try to sell it at marker price of 1.32545 making 0.03 cents profit on that transactions. But that may not happen... Price can go down 0

Go Here for MetaTrader 4 Version I'm a professional trader, and Algorithm developer. For several years I have only used my algorithms privately, and made available only sometimes to a select small group of traders. I will make my algorithms available for a limited time basis on the MQL store. What we have here is a very specific algorithm tuned specifically to scalp the Gold Markets. The default settings are for EURUSD as the MQL Store Validates against EURUSD. With certain aggressive sett
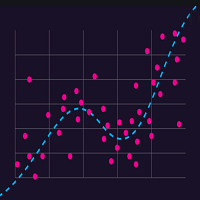
The Regression Channel consists of two lines equidistant above and below the regression trend line. The distance between the channel boundaries and the regression line is equal to the deviation of the maximum closing price from the regression line, only this definition corresponds to the most recent regression points.
The term regression refers to the field of statistics. The center line of the channel is the trend line. To calculate it, the method of least squares is used. The line above the

Powerful EA executes few monthly operations with a high percentage of effectiveness. One trade per week, once you try this method you will be able to modify the batch up according to your expectations. This EA is based on three main indicators, RSI, Stochastic, MACD. Previous price 120 Promoción price 210, 15 copies remaining Next priced 300 USD Backtesting: For best results this technique was created to work from January 2021, under current market conditions it is not recommended years befo

最初、私は Dragon Ultra エキスパートアドバイザーの開発に全力を注ぎました。これは、トレンドに沿った取引と逆方向の取引の両方が可能なインテリジェントなグリッドシステムを構築するために設計されています。Dragon Ultra は強力なロック技術と部分損失回復手法を組み合わせ、バランスの取れた安定した取引エンジンを形成します。システムは継続的なアップデートにより進化し続けます。 Dragon Ultra の利点: フィボナッチグリッドに基づくスマートリカバリーシステム 想定外の市場変動への高い耐性 動的変位補正システム マルチステージ利益確定アルゴリズム エキスパートアドバイザーの進化:
ステージ1:基本グリッドシステム
ステージ2:シンプルマーチンゲールシステム
ステージ3:フィボナッチシステム
ステージ4:フィボナッチ回復システム
ステージ5(最新):ヘッジ付き高度なフィボナッチ回復システム 推奨: 低スプレッドのブローカーを使用 最低入金額:$1000 最低レバレッジ:1:1000 推奨通貨ペア:EURUSD 市場心理:
市場は常にリトレースを伴い、トレーダー心理を

Mega Spikes Max is a specialized indicator for Boom and Crash synthetic indices that generates trading signals with automatic alert notifications. Features The indicator analyzes market conditions using proprietary algorithms and displays buy/sell arrows directly on the chart. It works specifically with Boom and Crash indices on M5 timeframe. Signal generation combines multiple technical analysis methods to identify potential trading opportunities. The system provides two TP levels and SL calcu

The Urgently indicator is designed to quickly determine the situation in the market, reflect the state of the market and signal profitable levels for opening trades. Market conditions change quickly enough, requiring constant calibration of trading strategies. Recommended for use in conjunction with any of the oscillators. The Urgently forex market trend indicator shows the trend direction and entry points. It smooths out price fluctuations when generating a signal by averaging the data and the

MultiPro EAライブ信号:
https://www.mql5.com/en/signals/1295954
FNG MultiPro EAは、カスタムMFI指標に基づいた自動マルチ通貨アドバイザーです。 富の保護のために、各貿易はストップロスを持っており、使用される任意の危険な回復オプションはありません。 あなたがする必要があるのは、1時間TFで以下のチャートにロードすることだけです。
MuiltiProには、必要に応じて使用できるニュースフィルタがあります。 これは、ニュースイベントの前に注文を閉じるか、一時停止することができます。 あなたは、高、中、または低衝撃のニュースイベントのいずれかでニュースをフィルタリングするための選択肢を持って、金曜日に取引を閉じるためのオプ また、任意の時点で開かれているどのように多くのオープン取引を選択することができます。
EAは、単一のチャートからAUDCAD、AUDCHF、AUDNZD、AUDUSD、CADCHF、CADJPY、CHFJPY、EURAUD、EURGBP、EURJPY、EURUSD、GBPJPY、GBPUSD、NZ

This is an expert for netting trading. In it, the grid of pending orders is being set. The Expert Advisor decides by calculation. It is possible to customize the work of the advisor by the hour. Many settings can be viewed in the panels. He displays his solution on the chart in the form of lines. There are only two types of lines. It is possible to use Magic number. It is already configured by default. You can also specify the size of the rate for it in the current currency. You can simultaneou

このインジケーターは、現在の時間枠でより高い時間枠の予測を作成します。色付きのキャンドルの形での視覚化。市場内のプロセスとその規模およびダイナミクスをよりよく理解するのに役立ちます。これらすべてがインスピレーションの源となり、成功する取引戦略を見つけるための正しい道につながる可能性があります。インジケーターはローソク足パターンの検索を簡素化します。異なるパラメーターで複数のインジケーターを有効にして、同時に多くの時間枠を表示することができます。設定では、各方向のキャンドルの色と幅を変更できます。インディケータは、トレーディングアドバイザーと組み合わせてツールとして使用できます。時間枠オプション-現在の時間枠より大きくする必要があります。大きくしないと、インジケーターが起動せず、エラーが報告されます。以下は、さまざまなモードとテスターでの作業方法を示すビデオです。 重要!インジケーターに何も表示されない場合は、時間枠パラメーターが正しく選択されていないか(現在のパラメーターよりも大きい必要があります)、端末に選択した時間枠の履歴がありません。それをロードするには、この時間枠でチャートを
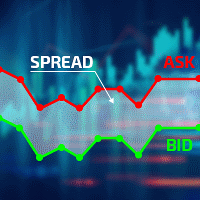
Excellent spread indicator. Reflects the spread on each bar as it is. It should be remembered that the spread is displayed at the time of the bar opening. Therefore, the most correct information will be on the minute bars. Spread is one of the basic forex concepts that any trader should know. If explained clearly, you can describe such an example. The trader buys the EUR / USD pair at the rate of 1.1000. However, he immediately goes into negative territory, for example, by 10 points, as if he bo
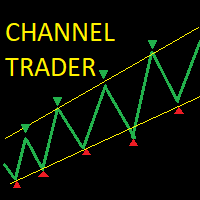
The Auto Channel Trader creates a channel by plotting a line along the high points and low points of the chart, the EA then makes long trades near the bottom of the channel and short trades near the top of the channel. The channel is created by finding high points for the top line and low points for the bottom line, these points are shown with arrows. A line of best fit is then plotted through these points and extended until the end of the chart. The length of the channel is determined by the M
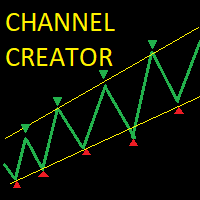
The auto-channel indicator creates a top line and bottom line that encloses a channel within which the symbol has been trading. The channel is created by finding high points for the top line and low points for the bottom line, these points are shown with arrows. A line of best fit is then plotted through these points and extended until the end of the chart. This indicator is useful for trading both within the channel and for breakouts. Inputs: MAPeriod - The moving average period over which the

Trade Panel Osw MT5:プロフェッショナルなリスク管理と取引パネル Trade Panel Osw MT5は、MetaTrader 5用の高速実行および高度な注文管理コンソールです。スキャルピングやデイトレードを最適化するために設計されており、トレーダーはチャート上で直接エクスポージャーを制御し、資金保護を自動化できます。
パネルのパラメータと機能 トレードタブ (Trade) N Orders:実行ボタンを押したときに同時に開くポジション数。 Lot / Type of Lot:エントリーロット。固定ロット(Fixed Lot)、金額リスク(Money Lot)、または残高に対する割合(Percent Lot)から選択します。 SL Points:ポイント単位の損切り距離(0で無効)。 TP / Type of TP:固定ポイントでの利確(TP Points)、または正確なR:R比率を維持するための損切り幅の倍数(TP Risk)での利確。 Comment:各注文に付与されるカスタムコメント。 Visual:チャート上のラインで、エントリー、損切り、利確レベルを

Индикатор с уникальным авторским алгоритмом определения направления тренда. Показывает лучшие результаты определения тренда на любых валютных парах, акциях, криптовалюте без перерисовки результата. Имеет встроенную статистику, что поможет сразу определить прибыльность текущей пары и таймфрейма. Использует паттерны Price action в связке с уникальным алгоритмом фильтрации. Подходит как новичкам так и профессионалам для всех видов торговли. Как выбрать прибыльный таймфрейм и оптимизировать индикато

皆さん、こんにちは、 私はÖzgürです。外国為替について約10年の知識があり、この商品は取引に最適なオプションです。 Agry Birdsは、グリッドアルゴリズムを備えたユニークな取引システムです。 また、特別なトレーリングストップやDDリダクション機能など、私がコーディングした独自の戦略もあります。 現在、実際のアカウントでAgryBirdsをテストしています。 私もあなたのようなトレーダーなので、しばらくすると素晴らしいロボットになると思います。 現在の価格はこのEAの通常価格ではなく、1週間後の価格は59米ドルになります。 何かについて私に何かを尋ねることを躊躇しないでください。 良い一日を過ごしてください。
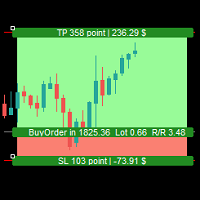
Simple Assistant for Trading
Precise Risk Management in each
Automatic Money Management Visual Trading Open Position Management User friendly and practical
during 15 years of considerable experience in stock market, we have dealt with many professional traders who have been used profitable and unrivalled methods in this market but failed in the long term. The reason is undoubtedly the lack of standard in their manner during their trade. Standard means the accurate repetition of a process….

产品简介: 本工具是一个简单的交易面板,主要用于复盘交易训练。您可以在策略测试环境下根据自己的交易策略进行交易练习。 这个工具主要适用单向交易训练,不适合进行对冲交易训练。
使用方法: 在策略测试中选择本EA,并进行货币兑、图表周期、复盘时间段等相关参数设置。 点击“开始”按钮后,会显示交易面板。 您可以点击“+”、“-”来调整下单时的仓位大小,每点击一次,变化0.01。 BUY按钮用来建立多头仓位。 SELL按钮用来建立空头仓位。 CLOSE按钮用来平仓,如果持有多个仓位,会平仓“报价”靠前的订单。
均线指标: 这个工具提供两条均线指标的显示支持。 在“输入”选项卡中,可以设置均线的显示与否,以及均线的周期参数。
自定义指标: 这个工具还提供一个自定义指标的显示设置。 在“输入”选项卡中,可以设置自定义指标的显示与否,以及它的路径参数。

1. What is this Rising volatility and falling volatility are not the same, whether it is academic research or actual testing has shown this point. The original ATR indicator is calculated by putting up and down fluctuations together. This indicator is to calculate separately the upward volatility and the downward volatility, which can better help you study the market.
2. Indicator description There are two modes for the calculation of this indicator, as shown in the fo

Hello, boys and girls!
Script allows you either to quickly save opened charts and then close all charts opened by visual tester mode or just faster close all charts. Feel free to take a look at video manual about how to use this script on my YouTube channel. Also, feel free to join my telegram channel , where time to time I publish some exclusive stuffs. Feel free to leave feedback and thoughts how to improve this script - I'd highly appreciate that. All the best.

Customized Copy is a Multi-Terminal visual trade copying utility that supports Metatrader4 and Metatrader5 for Trade Copying.
You can activate EA on 10 different PCs/VPS. On each PC/VPS can install on Unlimited Terminals.
Specifications :
Real Time, Multi Terminal - Multi Account - MT4/MT5 trade copying (support over 50 accounts at same time) All settings are input visually. Visual display and modify of copy map and network Each copy path can be used with different settings

価格チャネルは、現在の市場状況を分析するためのトレーダーの主要なツールです。その助けを借りて、あなたは将来の価格行動をうまく予測することができますが、利益を上げる主な要因はタイムリーな決定です。モニターを常に見ることは不可能であるため、これはしばしば問題になります。
このインジケーターは、異なる期間(高速と低速)の2つのトレンドチャネルを自動的に構築および更新します。傾向は線形回帰を使用して決定されます。自分で作成できるカスタムチャネルを1つ使用することもできます。
インジケータは、チャネルをパーセンテージゾーンに分割します。関心のある領域をパーセンテージで指定できます。価格がこのゾーンに達すると、通知が届きます。
このインジケーターの興味深い機能は、発散シグナルの受信です。これは、価格が異なる期間の反対のチャネルゾーンにある場合です。これは強いシグナルです。
「shift」パラメータは、チャネルを構築するときのスモールフォワードを定義します。
次の種類の通知を使用できます:電子メール、プッシュ通知、アラート、および任意のサウンドをwav形式で再生します。

FXC Trade AssistanT MT5
This trading software will help you in manual trading. You can use it for open and close positions in many forms. The EA offers you lot sizeing, stop management methods and other usefull tools using with its control panel.
New in v1.13: Ultra-Fast CLOSE operation can close over 100 trades/second (Only MT5) New SETUP panels: Control, Chart, Msg., SFX, Advanced Added SFX sound profiles
Zero-Point Calculation with Swap & Commission Can handle foreign trades
New Info data: St
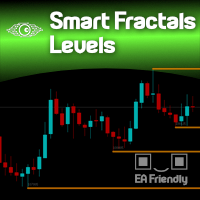
Support & Resistance taken to the next level. The Smart Fractals Levels indicator is based on Bill Williams' theory of identifying Support & Resistance levels through the use of the so-called "fractals". The difference between common Support and Resistance regions drawn on chart and the Smart Fractals Levels is that only NEW and untouched levels will still stay drawn on the chart (if you decide so), and also based on your own set of rules, totally configurable from the "settings" menu of the ind

Golden_Star MT5 は、プロのトレーダーのグループによって開発されたMT5プラットフォームのプロのトレンドインジケーターです。 その作業のアルゴリズムは、元の著者の方法に基づいています。これにより、潜在的なトレンド反転ポイントを高い確率で見つけ、トレンド形成の開始時に市場に参入するためのシグナルを受信できます。 このインジケーターは、外国為替で金、暗号通貨、通貨ペアを処理するのに適しています。 アラートシステム(アラート、電子メール、モバイル通知)は、複数の取引商品を同時に監視するのに役立ちます。 チャートにインジケーターをインストールするだけで、インジケーター信号が表示されるとアラートがトリガーされます。 私たちのアラートシステムを使用すると、ポジションを開くためのシグナルを見逃すことはありません! Golden Starインジケーターを使用して取引するのは非常に簡単です。インジケーターラインが緑色の場合、買いポジションを開きます。 インジケーターラインが赤の場合は、売りポジションを開きます。
このインジケーターを購入すると、次のようになります。
優れたインジケーター信

This indicator shows supports and resistences calculated form historical data when market was swing. When market was swing ? When ADX was below 25 for some bars. In fact market can be considered without a trend. I mean and suggest timeframes H4 and Daily. Using that lines in the present you see resistance and support. More lines are distant and best is possible profit. Every ADX parameters can be set, so colors, swing market bars number.
I am available to get feedback or modify code. Thanks Ale

移動平均 (MA) インジケーターのマルチ通貨およびマルチタイムフレームの変更。ダッシュボードでは、インジケーターの現在の状態 (Fast MA と Slow MA のブレイクアウトとタッチ (価格別)、および MA ライン同士の交差 (移動平均クロスオーバー)) を確認できます。パラメーターでは、任意の通貨とタイムフレームを指定できます。また、インジケーターは、価格がラインに触れたことやラインが交差したことについて通知を送信できます。ピリオド付きのセルをクリックすると、このシンボルと期間が開きます。これは MTF スキャナーです。チャート上で複数のダッシュボードを実行できます。
インジケーターは、現在のチャートに Fast MA と Slow MA ラインを表示します。チャートの MA タイムフレームを選択し、他のタイムフレーム (MTF MA) から MA を監視できます。2 セットの MA のホットキーは、デフォルトでは「1」と「2」です。
ダッシュボードをチャートから非表示にするキーは、デフォルトでは「D」です.
パラメーター Fast MA Averaging pe

Clear Dom
This Indicator shows a pressure color box based on depth of market of the current symbol. Notice that it only works when book information is received.
You decide weather you want or not to display higher (ask) and lower (bid) levels of book.
The proportion ratio is calculated using volumes read from the book. You can read the actual pressure in the market any time.
Indicator parameters: color_Ask -> ASK box color and ASK value line color color_Bid -> BID box color and BID value li
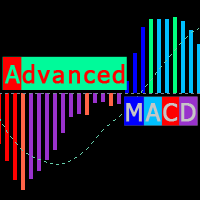
Modified MACD, for technical analysis of charts, with color backlight of histogram signals. The indicator highlights, the direction of the histogram movement, the change in the direction of the histogram movement, the histogram peaks, the interaction of the histogram and the signal curve. Also, the indicator makes it easier to find convergences / divergences between bars and the histogram (which serve as a powerful signal in some trading systems using the MACD indicator). Color designation of Ad

Rediscover trading. The future of Forex is intuitive hybrids. Hello, my name is Szymon, I am a professional algorithm developer for trading on financial markets forex. Working experience in finance and programming for more than 10 years. I specialize in grid systems and martingale. Black Horse EA is an automated forex robot (this is not your usual grid or martingale). This EA trades based on the breakout of price levels (according to the mathematical algorithm, it determines the area of a rang
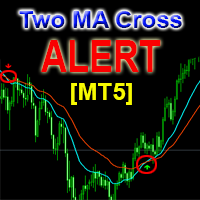
This is a support tool that will notify you when a fast MA (Moving Average) Line crosses a slow MA Line, you can choose any fast MA Line and slow MA Line by parameters in input tab The Indicator will draw a red arrow where fast MA line crosses DOWN slow MA line and it will draw a green arrow where fast MA line crosses UP slow MA line There are 3 Alert methods : Pop Up Alert, Send Email or Notification You can choose true or false to use or not for any Alert method in input tab You can choose Al

Join Deriv link on profile>>>
This is new Robot which created by Moving Average... There is things to Consider before you buy or rent this Robot, I listed down here so that you can read before you purchase this Robot 1; Not perfect 100% because you can make the huge profit but sometimes you can make a little loss i can say Profit 70% and losses 30%. 2; Use setup which provided by developer not otherwise. 3;Use lower timeframe, 1,5 Minute recommended. 4;You can deposit $50 and above. 5;Backte
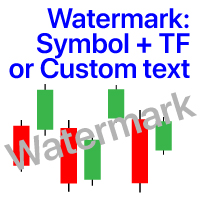
チャート上の透かし:シンボル+時間枠/または独自のテキスト 私の#1ユーティリティ 66+機能が含まれています| ご質問がある場合は私に連絡 インジケータの設定では、次の設定を行うことができます: フォントサイズ; テキストの色; フォント名; ポジション:
1=左上;
2=右上;
3=左下;
4=右下;
5=センター; 現在の時間枠を表示:オン/オフ; 削除するシンボルの接頭辞(n_audcad-->AUDCAD); 削除するシンボルのサフィックス(USD CAD pro-->USD CAD); カスタムテキストを表示:有効にすると、以下に指定された独自のテキストが表示されます: あなた自身の透かし; 私の#1ユーティリティ 66+機能が含まれています| ご質問がある場合は私に連絡

Dear friend, I'm glad you're interested in the results of my work and you want to understand how to use this tool better. Here I will try to explain in detail and clearly what works and how to do to set everything up, as well as to get pleasure and profit from the results of my labors. If you liked it, I'll be really happy to see the positive feedback on the Market:)
Currency pairs: EURUSD, GBPUSD - they are the main ones and give good profits right now! (USDJPY, USDCHF, AUDUSD, USDCAD on req

Make your Trailing Stop, Take Profit, Breakeven, and Stop Loss levels invisible to the broker!
STEALTH MODE Virtual Trailing Stop Virtual Take Profit Virtual Breakeven Virtual Stop Loss Virtual 2-levels Trailing Stop Virtual Trailing Take Profit Virtual Lifetime of Orders Setting levels by dragging labels on the chart (Drag&Drop)
TRADING PANEL Operate faster with orders/positions [1] Change Order lot [2] Place BUY order [3] Place SELL order [4] Place BUY LIMIT order [5] Place SE

The indicator connects the price in a cyclical-wave relationship. Thus, all intersection points will be optimal points at which the movement changes taking into account the indicator period. Crossing points can be used as potential market reversal points. But do not forget that the approach must be complex, the indicator signals require additional information to enter the market.
Suitable for forex, futures and binary options without redrawing. It gives a lot of signals, which requires additio

The Expert Advisor analyzes tick micro-signals and determines the direction to open a position. Note: The EA can only be optimized and tested on all ticks! Be sure to optimize, the limits for optimization are shown in the screenshot. The EA uses netting system of position accounting (one symbol can have only one position). The EA does not work with independent position accounting (hedging, when there can be multiple positions per symbol). Account without hedging should be selected for testing o

これは、フィボナッチから派生したハーモニックパターンのユーザーが利用できる最も完全なツールです。
完全にカスタマイズ可能:レベル、色、線種、太さ。
研究に応じて使用されるフィボナッチレベルを選択してください。
デフォルトでは、ツールには、尊重されることが証明されているフィボナッチレベルがすでにありますが、ユーザーはこれを自由に変更できます。
フィボナッチレベル、長方形(塗りつぶしありまたは塗りつぶしなし)、および境界のある水平線の描画方法の色、線種、太さを選択します。
フィボナッチ撤回:4セット(最大25レベル、最大26レベル、最大27レベル、最大28レベル)、それぞれ異なるショートカットで実行可能。
フィボナッチプロジェクション:最大10レベルの1セットで、特定のショートカットで実行できます。
長方形:長方形が自動的にプロットされる間隔を定義し、特定のショートカットで実行可能にします。
制限された水平線、特定のショートカットで実行可能。
ショートカットを修正しました:プロットされたすべてのオブジェクトを削除し、オブジェクトをさかのぼって削除し、長方形のみを削除し、
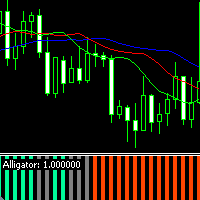
The modified Alligator indicator is designed as an oscillator. Facilitates the analysis of the Alligator indicator values by signaling the trader about market changes using a colored histogram. Histogram color values
Medium Spring Green - uptrend Orange Red - downtrend Gray - lateral movement (flat) Parameter values jaw_period - jaw period teeth_period - teeth period lips_period - lips period jaw_shift - jaw shift teeth_shift - teeth shift lips_shift - lips shift ma_method - method for calculat
The Expert Advisor trades in the direction of the current trend, the algorithm is based on calculating the width of the trading range for a given interval and assessing price movements on short time intervals. If the impulse value exceeds a specified percentage of the trading range, a position is opened in the direction of the trend. The impulses are also additionally filtered using a special technique. When evaluating impulses, the tick history inside the bar is not used . The algorithm uses ex
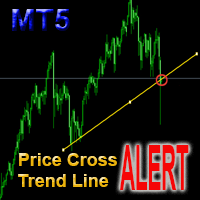
This is a support tool that will notify you when the price crosses a trend line, you can draw any trend line by manual, and you can change or drag it on chart in working time This tool will automatically update the new location of the trend line to alert you How to use: after added it on chart, you will draw a trend line and set name of the trend line same as in input of the tool (the parameter LineName ) There are 3 notification methods : Pop Up Alert, Send Email or Notification You can choose

Phenomenon is a new generation Expert Advisor that has incorporated the best automated trading developments of recent years. Designed for trading major currency pairs, it has protection against failures - when the connection is restored, the advisor will continue to work with its orders. Fully automated Expert Advisor. The robot controls the volume of trading positions, slippage, spread, maintains and protects open orders, can work with a deposit of any size. The Expert Advisor uses a number of

The intelligent algorithm of the Ikiru indicator accurately detects the trend, filters out market noise and generates input signals and exit levels. Functions with advanced statistical calculation rules improve the overall performance of this indicator. A convenient indicator for technical analysis and is suitable for trading binary options. All entry points are ideally optimal points at which movement changes. Entry points should be used as potential market reversal points.
It is a hybrid tre

Это классический вариант реализации экспоненциальной скользящей средней с коррекций ошибки, какой используется в индикаторах DEMA и TEMA. Соответственно названию, глубина коррекции ошибки увеличена до 33. Индикатор оптимизирован. Потребляет минимально возможные ресурсы. Достаточно быстр, учитывая объёмность вычислений. Может накладываться на другие индикаторы. Как и обычные скользящие средние, nEma_33 не перерисовывается (за исключением нулевого бара). Требуется история > Период*33*33. Согласно

DYJ TRADINGVIEW EA は、DYJTRADINGVIEWインジケーターに基づく戦略です。
1日の最大注文制限3、ロング注文制限2、ショート注文制限1などのカスタム取引プランを編集できます。
トランザクションが完了すると、EAは自動的に削除されます。
ブーム1000インデックスの品種に適しており、あらゆるデリバティブおよび外国為替市場の品種と互換性があります。
ブーム1000インデックスのパラメータ設定は、製品レビューでダウンロードできます。
最低保証金-100米ドル(高リスクモード)。 推奨されるデプシット-1000米ドル以上(通常モード)。 推奨される記号-ブーム1000インデックス。
Parameters:
InpMagic-->123456 InpPairs-->GBPUSD,EURUSD,USDJPY,USDCHF,XAUUSD,USDCAD,GBPJPY,EURJPY,EURGBP,AUDUSD,NZDUSD
InpIsDisplaySignalWindows-->true InpMaxOpenTrades -->3 InpMaxLong

This tool has been designed for macroeconomic investors. It allows you to observe and operate currency indices that are more uncorrelated instruments than currencies, that do not share the same noise level as pairs and are totally uncorrelated with each other.
CurrencyTrader is a tool that allows you to trade the DXY, EURX, JPYX, GBPX, CADX, AUDX, CHFX and NZDX currency indices
Currently I use this tool for my swintrading in darwinex MACRO for MetaTrader 5 - Antonio Renteria Arce
I have left
53% OFF until December 31 (Normal price $125)! Don't miss the opportunity to have this invaluable tool!
This is a totally automated multi timeframe support and resistance levels finder on every MT5 chart. No manual work! Just drop this indicator on a chart and you will have the S/R levels always up to date. It is very convenient and helps the trader to anticipate possible stalls and reversions in price movements. The levels are displayed as lines and each timeframe has a different color. The i
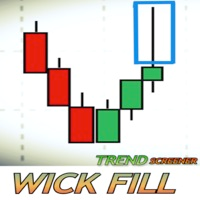
トレーディングにおけるウィックとは何ですか?このスクリーナーはどのように機能するのですか? ローソク足におけるウィックは、価格の拒否反応を反映しています。このスクリーナーは埋められる大きな可能性を持つウィックを識別しようとしています。このスクリーナーは、トレンド市場で発生するウィックに焦点を合わせています。
このスクリーナーは、ライブで取引されている潜在的なウィックの全体像を提供するダッシュボードを表示します。それは、時間枠によって整理されたすべてのペア/インスツルメンツを示しています。買いのチャンスは「UP-W」と名付けられます。彼らはダッシュボード上で緑色に表示され、売りの機会は、''DN-W''と名付けられ、赤で表示されます。トレーダーは画面に表示されたダッシュボード上で希望のウィック機会をクリックする必要があり、スクリーナーはその特定のトレードを表示します。スクリーナーは、トレーダーが選択したインプットに基づき、機会を表示します。金やUS30などの商品は、通常、ブローカーによって契約サイズが異なることに注意してください。同じコントラクトサイズのペアまたは商品を使用するように

This is a fully automatic system for multi-currency trading (17 currency pairs) on the Forex market. The trading system itself finds the most powerful Price Action patterns in a fully automatic mode! Trading is conducted on 17 currency pairs at the same time and uses timeframes M5. Each pair has a stop loss, take profit, breakeven and trailing stop. Real m onitoring : https://www.mql5.com/ru/signals/2238618
Benefits Partial closure to reduce the load on the deposit. Determines the direction o

This indicator recognizes all support and resistance levels. A number of unique high-performance techniques have been applied, which made the existence of this indicator possible.
All formed channels are naturally visible: horizontal linear linear parabolic cubic (Polynomial 3 degrees - Wave) This is due to a bundle of approximating channels. The formed channels form "standing waves" in a hierarchical sequence. Thus, all support and resistance levels are visible.
All parameter management is i
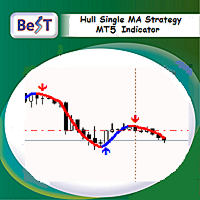
BeST_Hull Single MA Strategy is an Metatrader Indicator based on the famous indicator Hull Mov.Average . This indicator can display the Single HMA Strategy of just 1 Hull MAvg. It uses added internal filters locating the most likely Entries while it can be used as a standalone system or as an add-on to other ones.
Generally the Hull Moving Average (HMA - developed by Alan Hull) is a directional trend indicator . It captures the current state of the market and uses recent price action to determin
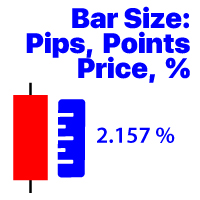
選択した時間枠の最後に閉じたバーの変更を表示します 価格価値; パーセンテージ値(%); ピップス; マーケットポイント; 私の#1アシスタント : 66+機能が含まれています| ご質問がある場合は私に連絡してください プログラムファイルは" Indicators "ディレクトリに配置する必要があります。
インジケータの設定では、次の設定を行うことができます: フォントサイズ; テキストの色; チャート上の配置:左下または右下隅; お使いのコンピュータの現在の時刻の表示をオン/オフにします; 計算のための時間枠(あなたは現在を設定することができます:TFが変更されると値が変更されます); 計算タイプ:
1=価格値;
2=パーセンテージ値(%);
3=ピップ単位のサイズ;
4=ポイント単位のサイズ; 値の計算方法:
true:高-低の値が使用されます;
false:Open-Close値が使用されます;

Price reach indicator. It also serves as the perfect term for supports and resistance. I use it in two experts. The basic tool for professional trading. The indicator analyzes the last 500 bar and uses this to determine the levels ( but it doesn't predict the future ) . Personally, I use it on TF H1. It is very simple. Four lines on chart and that's all. Only two input parameters. Thousands of indicators. Why this? Is good ? No! Is very good. Please test the indicator prior to purchasing. You

Monitoring real accounts https://www.mql5.com/en/users/robotstroi/seller Ready-made files with settings are provided Let's take a look at the trading robot designer's capabilities, grouping them into blocks for clarity. 1. Ready-made solutions vs. developing your own strategies
Ready-made strategies: Instant start. No need to waste time on development—you can start automated trading right away. Proven algorithms. Strategies have been tested on historical data. Reliability. The risk of code error

MT 5 高度ストチャスティクスロボットへようこそ
単にあなたが望む2ストカスティックフィルタを設定し、ロボットはあなたのために仕事をします。
顔立ち:
- マジックナンバー
- スプレッドフィルター
- 利益を取る
- ストップロス
- バーシフト
- 反対側のシグナルで終了
- フィルター (調整可能)
- トレーリング
- マーチンゲール
そしてより多くの。
MT 5 高度ストチャスティクスロボットへようこそ
単にあなたが望む2ストカスティックフィルタを設定し、ロボットはあなたのために仕事をします。
顔立ち:
- マジックナンバー
- スプレッドフィルター
- 利益を取る
- ストップロス
- バーシフト
- 反対側のシグナルで終了
- フィルター (調整可能)
- トレーリン

This EA trades according to your trendline. It can trade in several modes: will open only one trade and then be stopped trades only in the direction of the trendline opens more trades after each touch with the trendline trades in both directions it can place a pending order or open a market order See the screenshots below for a better understanding of its features.
Unfortunately, it is not possible to draw your own trend line in the MT5 strategy tester. This EA will draw its own trendline for t

-ウィックフィルトレンドの考え方
市場のボラティリティが高い時、ローソク足はその移動の途中で芯を作る傾向があります。ローソク足の芯は、価格の反発を反映しています。これらのウィックは、その方向に押す巨大なボリュームを持っているので、時間の大半は満たされています。Wick Fill Trendは、トレンド相場に焦点を当て、そのチャンスをスキャンします。
エントリーポイント、利益確定、損切りなどのライブシグナルを表示する成功率シミュレーターダッシュボードを備えています。この成功率シミュレーターはバックテストとして使用することができ、過去にどのインプットがより良い利益を上げたかを確認することができます。この成功率シミュレーターは、バックテストとして使用することができ、過去にどの入力がより良い利益を上げたかを確認することができます。
-インプット
-トレンドウィック。この入力は、インディケータがスキャンしなければならないウィックの大きさを決定します。この値は%で測定されます。デフォルトでは20%です。
-シグナル数 シグナル数:成功率シミュレーターでスキャンするシグナルの数を指定しま
Info: marcobarbosabots
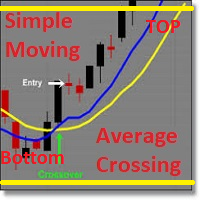
This EA automates order opening by crossing two simple moving averages. If price is on a top region, a sell order is placed. Othewise, if price is on the bottom region, a buy order is placed. Only one order at a time. No martingale and no grid system. This EA also has the option to allow it to place or not orders on the market. The value of moving averages, lot, takeprofit, stoploss, top price, bottom price and width price region are configurable, and they do not allow

Ace Scalper EA works on the GBPUSD, EURGBP, USDCHF, EURCHF . Timeframe M5. The strategy is based on the search of price fluctuations for the quiet period of the Asian session. During this period, there is usually no strong unpredictable price movements, which allows relatively safe scalping, with the average trade duration 1 hour. Uses tight Stop Loss, which provides deposit protection in the event of adverse developments in the market. EA does not use dangerous methods of trading that can destr
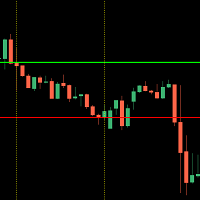
This indicator shows you the higher high and lower low of a certain period of time.
It is easy to use - select your desired time frame (current, 15Min, 1H, 1D) and the corresponding number of candles.
The indicator measures the highest and lowest point within the specified range and automatically draws the two corresponding lines.
The design of the lines is up to you!
Should the trend break one of the drawn lines with a closed candle, a message will be sent to you by the built-in alarm funct
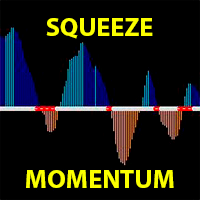
TTM Squeeze Momentum is a volatility and momentum indicator introduced by John Carter of Trade the Markets (now Simpler Trading), which capitalizes on the tendency for price to break out strongly after consolidating in a tight trading range.
This derivative Squeeze Momentum indicator attempts to identify periods of consolidation in a market. In general, the market is either in a period of quiet consolidation or vertical price discovery. By identifying these calm periods, one has a better oppor

**ブローカー敏感なので、最適化してください
ライブ信号:
https://www.mql5.com/en/signals/1285219
https://www.mql5.com/en/signals/1278508
ニューストレーダーは、自動ニュース取引プログラムです。 これは、保留中のストップ売買注文を現在の価格の上下に配置し、ニュースイベントの時間までそれらを変更します。
注文がライブになると、オプションが有効になっている場合、それは反対の注文をキャンセルし、トレイルまたは偶数を破るためにストップロス
アドレスを追加する必要があります' http://ec.forexprostools.com/'許可されたURLタブのリスト'ツール/オプション/アドバイザ'
注意してください! 一部のブローカーは、価格をギャップし、要求された価格から遠くに埋めます。
**EURUSD30分の時間枠で最高の作品
**設定ファイルはコメント欄にあります
**バックテストのために"ニュース時間"が15:30であることを確認してくださいが、ライブ取引時には"Auto=0

通貨ストレングストレードパネルEAMT5は、初心者またはエキスパートトレーダーにとって革新的なソリューションです。通貨の強さの概念は、価格アクションと組み合わされ、8つの主要通貨の通常の28の組み合わせを除いて、任意のシンボル/ペアに適用できるため、まったく新しいレベルになります。つまり、すべての通貨、商品、暗号(インデックスではない)を含む、任意のペアの長所または短所をトレードできます。複雑な強さを解読することなく、ペアの2つの部分の強さ/弱さのバランスを視覚的に知らせる色付きのバーを使用することで、16/32シンボルを一目で明確に把握できる画期的な製品です。他の従来の通貨強度ソリューションと同様に、線またはヒストグラム。
通貨の強さのトレードパネルEAMT5は、MT5で見つけることができる最も簡単で使いやすいトレードパネルでもあります。追加のウィンドウやパネルを開く必要なしに、すべてのオプションと機能が1つのサーフェスにあります。これは、注文管理、リスク計算、部分閉鎖、アカウント保護ユーティリティのすべてを1つにまとめた、非常に便利なインターフェースです。 Currency S

MT5の通貨強度インジケーター は、初心者またはエキスパートトレーダーにとって革新的なソリューションです!通貨の強さの概念は、価格アクションと組み合わされ、8つの主要通貨の通常の28の組み合わせを除いて、任意のシンボル/ペアに適用できるため、まったく新しいレベルになります。つまり、すべての通貨、メジャー、マイナー、エキゾチック、コモディティ、クリプト(インデックスではない)を含む、任意のペアの長所または短所をトレードできます。これは、複雑な強度線を解読したり、複雑な強度線を解読したりすることなく、任意のペアの2つの部分の強度/弱さのバランスを視覚的に通知する色付きのバーを使用することにより、32個のシンボルを一目で明確に把握できる画期的な製品です。他の従来の通貨強度ソリューションと同様に、ヒストグラム。
MT5の通貨強度インジケーター は、あなたが注目し、最も取引したいペアを追加することにより、あなたの個人的な好みに合わせて32のシンボルボタンを構成するオプションを提供します。このように、あなたは一目であなたのチャート上で現在の市場の全体像を見ることができるので、あなたは機会を逃す

Looking for a quality pivot point indicator? So Prosecution is what you need! To identify pivot points, the Prosecution indicator analyzes many conditions, as the aggregate analysis provides a more accurate picture of the market situation.
What are pivot points? Pivot point analysis is often used in conjunction with the calculation of support and resistance levels, as is the case with trend line analysis. When analyzing pivot points, the first support and resistance levels are calculated u

Trend Everest MT5 indicator is a trend following indicator that aids in decision making. It is based on the calculation of ATR that assist and the average hull. A key issue is that the Trend Everest MT5 nominee does not repaint, so you can backtest with greater confidence. When it is Green, UpTrend When it is a Red downtrend. Not that the Market is fractal, so the longer the graphic time, the greater its degree of assertiveness.
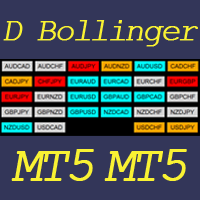
This indicator helps to visualize the Bollinger Band status of 28 pairs. With the feature of color panel, alert, and notification features, user can catch the potential Bollinger Bounce opportunities from 28 main pairs on one Dashboard quickly. Dashboard Bollinger Band is an intuitive and handy graphic tool to help you to monitor all 28 pairs and provide trading signals based on the Bollinger Bounce Rules (Overbought/Oversold and Bollinger Band Cross).
Color legend clrOrange: price is above the
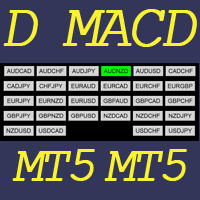
This indicator helps to visualize the MACD status of 28 pairs. With the feature of color panel, alert, and notification features, user can catch the potential buy and sell opportunities when the 28 main pairs’ fast EMA cross the slow EMA on one Dashboard quickly. Dashboard MACD is an intuitive and handy graphic tool to help you to monitor all 28 pairs and provide trading signals based on the MACD Rules (Fast EMA Cross Slow).
Color legend clrRed: MACD fast EMA down cross MACD slow EAM and MACD f
MetaTraderマーケットが取引戦略とテクニカル指標を販売するための最適な場所である理由をご存じですか?宣伝もソフトウェア保護も必要なく、支払いのトラブルもないことです。これらはすべて、MetaTraderマーケットで提供されます。

取引の機会を逃しています。
- 無料取引アプリ
- 8千を超えるシグナルをコピー
- 金融ニュースで金融マーケットを探索