 MetaTrader 5
 エキスパート
 インディケータ
 ライブラリ
 ユーティリティ
 ウィジェット
 ルール
YouTubeにあるマーケットチュートリアルビデオをご覧ください
ロボットや指標を購入する
仮想ホスティングで
EAを実行
EAを実行
ロボットや指標を購入前にテストする
マーケットで収入を得る
販売のためにプロダクトをプレゼンテーションする方法
MetaTrader 5のための新しいエキスパートアドバイザーとインディケータ - 501
 自動売買ロボットとインジケータを使用して、外国為替取引の収益性を高めます。 自動売買ロボットを使用すると、取引の開始と終了を自動化でき、インジケータは市場の行動をより正確に予測するのに役立ちます。
このページには、MetaTrader5アプリケーションのカタログが掲載されています。

Description:
The Wall of Worry indicator allows you to assess market sentiment and possible reversals. The indicator represents three lines that are displayed in a separate window.
Black line (trend) - the amount of volumes in the candle body.
Red line (bears) - the amount of volumes in the upper shadow of the candlestick.
Blue line (bulls) - the amount of volumes in the lower shadow of the candle.
The idea is based on "Wall of Worry" - this is the periodic tendency of financial markets to
An indicator of patterns #52 and #53 ("Falling/rising wedges") from Encyclopedia of Chart Patterns by Thomas N. Bulkowski.
Parameters: Alerts - show alert when an arrow appears Push - send a push notification when an arrow appears (requires configuration in the terminal) PeriodBars - indicator period K - an additional parameter that influences the accuracy of pattern shape recognition ArrowType - a symbol from 1 to 17 ArrowVShift - vertical shift of arrows in pixels ShowLevels - show lines C
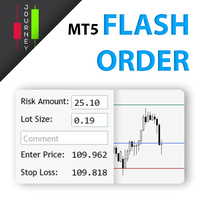
Trading has never been easier! Let's check this out! MT4 version: https://www.mql5.com/en/market/product/72118 The story: How I boost up my trading speed without any "Invalid SL or TP" error
NOW ALL YOU NEED TO DO IS Drag the lines Press Open Order button Enjoy! With this tool, you will no longer have to enter prices manually, which can cause many mistakes and you could miss the trade! From the board, we have: Risk Amount : the risk you want to apply for your trade Risk Unit : USD : If sele
Trailing Stops Pro is a highly advanced trailing stop program. It comes with 12 different trailing stops and helps you to manage your trade and stops easily. You can specify a trail start, that means the trailing stop will be started after your positions has reached the selected profit points. Additionally you can set a trail distance as well as activate and deactivate the trailing stop for each position separately. For your convenience the program has a very easy to use app panel. For a detaile
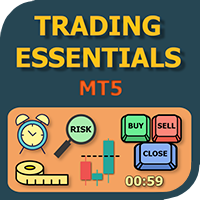
The small control panel which includes an essential set of tools for major trading styles.
Key advantages: The most important tools for trading in one small app. Do not block your graph with large panels. Trading Essentials (TE) uses minimal design, can be dragged and shows important trading parameters. Quickly change trading parameters by using mouse wheel, keyboard, or +/- buttons on the panel. Did you know that, using 3:1 profit/loss ratio in order to breakeven, you have to be only 25% rig

Aion is a advanced trade strategy based on engulfing signal. To determine the trend, it uses moving averages and check prices last bars. The Expert Advisor opens and closes trades on a "closed bar", in backtesting you can use "Open prices only".
Offer price: $99 (6 of 10 copies left at this price) Next price $199
Usable currency pairs: Any currency pair and Usable timeframes: Any timeframe. Due to the many setting options, there are good paramter settings in each pair, which can be found via t

A indicator to show saturation in buying or selling With fast and complex mathematical calculations Easily find saturation points for buying or selling Can be used in all symbols and time frames with many signals Can be combined with different indicators and different time frames With simple settings and simple working methods
Features: Can be used on all symbols Can be used in all time frames Can be used in all markets (Forex, stock, etc.) Large number of signals Same performance on all time
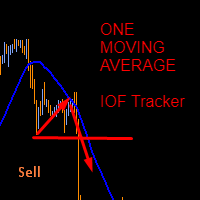
This indicator was created based on posts from forex factory thread titled There is no Magic Moving Average - You need only one - by @andose2 a.k.a Andrei Florin. If you want to know about how to use this trading strategy please go and read https://www.forexfactory.com/thread/691864-there-is-no-magic-moving-average-you.
Note: Below are extracts some of the posts .
Estabilish a trend, based on Market Cycles, then go only long in the Markup Phase and only short in the Decline phase , st
FREE
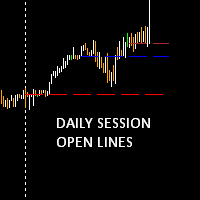
Daily session open lines shows the traders three important trading session opens. By default it is set up to show you: Zero GMT Open Line London Open Session Line New York Open Session Line The default times are set according to GMT+2 and as such you are able to change and customise according to your specific time zone. The Indicator is usefull specially for the trader who trades the London and NewYork sessions.
FREE
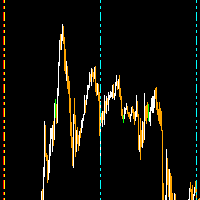
The daily custom period seperator indicator allows you to draw period seperators for your lower time frame charts H1 and below. The period seperator gives you options to set different colors for: Weekend - saturday/sunday Monday and Friday Midweek - Tuesday to Thursday.
By default the indicator plots the period seperator line at 00:00 hours for the last 10 days.
Use Cases: The indicator can be used as a colourful alternative period seperator to the default MT5 period seperator. For those tha
FREE
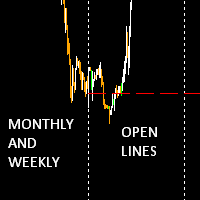
The Monthly Weekly Open Line is an indicator that plots: The current month open line that will extend till the last week on the month. Weekly lines that span the look back days period that you have set . Each line will extend from the respective weekly Monday zero GMT till friday of the respective week. Monthly and Weekly open lines can be used to build very powerfull anc consistent trading strategies. They act as natural S/R price barriers.
FREE
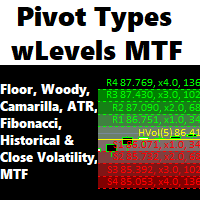
Fully featured Pivots and Levels indicator Pivots: Floor (normal), Woody, Camarilla, Fibonacci Levels: ATR, Historical Volatility with standard deviations, Close Price Volatility with standard deviations
Features: - 4 +/- levels
- MTF, pivots/levels based on Daily, Weekly, 4hr or even 15min - Hour and minute time offset
- Texts with prices and pip distances to central pivot/level - Inputs for Camarilla/Fibonacci/ATR/Volatility levels
- Alerts, popup, push, email, sound, live or completed candle
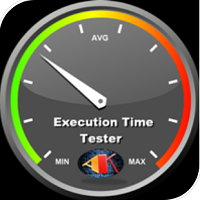
This Expert Advisor measures the broker execution time in milliseconds. Every 10 seconds (Refresh Seconds) , the EA opens a buy stop order far away from current price (1.5 x Ask), then modifies the (price, stop loss and take profit) of the created order by 5 pips then deletes it immediately.
Inputs Refresh Seconds: Number of seconds for each re-test, default 10 seconds.
Display Last: Last Execution time Min: Fastest execution time Max: Slowest Maximum execution time Avg: Average exec
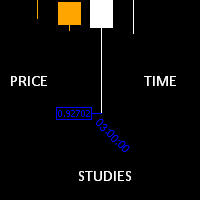
Time and Price Fractal Studies is an indicator that will help you identify certain patterns that tend to repeat themseleves at certail times of the day or at certain prices. It is used to study Fractal Highs ad Lows in relation to time and price. You will get to answer certail questions like: At what time of day does this market usually turn around. At what price does the market turn. Is it at round numbers etc.
FREE

True Days is a tool designed specifically for the trader who wants to catch intraday volatility in price charts. True day makes it easier for the trader to avoid trading in the dead zone - a period in time where markets are considered dead or non volatile. The trader can concentrate on finding opportunities only during periods of profound market movements. By default the indicator gives you a true day starting at 02:00 to 19:00 hours GMT+2. You can adjust according to your Time Zone. By deafult
FREE
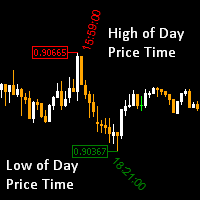
High of the Day and Low of the day Time and Price Fractal Studies is an indicator that will help you identify certain patterns that tend to repeat themseleves at certail times of the day or at certain prices.
It is used to study Daily Highs ad Lows in relation to time and price.
You will get to answer certail questions like:
At what time of day does this market usually turn around. At what price does the market turn. Is it at round numbers etc
FREE
GIVE A LOOK TO MY OTHER PRODUCTS ! 100 % PER MONTH PROFIT----CONTACT ME FOR MORE INFO !
What Is the Average True Range (ATR)? The average true range (ATR) is a technical analysis indicator, introduced by market technician J. Welles Wilder Jr. in his book New Concepts in Technical Trading Systems, that measures market volatility by decomposing the entire range of an asset price for that period. The true range indicator is taken as the greatest of the following: current high less the cur
FREE
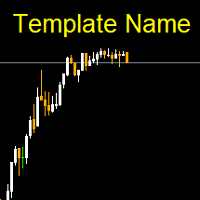
Template name allows you to write custom text that will show up on your charts. It allows you to position the text anywhere including selecting any color that you prefer. You can position the text at any of the 4 corners of your chart screen. This custom text can aid as a watermark for your screen shots. This text can act as a unique and true signature for your charts.
FREE

The latest version of Crypto Mama, v1.13, represents a major evolution from its original crypto-focused roots. While it continues to deliver strong, reliable performance on cryptocurrency pairs (especially BTCUSD and other major cryptos), the EA has been significantly enhanced and adapted for multi-market versatility . Crypto Mama now performs impressively across a wide range of instruments, including Forex (major and minor pairs) Metals (XAUUSD/gold, XAGUSD/silver, etc.) Indices And, of course

Real Trend Zigzag shows the real trend of a market, u nlike the default Zigzag indicator. It calculates the trend in real time and shows green lines for upwards trends, red lines for downward trends and blue lines for no trends. Regarding the old slogan "the trend is your friend" it helps you to decide if should open a buy or sell position. If you are looking for a multi timeframe zigzag, take a look at the PRO version: https://www.mql5.com/en/market/product/72071 MT4 version can be found her

Real Trend Zigzag PRO shows the real trend of a market, u nlike the default Zigzag indicator. It calculates the trend in real time and shows green lines for upwards trends, red lines for downward trends and blue lines for no trends. Regarding the old slogan "the trend is your friend" it helps you to decide if should open a buy or sell position. The PRO version is a multi timeframe zigzag (MTF). Means, it shows the trend of the current timeframe as well as the trend of a higher or lower time.
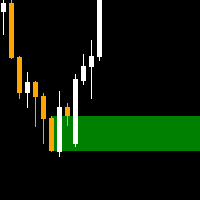
The order block locator is powered by three main search algorithms thar can be used to find order blocks. Simple Fractal Search Algorithm Naive Fractal Movers Algorithm
Candle Transition Algorithm You can even combine the power of your 2 favourite algorithms and get the best of both worlds: Mixed Algorithm (Naive Fractal + Candle transition) Mixed Algorithm (Simple Fractal + Candle Transition
Simple Fractal Search Algorithm
The algorithm finds the fractals based on your setting paramers for c
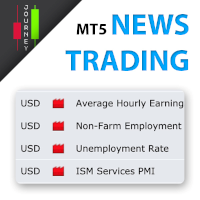
Trading has never been easier! Let's check this out! MT4 version: https://www.mql5.com/en/market/product/72153 Strategy There are some news within a day that can make the price jumps up or down very quickly and that is a good opportunity for traders to get some profits. Looking to scalp a news release? Here's how you can do it: Open two stop orders (a buy stop and a sell stop) 3 to 5 minutes before the news release. Place them about 15 to 20 pips away from the current market price. When the ne
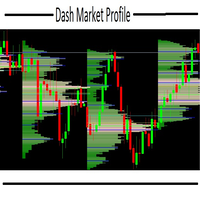
this indicator is essential when it's necessary to identify trade locations on chart. You can initially get an idea of the candlestick's direction with other graphical tools and then identify the best regions with the DMP. The Dash Market Profile is a statistical indicator, that mean it is an indicator that is based on mathematical calculations, identifying the best regions and observing the candles of the best regions to trade. The financial market is not as easy as it seems, it is necessar
Requirements Hedging account!
EA work with any brokerage conditions
EA should run on a VPS continuously
Information
Working symbol EUR, USD, GBP, GOLD, STEP INDEX, V10 (1s) any pair
STANDARD ACCOUNT
Working Timeframe: H1
Min deposit: $500 (1 Pair)
Min leverage 1:500 CENT ACCOUNT
Working Timeframe: M15/M30
Min deposit: $500 CENT (4 Pair)
Min leverage 1:500 Setfile for currency Here
Setting for DARK MAGIC MT5
MM = TRUE (Automatic lot calculation according to your risk) MM = FALSE (

Треугольным арбитражем называют одновременно открытие ордеров по трем валютным парам. Направление сделок и пары выбираются таким образом, чтобы одновременно открытые позиции страховали друг друга. За счет этого можно открываться достаточно большими лотами, и риск невелик. Варианты треугольников:
EURUSD – USDJPY – EURJPY Ордера, входящие в состав такого треугольника находятся в постоянном движении. Советник анализирует реальные цены на данный момент и просчитывает какими они должны быть. При рас
FREE

This signal is traded on BTCUSD M5 on MT5. Since it is a contrarian trade, we do not trade when there is not much price fluctuation. Operate with one signal in one account. If you have a position in another currency, you will not have a new position for safety. Trading of positions you already have will continue. We are trading in an environment with a leverage of 500 or more. Margin of $ 2000 or more is required depending on the market conditions. And sudden market fluctuations may require mo
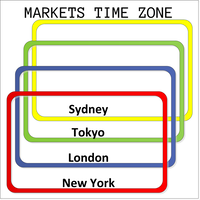
This product displays open and close time zones for four major markets New York, London, Sydney and Tokyo. It spares you the effort to manually check for market hours by conveniently displaying colored zones for different market hours. For serious traders it is essential to understand your preferred currency pair behavior with respect to major markets open and close times. This EA comes in handy when you want to integrate market hours with your other analysis tools all in one visual display. -Th

Account Info Manager(AIM) は、トレーディングアカウントのアドバイザーの作業結果に関する情報を表示するように設計されたユーティリティです。 ユーティリティは、マジックやコメントで注文をグループ化できるため、アカウントで取引された各エキスパートアドバイザーの作業結果を個別に分析できます。 このユーティリティを使用すると、アドバイザーが開いた注文数、勝ち注文の割合、利益値、利益率、平均注文サイズ、最大ドローダウン値(ドローダウンは残高によって決定されます)、最良および最悪の注文などに関する情報を表示できます。 。また、通貨ペアごとに個別にアドバイザーの作業の結果を確認することもできます。 すべての情報は.csvファイルに保存でき、Excelで開いてさらに処理することができます。
注意! ユーティリティはストラテジーテスターでは機能しません。 ユーティリティを使用する前に、チュートリアルビデオをご覧になることをお勧めします。

このプロジェクトが好きなら、5つ星レビューを残してください。 このインジケータは、指定されたためのオープン、ハイ、ロー、クローズ価格を描画します
特定のタイムゾーンの期間と調整が可能です。 これらは、多くの機関や専門家によって見られた重要なレベルです
トレーダーは、彼らがより多くのかもしれない場所を知るために有用であり、
アクティブ。 利用可能な期間は次のとおりです。 前の日。 前週。 前の月。 前の四半期。 前年。 または: 現在の日。 現在の週。 現在の月。 現在の四半期。 現年。
FREE
ダーウィンの進化 -30%Promotion! 1490 USDから990 USDの限定時間
(オファーは次のアップデートの到着まで有効です、時間を無駄にしないでください(もちろん、更新は価格に含まれています)。
!あなたはこのEAの裏当てを作ることができません、それは論理なしで注文を開くでしょう!
説明:
- その操作を理解するには、ブログをやってくる(このEAは私の外国為替取引の哲学を反映しています...あなたが物事を見るための私の方法が好きなら、あなたは私のEAが好きです
時間をかけてください! (Forexはレースではありません):https:// www.mql5.com/en/blogs/post/745790
- 過去のパフォーマンスを見るために、ここでシグナルのリンクがあります
ライブノーマルシグナルモード: https://www.mql5.com/en/users/tradedeal/seller
ライブシグナルリスクモード: https://www.mql5.com/en/users/tradedeal/seller
デモバージョン過去のパフォ
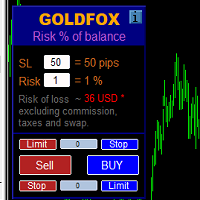
ストップロス(ピップ単位)と口座残高からのリスクのパーセンテージを考慮した取引ロットの自動計算。 Expert Advisorパネルは、左上のチャートにあります。アドバイザのパネルで、ピップ単位のストップロスのサイズとバランスからのリスクのパーセンテージを選択できます。保留中の注文の現在の価格からの偏差をピップで設定できます。赤い色は、ストップロスがトリガーされたときに失う可能性のある預金通貨の金額を示します。この金額には、手数料、スワップ、税金は含まれていません。
主要な外国為替通貨ペア、XAUUSD(ゴールド)、BTCUSD、ETHUSDには、このアドバイザーを使用することをお勧めします。他の機器については、計算の特殊性を考慮すると、エラーが発生する可能性があります。ほとんどの外国為替商品では、ドットの後に5桁のアカウントをお勧めします。
説明
-損失のリスク。預金通貨のリスク額は、アドバイザーの情報パネルに赤で表示されます。この値は、商品の証拠金がこのリスクに対して十分であり、SLフィールドでピップサイズを正しく指定している場合、未決済注文(または保留中

EA Martini MT5は、高度な位置決定および追跡システムを備えた多機能エキスパートアドバイザーです。 トレンドに合わせて、またはトレンドに逆らって非常にスマートなネットワークを構築します。 トレンドは、前の注文にブレークイーブンでストップロスがある場合にのみ新しい注文が開かれるように機能します。 トレンドに対する取引は、利益を上げて不採算ポジションを閉じることを目的として実行されます。 。 プロファイルでいつでも技術サポート、設定、インストールの支援をリクエストできます。 EA Martini MT5アドバイザーの利点: セットアップが簡単 初心者と専門家に適しています 任意の時間枠で取引できます 任意の金融商品(外国為替、暗号、CFD、先物、金属)で動作します自己最適化に適しています トレンドとトレンドの両方で取引するいくつかのモードがあります 平均化のいくつかのモードがあります 推奨事項: テストを実施します実際の Uに可能な限り近い条件でテストのデモアカウント 高品質で信頼性の高いテストを行うには、VPSサーバーを使用します 大きなリスクを冒さないで

EA Primer Daxは、Daxインデックスのトレンドを利用するために作成されましたが、市場が横ばいになると取引が制限されます。
ラテラル化でわずかな損失があったとしても、トレンドの時代に達成された利益はそれを補うことになります。
ストップロスを定義し、ポイント、ティック、またはパーセンテージで利益を得る可能性があります。そして、トレーリングストップを変更します。
これはリスクの高い市場であるため、$ 250.00ごとに0.25ロット管理を行い、0.25ロットの端数から開始して$ 500.00の最小残高を設定することをお勧めします。
私は英語を話せませんが、どんな質問でも翻訳者と一緒に管理することができます。私のwhatsappは+5547992904008です。
Limited time promotion!
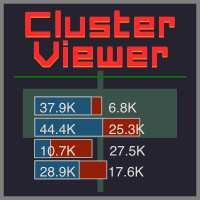
Within each candlestick is an epic fight between bears and bulls. Some pushing the price down and others forcing them up. Wouldn't it be great to be able to see where there is a greater concentration of business? Or to know if there is more buying or selling aggressions in the candlestick? After all, who is stronger, buyers or sellers? Although a candlestick image has a lot of information, it is nevertheless weak for deeper analysis. This is where you can count on the C
FREE

This indicator shows a candle combination based on dodge, dodge and pin bar. The logic of the pattern is to stand on the side of strength, after uncertainty. The indicator is universal and is useful for trading binary options, forex, ETFs, cryptocurrency, stocks. The indicator supports timeframes from M5 to MN, including non-standard TF presented in MT5. (М5,М6,М10,M12, M15, M20, M30, H1, H2, H3, H4, H6, H8, H12, D1, W1, MN). The ability to enable and disable TF is implemented. Sound alerts and

TradeByTime Manager is a tool to trade based on time. It is semi auto trading. Trader define entry and exit time and EA will manage the rest. Helpful for trader who is usually trading with time range such as trading signal with entry and exit based on time or trading with news event time. Or trader who is familiar with trading binary option, this is another 'sense' of it. Only this is for trading on regular chart. 1. TakeProfit and Stoploss 2. Double time based : Local and Server 3. Time counte
This Expert Advisor is applicable to plot wave charts as per the NeoWave method (Neely Extension of Wave Theory). NeoWave is a scientific, objective and revolutionary style of Elliott Wave Theory that was invented by Glenn Neely in 1990 in the “Mastering Elliott Wave” book. To start analyzing with this method, we need a particular chart called the Wave Chart or Cash Data chart . This is the first step for a good wave analysis. To draw this chart, Highs and Lows should be plotted in the order t
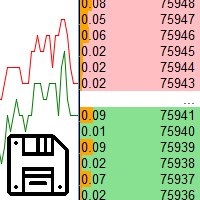
Saving data from the order book. Data replay utility: https://www.mql5.com/en/market/product/71640 Library for use in the strategy tester: https://www.mql5.com/en/market/product/81409
Perhaps, then a library will appear for using the saved data in the strategy tester, depending on the interest in this development. Now there are developments of this kind using shared memory, when only one copy of the data is in RAM. This not only solves the memory issue, but gives faster initialization on each

This is an original, agile, and excellent trending system. Whether you are a beginner trading novice or a professional trader, this set of indicators can help you quickly and timely track the latest changes in market trends. It has the following characteristics: The method of use is extremely simple, plug and play, and the display of all trend analysis results is clear at a glance; There is no need to configure any functional parameters, the trend tracking indicator will automatically analyze th
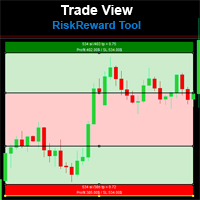
Risk Reward Tool , It is easy to use. With this tool you can see the rates of profit loss profit. You can see your strategy and earnings reward status of your goals.Double calculation can be done with single tool. Move with drag and drop. You can adjust the lot amount for calculations. The calculation results are shown in the comment section. There may sometimes be graphical errors during movements. Calculations works at all currency. Calculations All CFD works. Updates and improvements will co
FREE
Short description :
TheTrendHunterMax is a LIMITED VERSION tool that can be used either as a trading robot for automated trading or just a signal provider for manual trading.
As an EA, it uses the techniques we usually employ in trading like determining the highs and lows on the trading chart. With this, it determines the trend convergence and divergence in the chart. Combined with the volatility, price movements, it analyzes the possible order type that can be most profitable. By default,
FREE

Robô Ultra Dinamic Keltner
é um expert que utiliza os canais de keltner como principal forma de sinal.
O Robô possuem três setups
Rompimento das bandas Toque nas Bandas Retorno ao centro que é o Fechou Fora Fechou Dentro Configurações básicas do expert são
Volume (Tamanho do lote a ser negociado) Stop Loss em Pontos Take Profit em Pontos Configuração de horário para inicial Configuração de horário para enviar ordem Metas Financeiras Perda máxima no dia Lucro Máximo no dia Martingale Breake
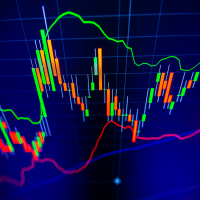
The indicator calculates reversal points based on the past trend and forms a channel (outer) on this basis. This elapsed time span from which the reversal points are determined can be specified in the settings.
An inner channel is also drawn in white. The trend continues in this channel, if there is a sideways trend. Here the upper / lower line form the possible turning point.
The indicator is suitable for all trading areas, whether forex, crypto, metals, indices or futures. All areas traded

The indicator draws levels based on the overbought and oversold values of the RSI indicator.
The maximum values are taken into account, which are equal to or exceeded certain limits. That is, for example, when the price has gone into the overbought zone, the highest price is selected from all prices in this zone for this period of time, and as soon as the indicator value returns to a value below the overbought value, the level is fixed and the calculation of new values begins.
The same
FREE
Binary Options Assistant (BOA) BLAZE Signals Indicator provides signals based on Christian’s at BLW Online Trading Binary Options Strategy. Indicators: 3 Moving Averages
Stop missing trades, stop jumping from chart to chart looking for trade set-ups and get all the signals on 1 chart! U se any of the BOA Signals Indicator with the Binary Options Assistant (BOA) Multi Currency Dashboard . All BOA Signal Indicator settings are adjustable to give you more strategy combinations. The signals can
Binary Options Assistant (BOA) BURN Signals Indicator provides signals based on Ana Trader Binary Options Strategy. Indicators: MACD & Stochastic
Stop missing trades, stop jumping from chart to chart looking for trade set-ups and get all the signals on 1 chart! U se any of the BOA Signals Indicator with the Binary Options Assistant (BOA) Multi Currency Dashboard . All BOA Signal Indicator settings are adjustable to give you more strategy combinations. The signals can be seen visually and hear
Binary Options Assistant (BOA) COLD Signals Indicator provides signals based on Amalia Trader Binary Options Strategy. Indicators: Keltner & Stochastic
Stop missing trades, stop jumping from chart to chart looking for trade set-ups and get all the signals on 1 chart! U se any of the BOA Signals Indicator with the Binary Options Assistant (BOA) Multi Currency Dashboard . All BOA Signal Indicator settings are adjustable to give you more strategy combinations. The signals can be seen visually a
Binary Options Assistant (BOA) LAVA Signals Indicator provides signals based on Lady Trader Binary Options Strategy (Bollinger Band & Stochastic). Indicators: Bollinger Bands & Stochastic
Stop missing trades, stop jumping from chart to chart looking for trade set-ups and get all the signals on 1 chart! U se any of the BOA Signals Indicator with the Binary Options Assistant (BOA) Multi Currency Dashboard . All BOA Signal Indicator settings are adjustable to give you more strategy combination
Binary Options Assistant (BOA) CHILL Signals Indicator provides signals based on Katie Tutorials Binary Options Strategy. Indicators: 3 Moving Averages & RSI
Stop missing trades, stop jumping from chart to chart looking for trade set-ups and get all the signals on 1 chart! U se any of the BOA Signals Indicator with the Binary Options Assistant (BOA) Multi Currency Dashboard . All BOA Signal Indicator settings are adjustable to give you more strategy combinations. The signals can be seen visu
Binary Options Assistant (BOA) ICE Signals Indicator provides signals based on gkNextLevel Binary Options Strategy. Indicators: 2 Bollinger Bands & Stochastic
Stop missing trades, stop jumping from chart to chart looking for trade set-ups and get all the signals on 1 chart! U se any of the BOA Signals Indicator with the Binary Options Assistant (BOA) Multi Currency Dashboard . All BOA Signal Indicator settings are adjustable to give you more strategy combinations. The signals can be seen vis

This robot operates through triggers above and below the previous candlestick with STOP orders.
When reaching the trigger (Stop Order) it opens the order and we have three situations:
If it reaches TAKE PROFIT (Maximum Profit) and the Breakeven Point is activated, it moves the STOP LOSS and the reverse STOP ORDER to Breakeven and cancels the reverse STOP order when reaching the TP.
If you go to STOP LOSS after reaching breakeven, the trigger of the reverse order will be reached because i

This is the Stargogs Volatility Arrow V1 Yeahhh!!! This Arrow is based on trend, support and demand and based on EMA's. You can change the parameters or settings like you want to. Message Me for the System which works best with this Indicator for free (include: Template, and other indicators). This indicator works with all Currency Pairs, All Volatility indices, All Indices, Boom & Crash Indices, Gold and NASDAQ. Works on All Timeframes Add the following to your chart with Stargogs Volatility A
FREE

The EA trades using two MA indicators - Moving Average and ADX - Average Directional Movement.
Buying and selling is possible only when a new bar is formed. Buy: MA is rising and the current closing price is above it. A buy order is placed only if there is a buy signal and there are no open long positions. Sell: MA is falling and the closing price is below it. A sell order is placed only if there is a sell signal and there are no open short positions. ADX will not allow trading if the market i

Codebird is proud to present our latest algorithmic trading expert advisor 'Codebird 15'.
Every bar, it evaluates 15 different indicators and compares the latest price to each one to determine a BUY , SELL or NEUTRAL verdict.
Each verdict is then placed through our algorithm which weighs the importance of that indication. In turn, through all 15, we arrive at a summary of all indicators combined. That is what is presented in the top left when you have 'Display Data' turned on.
The highest

Trade Sentiment or trade assistant is a MT5 Indicatior. That show buy or sell signal of different indicator to assist to take trades. That will help you to take right trades or to get confirmation for your trade. You don't need to have this indicators. Including indicators like RSI , STOCH , CCI. And the signals are Based on different Timeframes like 5M , 15H , 1H and 4H.
FREE
Binary Options Assistant (BOA) Multi Currency Dashboard for Binary Options (MT5) .
You can use any of the BOA Signals Indicators with the dashboard. Just change the BOA Signals Indicator Name in the dashboard settings to the indicator you want to get signals from. For example: CHILL. BLAZE: BOA_BLAZE_Indicator_v1 Strategy : BLW Online Trading Binary Options Strategy (3 Moving Average)
LAVA: BOA_LAVA_Indicator_v1 Strategy: Lady Trader Binary Options Strategy (Bollinger Bands & Stochas
Binary Options Assistant (BOA) BOIL Signals Indicator provides signals based on Ana Trader Binary Options Strategy. Indicators: Stochastic
Stop missing trades, stop jumping from chart to chart looking for trade set-ups and get all the signals on 1 chart! U se any of the BOA Signals Indicator with the Binary Options Assistant (BOA) Multi Currency Dashboard . All BOA Signal Indicator settings are adjustable to give you more strategy combinations. The signals can be seen visually and heard audi
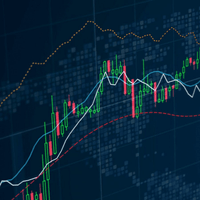
Moving Average Crossover with Alert is a indicator that can show buy and sell arrow types of alerts supported by the platform based on the crossover of two moving averages according to the parameters given by the trader. You can change inputs by yourself. This indicator only show the arrows to buy or sell to execute the trade you have to do it by yourself. For more information see the screenshot.

A very useful indicator to show you the previous day High and Low level as a channel on any time frame. This is an essential tool that helps you identify the current market position and trend. Every trader should have this in his toolbox, as sometimes when working on smaller time frames we forget about what happened yesterday :) and therefore we get distracted by false movements of the market.
I hope you enjoy my products and for the Demo version before leaving a negative review (if the need ar

This Advanced Pivots Point is a MT5 Indicator and the essence of this technical indicator is to transform the accumulated history data. Pivot Point Indicator provides for an opportunity to detect various peculiarities and patterns in price dynamics which are invisible to the naked eye. Pivot Points Fibonacci retracements Previous day’s open, high, low, and close.

This indicator uses Fibonacci to determine your trading levels precisely and measurably. It helps you to earn big profits. This indicator can also be used for various currency charts. You can also combine it with other indicators that you like so that the profits you get are also even greater. I hope you give me input so that this indicator can be better. We recommend using for the period M1 to M15. feel free to discuss with me. Thanks.

Trade Dragon Pro An expert trade utility perfect for intraday, mid-term and long-term trading. Trade Dragon Pro generates stop-loss and take-profit levels for you based on the previous Tokyo-Sydney session.
In-built risk management Configurable number of entries On-the-fly risk and SL and TP adjustment (TP is based on SL) In-built trade manager for auto break-evens and trailing stop losses Per-day support and resistance levels Pending levels menu 3 MA trend signal Trade projection to show you
ADX インジケーターは、トレンドとその強さを判断するために使用されます。価格の方向は +DI と -DI の値で示され、ADX 値はトレンドの強さを示します。+DI が -DI より上であれば、市場は上昇傾向にあり、反対であれば下降傾向にあります。ADX が 20 より下であれば、明確な方向性はありません。インジケーターがこのレベルを突破するとすぐに、中程度の強さのトレンドが始まります。40 を超える値は、強いトレンド (下降トレンドまたは上昇トレンド) を示します。
平均方向性指数 (ADX) インジケーターの複数通貨および複数時間枠の変更。パラメータで任意の通貨と時間枠を指定できます。また、インジケーターは、トレンドの強さのレベルが交差したとき、および +DI と -DI のラインが交差したときに通知を送信できます。ピリオドの付いたセルをクリックすると、このシンボルと期間が開きます。これが MTF スキャナーです。
通貨強度メーター (CSM) と同様に、ダッシュボードは、指定された通貨を含むペア、またはその通貨を基本通貨とするペアを自動的に選択できます。インジケーターは、

最初に、私は Dragon Ultra エキスパートアドバイザー(Expert Advisor) を徹底的に使い込み、深く理解することから始めました。 デモトレードで十分な時間をかけてテストしてください。リアルトレードを始める前に、 自分の EA を完璧に理解している状態であることが不可欠です 。 統計的に見ると、実際の経験を通じて使い方を学んだ方が、 成功する可能性ははるかに高くなります 。 Dragon Lite は、ボットがどのように動作するのかを理解するための無料バージョンです。 パラメータ Trading Mode(トレーディングモード) は UNLIMITED に変更してください。 Dragon Ultra を使用する前に、 Dragon Training を十分に使いこなせるレベルまで習熟しておく必要があります 。 FXトレーダー vs FXギャンブラー 今日のレッスンは、 あなたの目を開かせる内容 になるでしょう。
あなたが本当に「取引」をしているのか、それとも「ギャンブル」をしているのかを判断する助けになります。 そのため、この内容を 非常に注意深く 読んでください。
FREE
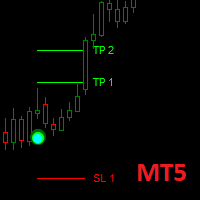
Dark Point is an Indicator for intraday trading. This Indicator is based on Trend Following strategy, also adopting the use of the atr to determine the right volatility. We can enter in good price with this Indicator, in order to follow the strong trend on the current instrument. If you love Dark Point, consider adding some power: Dark Power
Key benefits
Easily visible take profit/stop loss lines Intuitive directional points/arrows by colors Useful statistics , which indicate the wi
FREE
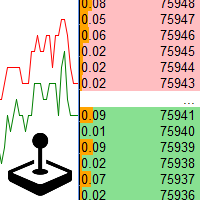
Playback of previously saved data from the order book.
Key features: Historical data navigation Adjusting the playback speed with the "---" and "+++" buttons, as well as with the mouse, you can by scrolling the wheel over the area of these buttons and between them Turning Price Centering On and Off Time display accurate to thousandths of a second Attention: This product also needs a utility to save data: https://www.mql5.com/en/market/product/71642
FREE

1. What is it The classic Bollinger Bands and the Bollinger Bands indicator built into the system, they have the same mean period and deviation period. And the method of average is just the simple moving average method. The deviation method used is just the standard deviation method. All this limits our research because: Sometimes we would like to have longer period averages + shorter period deviations. Sometimes we want moving averages that are not limited to simple moving averages but als

The Inside Bar e one is a reversal/continuation candle formation, and is one of the most traded candle patterns. Robot F1 allows you to configure different trading strategies, Day Trade or swing trade, based on the Inside Bar as a starting point.
This pattern only requires two candles to perform.
Robot F1 uses this extremely efficient pattern to identify trading opportunities. To make operations more effective, it has indicators that can be configured according to your strategy.
Among the o

Investment Castle Channels — Trade With the Flow
Price always flows within rising and falling channels. This non-repainting indicator projects those channels for you on any timeframe, giving you a clear path for placing buy and sell trades — the levels experienced traders draw by hand, mapped for you automatically.
What it does for you Non-repainting channels: rising and falling channels projected from real price structure. Multi-timeframe: see the channels that matter on any timeframe, or acr
FREE
MetaTraderマーケットが取引戦略とテクニカル指標を販売するための最適な場所である理由をご存じですか?宣伝もソフトウェア保護も必要なく、支払いのトラブルもないことです。これらはすべて、MetaTraderマーケットで提供されます。

取引の機会を逃しています。
- 無料取引アプリ
- 8千を超えるシグナルをコピー
- 金融ニュースで金融マーケットを探索