 MetaTrader 5
 Experts
 지표
 라이브러리
 유틸리티
 위젯
 규칙
MetaTrader 5용 새 Expert Advisor 및 지표 - 501
 트레이딩 로봇과 지표를 사용하여 외환 거래를 더 수익성 있게 만들 수 있습니다. 트레이딩용 로봇을 사용하면 개점 및 폐점 거래를 자동화할 수 있으며, 지표는 시장 행동을 보다 정확하게 예측할 수 있습니다.
이 페이지에는 MetaTrader 5 응용 프로그램의 카탈로그가 나와 있습니다.

A indicator to show saturation in buying or selling With fast and complex mathematical calculations Easily find saturation points for buying or selling Can be used in all symbols and time frames with many signals Can be combined with different indicators and different time frames With simple settings and simple working methods
Features: Can be used on all symbols Can be used in all time frames Can be used in all markets (Forex, stock, etc.) Large number of signals Same performance on all time
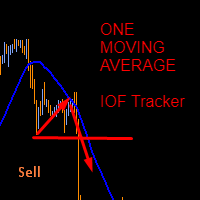
This indicator was created based on posts from forex factory thread titled There is no Magic Moving Average - You need only one - by @andose2 a.k.a Andrei Florin. If you want to know about how to use this trading strategy please go and read https://www.forexfactory.com/thread/691864-there-is-no-magic-moving-average-you.
Note: Below are extracts some of the posts .
Estabilish a trend, based on Market Cycles, then go only long in the Markup Phase and only short in the Decline phase , st
FREE
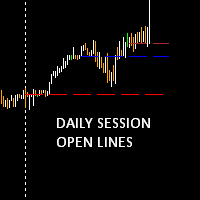
Daily session open lines shows the traders three important trading session opens. By default it is set up to show you: Zero GMT Open Line London Open Session Line New York Open Session Line The default times are set according to GMT+2 and as such you are able to change and customise according to your specific time zone. The Indicator is usefull specially for the trader who trades the London and NewYork sessions.
FREE
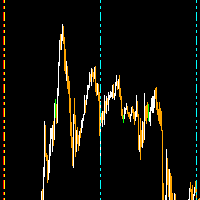
The daily custom period seperator indicator allows you to draw period seperators for your lower time frame charts H1 and below. The period seperator gives you options to set different colors for: Weekend - saturday/sunday Monday and Friday Midweek - Tuesday to Thursday.
By default the indicator plots the period seperator line at 00:00 hours for the last 10 days.
Use Cases: The indicator can be used as a colourful alternative period seperator to the default MT5 period seperator. For those tha
FREE
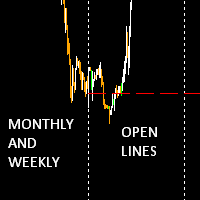
The Monthly Weekly Open Line is an indicator that plots: The current month open line that will extend till the last week on the month. Weekly lines that span the look back days period that you have set . Each line will extend from the respective weekly Monday zero GMT till friday of the respective week. Monthly and Weekly open lines can be used to build very powerfull anc consistent trading strategies. They act as natural S/R price barriers.
FREE
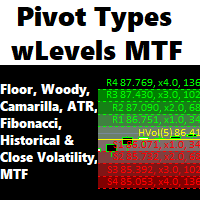
Fully featured Pivots and Levels indicator Pivots: Floor (normal), Woody, Camarilla, Fibonacci Levels: ATR, Historical Volatility with standard deviations, Close Price Volatility with standard deviations
Features: - 4 +/- levels
- MTF, pivots/levels based on Daily, Weekly, 4hr or even 15min - Hour and minute time offset
- Texts with prices and pip distances to central pivot/level - Inputs for Camarilla/Fibonacci/ATR/Volatility levels
- Alerts, popup, push, email, sound, live or completed candle
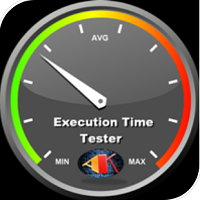
This Expert Advisor measures the broker execution time in milliseconds. Every 10 seconds (Refresh Seconds) , the EA opens a buy stop order far away from current price (1.5 x Ask), then modifies the (price, stop loss and take profit) of the created order by 5 pips then deletes it immediately.
Inputs Refresh Seconds: Number of seconds for each re-test, default 10 seconds.
Display Last: Last Execution time Min: Fastest execution time Max: Slowest Maximum execution time Avg: Average exec
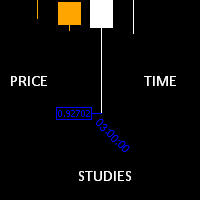
Time and Price Fractal Studies is an indicator that will help you identify certain patterns that tend to repeat themseleves at certail times of the day or at certain prices. It is used to study Fractal Highs ad Lows in relation to time and price. You will get to answer certail questions like: At what time of day does this market usually turn around. At what price does the market turn. Is it at round numbers etc.
FREE

True Days is a tool designed specifically for the trader who wants to catch intraday volatility in price charts. True day makes it easier for the trader to avoid trading in the dead zone - a period in time where markets are considered dead or non volatile. The trader can concentrate on finding opportunities only during periods of profound market movements. By default the indicator gives you a true day starting at 02:00 to 19:00 hours GMT+2. You can adjust according to your Time Zone. By deafult
FREE
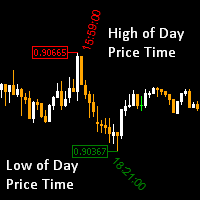
High of the Day and Low of the day Time and Price Fractal Studies is an indicator that will help you identify certain patterns that tend to repeat themseleves at certail times of the day or at certain prices.
It is used to study Daily Highs ad Lows in relation to time and price.
You will get to answer certail questions like:
At what time of day does this market usually turn around. At what price does the market turn. Is it at round numbers etc
FREE
GIVE A LOOK TO MY OTHER PRODUCTS ! 100 % PER MONTH PROFIT----CONTACT ME FOR MORE INFO !
What Is the Average True Range (ATR)? The average true range (ATR) is a technical analysis indicator, introduced by market technician J. Welles Wilder Jr. in his book New Concepts in Technical Trading Systems, that measures market volatility by decomposing the entire range of an asset price for that period. The true range indicator is taken as the greatest of the following: current high less the cur
FREE
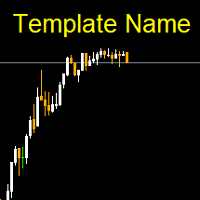
Template name allows you to write custom text that will show up on your charts. It allows you to position the text anywhere including selecting any color that you prefer. You can position the text at any of the 4 corners of your chart screen. This custom text can aid as a watermark for your screen shots. This text can act as a unique and true signature for your charts.
FREE

The latest version of Crypto Mama, v1.13, represents a major evolution from its original crypto-focused roots. While it continues to deliver strong, reliable performance on cryptocurrency pairs (especially BTCUSD and other major cryptos), the EA has been significantly enhanced and adapted for multi-market versatility . Crypto Mama now performs impressively across a wide range of instruments, including Forex (major and minor pairs) Metals (XAUUSD/gold, XAGUSD/silver, etc.) Indices And, of course

Real Trend Zigzag shows the real trend of a market, u nlike the default Zigzag indicator. It calculates the trend in real time and shows green lines for upwards trends, red lines for downward trends and blue lines for no trends. Regarding the old slogan "the trend is your friend" it helps you to decide if should open a buy or sell position. If you are looking for a multi timeframe zigzag, take a look at the PRO version: https://www.mql5.com/en/market/product/72071 MT4 version can be found her

Real Trend Zigzag PRO shows the real trend of a market, u nlike the default Zigzag indicator. It calculates the trend in real time and shows green lines for upwards trends, red lines for downward trends and blue lines for no trends. Regarding the old slogan "the trend is your friend" it helps you to decide if should open a buy or sell position. The PRO version is a multi timeframe zigzag (MTF). Means, it shows the trend of the current timeframe as well as the trend of a higher or lower time.
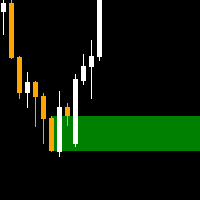
The order block locator is powered by three main search algorithms thar can be used to find order blocks. Simple Fractal Search Algorithm Naive Fractal Movers Algorithm
Candle Transition Algorithm You can even combine the power of your 2 favourite algorithms and get the best of both worlds: Mixed Algorithm (Naive Fractal + Candle transition) Mixed Algorithm (Simple Fractal + Candle Transition
Simple Fractal Search Algorithm
The algorithm finds the fractals based on your setting paramers for c
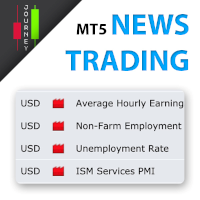
Trading has never been easier! Let's check this out! MT4 version: https://www.mql5.com/en/market/product/72153 Strategy There are some news within a day that can make the price jumps up or down very quickly and that is a good opportunity for traders to get some profits. Looking to scalp a news release? Here's how you can do it: Open two stop orders (a buy stop and a sell stop) 3 to 5 minutes before the news release. Place them about 15 to 20 pips away from the current market price. When the ne
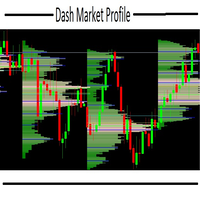
this indicator is essential when it's necessary to identify trade locations on chart. You can initially get an idea of the candlestick's direction with other graphical tools and then identify the best regions with the DMP. The Dash Market Profile is a statistical indicator, that mean it is an indicator that is based on mathematical calculations, identifying the best regions and observing the candles of the best regions to trade. The financial market is not as easy as it seems, it is necessar
Requirements Hedging account!
EA work with any brokerage conditions
EA should run on a VPS continuously
Information
Working symbol EUR, USD, GBP, GOLD, STEP INDEX, V10 (1s) any pair
STANDARD ACCOUNT
Working Timeframe: H1
Min deposit: $500 (1 Pair)
Min leverage 1:500 CENT ACCOUNT
Working Timeframe: M15/M30
Min deposit: $500 CENT (4 Pair)
Min leverage 1:500 Setfile for currency Here
Setting for DARK MAGIC MT5
MM = TRUE (Automatic lot calculation according to your risk) MM = FALSE (

Треугольным арбитражем называют одновременно открытие ордеров по трем валютным парам. Направление сделок и пары выбираются таким образом, чтобы одновременно открытые позиции страховали друг друга. За счет этого можно открываться достаточно большими лотами, и риск невелик. Варианты треугольников:
EURUSD – USDJPY – EURJPY Ордера, входящие в состав такого треугольника находятся в постоянном движении. Советник анализирует реальные цены на данный момент и просчитывает какими они должны быть. При рас
FREE

This signal is traded on BTCUSD M5 on MT5. Since it is a contrarian trade, we do not trade when there is not much price fluctuation. Operate with one signal in one account. If you have a position in another currency, you will not have a new position for safety. Trading of positions you already have will continue. We are trading in an environment with a leverage of 500 or more. Margin of $ 2000 or more is required depending on the market conditions. And sudden market fluctuations may require mo
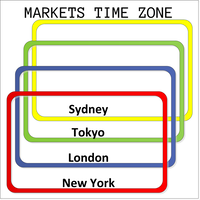
This product displays open and close time zones for four major markets New York, London, Sydney and Tokyo. It spares you the effort to manually check for market hours by conveniently displaying colored zones for different market hours. For serious traders it is essential to understand your preferred currency pair behavior with respect to major markets open and close times. This EA comes in handy when you want to integrate market hours with your other analysis tools all in one visual display. -Th

Account Info Manager (AIM) 은 거래 계정에 대한 고문의 작업 결과에 대한 정보를 볼 수 있도록 설계된 유틸리티입니다. 유틸리티는 마법이나 댓글로 주문을 그룹화할 수 있으므로 계정에서 거래된 각 Expert Advisor의 작업 결과를 개별적으로 분석할 수 있습니다. 이 유틸리티를 사용하여 고문이 연 주문 수, 주문 성공률, 이익 가치, 이익 계수, 평균 주문 크기, 최대 인출 금액(드로우다운은 잔액에 따라 결정됨), 최고 및 최저 주문 등에 대한 정보를 볼 수 있습니다. 각 통화 쌍에 대한 고문의 작업 결과를 별도로 볼 수도 있습니다. 모든 정보는 추가 처리를 위해 Excel에서 열 수 있는 .csv 파일에 저장할 수 있습니다.
주목! 유틸리티는 전략 테스터에서 작동하지 않습니다. 유틸리티를 사용하기 전에 튜토리얼 비디오를 시청하는 것이 좋습니다.

이 프로젝트를 좋아한다면 5 스타 리뷰를 남겨주세요. 이 지표는 열리고, 높은, 낮은 및 마감 가격을 지정합니다.
기간과 그것은 특정한 시간대를 위해 조정될 수 있습니다. 이들은 많은 기관 및 전문가에 의해 보는 중요한 수준입니다
상인은 당신이 더 많은 것일 수있는 장소를 알고 도움이 될 수 있습니다
이름 * 사용 가능한 기간: 이전 날. 이전 주. 지난 달. 이전 분기. 이전 연도. 또는: 현재 날. 현재 주. 현재 달. 현재 분기. 현재 년.
FREE
다윈 진화
-30 % 프로모션 !! 1490 USD ~ 990 USD 제한 시간
(다음 업데이트 도착에 대한 유효한 제안, 시간 낭비하지 마십시오 )
!!! 이 EA의 백틀을 만들 수는 없으므로 논리없이 주문을 열 수 있습니다!
설명 :
- 작업을 이해하고, 블로그를 읽고 (이 EA는 외환 거래의 철학을 반영합니다.
그것을 할 시간을 가져라 !! (Forex는 경주가 아닙니다) : https://www.mql5.com/en/blogs/post/745790.
- 과거의 성능을 보려면 여기서 신호의 링크가 있습니다.
라이브 정상 신호 모드 : https://www.mql5.com/en/users/tradedeal/seller
라이브 신호 위험 모드 : https://www.mql5.com/en/users/tradedeal/seller
데모 버전 과거 성능 : https://www.mql5.com/en/market/product/71748#!tab=comments&pag
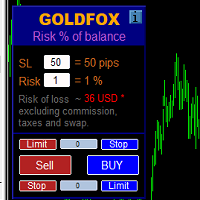
손절매(핍 단위) 및 계정 잔액의 위험 비율을 고려한 거래 로트의 자동 계산. Expert Advisor 패널은 왼쪽 상단의 차트에 있습니다. 어드바이저의 패널에서 스톱로스(핍 손실)의 크기와 잔액에서 위험 비율을 선택할 수 있습니다. 보류 중인 주문에 대해 현재 가격과의 편차를 핍 단위로 설정할 수 있습니다. 붉은 색은 손절매가 발동될 때 잃을 수 있는 예금 통화의 금액을 나타내며 이 금액에는 수수료, 스왑 및 세금이 포함되지 않습니다.
주요 외환 통화 쌍인, XAUUSD(금), BTCUSD, ETHUSD에 이 어드바이저를 사용하는 것이 좋습니다! 다른 기기의 경우 계산의 특성을 고려하여 오류가 발생할 수 있습니다! 대부분의 외환 상품에 대해 점 뒤에 5자리 숫자가 있는 계정을 권장합니다.
설명
- 손실 위험. 예금 통화의 위험 금액은 고문의 정보 패널에 빨간색으로 표시됩니다. 이 값은 미결제 주문(또는 보류된 주문)에 해당합니다. 단, 상품의 마진이 이 위

EA Martini MT5는 정교한 위치 결정 및 추적 시스템을 갖춘 다기능 Expert Advisor입니다.{1}} 트렌드에 따라 매우 스마트한 네트워크를 구축합니다.{1}} 트레이딩 추세는 이전 주문에 손익분기점에 손절매가 있는 경우에만 새로운 주문이 열리는 방식으로 작동합니다. 추세에 대한 거래는 이익이 없는 무익한 포지션을 청산할 목적으로 수행됩니다. . 항상 내 프로필에서 기술 지원, 설정 및 설치 지원을 요청할 수 있습니다. EA Martini MT5 Advisor의 장점: 간단한 설정 초보자 및 전문가에게 적합 언제든지 거래 가능 모든 금융 상품(Forex, Crypto, CFD, Futures, Metals)과 호환자체 최적화에 적합 추세와 추세에 따라 거래하는 여러 모드가 있음 여러 가지 평균화 모드가 있음 권장사항: 테스트 수행 가능한 한 실제에 가까운 조건에서 U 테스트용 데모 계정 고품질 및 안정적인 테스트를 위해 VPS 서버 사용 큰 위험을

The EA Primer Dax was created to take advantage of the trends of the Dax index with a limitation of trades when the market goes sideways.
Even having small losses in lateralizations, the gains achieved in times of trend end up making up for it.
There is the possibility of defining stop loss and take profit with points, ticks or percentage. And change the Trailing stop.
As this is a high risk market, I recommend a 0.25 lot management for every $250.00 and a minimum balance of $500.00 starting
Limited time promotion!
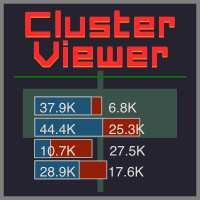
Within each candlestick is an epic fight between bears and bulls. Some pushing the price down and others forcing them up. Wouldn't it be great to be able to see where there is a greater concentration of business? Or to know if there is more buying or selling aggressions in the candlestick? After all, who is stronger, buyers or sellers? Although a candlestick image has a lot of information, it is nevertheless weak for deeper analysis. This is where you can count on the C
FREE

This indicator shows a candle combination based on dodge, dodge and pin bar. The logic of the pattern is to stand on the side of strength, after uncertainty. The indicator is universal and is useful for trading binary options, forex, ETFs, cryptocurrency, stocks. The indicator supports timeframes from M5 to MN, including non-standard TF presented in MT5. (М5,М6,М10,M12, M15, M20, M30, H1, H2, H3, H4, H6, H8, H12, D1, W1, MN). The ability to enable and disable TF is implemented. Sound alerts and

TradeByTime Manager is a tool to trade based on time. It is semi auto trading. Trader define entry and exit time and EA will manage the rest. Helpful for trader who is usually trading with time range such as trading signal with entry and exit based on time or trading with news event time. Or trader who is familiar with trading binary option, this is another 'sense' of it. Only this is for trading on regular chart. 1. TakeProfit and Stoploss 2. Double time based : Local and Server 3. Time counte
This Expert Advisor is applicable to plot wave charts as per the NeoWave method (Neely Extension of Wave Theory). NeoWave is a scientific, objective and revolutionary style of Elliott Wave Theory that was invented by Glenn Neely in 1990 in the “Mastering Elliott Wave” book. To start analyzing with this method, we need a particular chart called the Wave Chart or Cash Data chart . This is the first step for a good wave analysis. To draw this chart, Highs and Lows should be plotted in the order t
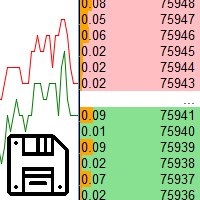
Saving data from the order book. Data replay utility: https://www.mql5.com/en/market/product/71640 Library for use in the strategy tester: https://www.mql5.com/en/market/product/81409
Perhaps, then a library will appear for using the saved data in the strategy tester, depending on the interest in this development. Now there are developments of this kind using shared memory, when only one copy of the data is in RAM. This not only solves the memory issue, but gives faster initialization on each

This is an original, agile, and excellent trending system. Whether you are a beginner trading novice or a professional trader, this set of indicators can help you quickly and timely track the latest changes in market trends. It has the following characteristics: The method of use is extremely simple, plug and play, and the display of all trend analysis results is clear at a glance; There is no need to configure any functional parameters, the trend tracking indicator will automatically analyze th
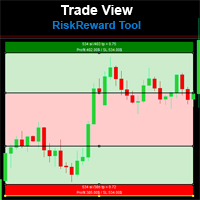
Risk Reward Tool , It is easy to use. With this tool you can see the rates of profit loss profit. You can see your strategy and earnings reward status of your goals.Double calculation can be done with single tool. Move with drag and drop. You can adjust the lot amount for calculations. The calculation results are shown in the comment section. There may sometimes be graphical errors during movements. Calculations works at all currency. Calculations All CFD works. Updates and improvements will co
FREE
Short description :
TheTrendHunterMax is a LIMITED VERSION tool that can be used either as a trading robot for automated trading or just a signal provider for manual trading.
As an EA, it uses the techniques we usually employ in trading like determining the highs and lows on the trading chart. With this, it determines the trend convergence and divergence in the chart. Combined with the volatility, price movements, it analyzes the possible order type that can be most profitable. By default,
FREE

Robô Ultra Dinamic Keltner
é um expert que utiliza os canais de keltner como principal forma de sinal.
O Robô possuem três setups
Rompimento das bandas Toque nas Bandas Retorno ao centro que é o Fechou Fora Fechou Dentro Configurações básicas do expert são
Volume (Tamanho do lote a ser negociado) Stop Loss em Pontos Take Profit em Pontos Configuração de horário para inicial Configuração de horário para enviar ordem Metas Financeiras Perda máxima no dia Lucro Máximo no dia Martingale Breake
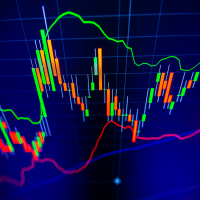
The indicator calculates reversal points based on the past trend and forms a channel (outer) on this basis. This elapsed time span from which the reversal points are determined can be specified in the settings.
An inner channel is also drawn in white. The trend continues in this channel, if there is a sideways trend. Here the upper / lower line form the possible turning point.
The indicator is suitable for all trading areas, whether forex, crypto, metals, indices or futures. All areas traded

The indicator draws levels based on the overbought and oversold values of the RSI indicator.
The maximum values are taken into account, which are equal to or exceeded certain limits. That is, for example, when the price has gone into the overbought zone, the highest price is selected from all prices in this zone for this period of time, and as soon as the indicator value returns to a value below the overbought value, the level is fixed and the calculation of new values begins.
The same
FREE
Binary Options Assistant (BOA) BLAZE Signals Indicator provides signals based on Christian’s at BLW Online Trading Binary Options Strategy. Indicators: 3 Moving Averages
Stop missing trades, stop jumping from chart to chart looking for trade set-ups and get all the signals on 1 chart! U se any of the BOA Signals Indicator with the Binary Options Assistant (BOA) Multi Currency Dashboard . All BOA Signal Indicator settings are adjustable to give you more strategy combinations. The signals can
Binary Options Assistant (BOA) BURN Signals Indicator provides signals based on Ana Trader Binary Options Strategy. Indicators: MACD & Stochastic
Stop missing trades, stop jumping from chart to chart looking for trade set-ups and get all the signals on 1 chart! U se any of the BOA Signals Indicator with the Binary Options Assistant (BOA) Multi Currency Dashboard . All BOA Signal Indicator settings are adjustable to give you more strategy combinations. The signals can be seen visually and hear
Binary Options Assistant (BOA) COLD Signals Indicator provides signals based on Amalia Trader Binary Options Strategy. Indicators: Keltner & Stochastic
Stop missing trades, stop jumping from chart to chart looking for trade set-ups and get all the signals on 1 chart! U se any of the BOA Signals Indicator with the Binary Options Assistant (BOA) Multi Currency Dashboard . All BOA Signal Indicator settings are adjustable to give you more strategy combinations. The signals can be seen visually a
Binary Options Assistant (BOA) LAVA Signals Indicator provides signals based on Lady Trader Binary Options Strategy (Bollinger Band & Stochastic). Indicators: Bollinger Bands & Stochastic
Stop missing trades, stop jumping from chart to chart looking for trade set-ups and get all the signals on 1 chart! U se any of the BOA Signals Indicator with the Binary Options Assistant (BOA) Multi Currency Dashboard . All BOA Signal Indicator settings are adjustable to give you more strategy combination
Binary Options Assistant (BOA) CHILL Signals Indicator provides signals based on Katie Tutorials Binary Options Strategy. Indicators: 3 Moving Averages & RSI
Stop missing trades, stop jumping from chart to chart looking for trade set-ups and get all the signals on 1 chart! U se any of the BOA Signals Indicator with the Binary Options Assistant (BOA) Multi Currency Dashboard . All BOA Signal Indicator settings are adjustable to give you more strategy combinations. The signals can be seen visu
Binary Options Assistant (BOA) ICE Signals Indicator provides signals based on gkNextLevel Binary Options Strategy. Indicators: 2 Bollinger Bands & Stochastic
Stop missing trades, stop jumping from chart to chart looking for trade set-ups and get all the signals on 1 chart! U se any of the BOA Signals Indicator with the Binary Options Assistant (BOA) Multi Currency Dashboard . All BOA Signal Indicator settings are adjustable to give you more strategy combinations. The signals can be seen vis

This robot operates through triggers above and below the previous candlestick with STOP orders.
When reaching the trigger (Stop Order) it opens the order and we have three situations:
If it reaches TAKE PROFIT (Maximum Profit) and the Breakeven Point is activated, it moves the STOP LOSS and the reverse STOP ORDER to Breakeven and cancels the reverse STOP order when reaching the TP.
If you go to STOP LOSS after reaching breakeven, the trigger of the reverse order will be reached because i

This is the Stargogs Volatility Arrow V1 Yeahhh!!! This Arrow is based on trend, support and demand and based on EMA's. You can change the parameters or settings like you want to. Message Me for the System which works best with this Indicator for free (include: Template, and other indicators). This indicator works with all Currency Pairs, All Volatility indices, All Indices, Boom & Crash Indices, Gold and NASDAQ. Works on All Timeframes Add the following to your chart with Stargogs Volatility A
FREE

The EA trades using two MA indicators - Moving Average and ADX - Average Directional Movement.
Buying and selling is possible only when a new bar is formed. Buy: MA is rising and the current closing price is above it. A buy order is placed only if there is a buy signal and there are no open long positions. Sell: MA is falling and the closing price is below it. A sell order is placed only if there is a sell signal and there are no open short positions. ADX will not allow trading if the market i

Codebird is proud to present our latest algorithmic trading expert advisor 'Codebird 15'.
Every bar, it evaluates 15 different indicators and compares the latest price to each one to determine a BUY , SELL or NEUTRAL verdict.
Each verdict is then placed through our algorithm which weighs the importance of that indication. In turn, through all 15, we arrive at a summary of all indicators combined. That is what is presented in the top left when you have 'Display Data' turned on.
The highest

Trade Sentiment or trade assistant is a MT5 Indicatior. That show buy or sell signal of different indicator to assist to take trades. That will help you to take right trades or to get confirmation for your trade. You don't need to have this indicators. Including indicators like RSI , STOCH , CCI. And the signals are Based on different Timeframes like 5M , 15H , 1H and 4H.
FREE
Binary Options Assistant (BOA) Multi Currency Dashboard for Binary Options (MT5) .
You can use any of the BOA Signals Indicators with the dashboard. Just change the BOA Signals Indicator Name in the dashboard settings to the indicator you want to get signals from. For example: CHILL. BLAZE: BOA_BLAZE_Indicator_v1 Strategy : BLW Online Trading Binary Options Strategy (3 Moving Average)
LAVA: BOA_LAVA_Indicator_v1 Strategy: Lady Trader Binary Options Strategy (Bollinger Bands & Stochas
Binary Options Assistant (BOA) BOIL Signals Indicator provides signals based on Ana Trader Binary Options Strategy. Indicators: Stochastic
Stop missing trades, stop jumping from chart to chart looking for trade set-ups and get all the signals on 1 chart! U se any of the BOA Signals Indicator with the Binary Options Assistant (BOA) Multi Currency Dashboard . All BOA Signal Indicator settings are adjustable to give you more strategy combinations. The signals can be seen visually and heard audi
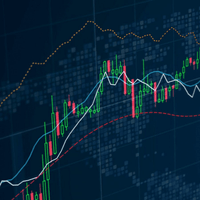
Moving Average Crossover with Alert is a indicator that can show buy and sell arrow types of alerts supported by the platform based on the crossover of two moving averages according to the parameters given by the trader. You can change inputs by yourself. This indicator only show the arrows to buy or sell to execute the trade you have to do it by yourself. For more information see the screenshot.

A very useful indicator to show you the previous day High and Low level as a channel on any time frame. This is an essential tool that helps you identify the current market position and trend. Every trader should have this in his toolbox, as sometimes when working on smaller time frames we forget about what happened yesterday :) and therefore we get distracted by false movements of the market.
I hope you enjoy my products and for the Demo version before leaving a negative review (if the need ar

This Advanced Pivots Point is a MT5 Indicator and the essence of this technical indicator is to transform the accumulated history data. Pivot Point Indicator provides for an opportunity to detect various peculiarities and patterns in price dynamics which are invisible to the naked eye. Pivot Points Fibonacci retracements Previous day’s open, high, low, and close.

This indicator uses Fibonacci to determine your trading levels precisely and measurably. It helps you to earn big profits. This indicator can also be used for various currency charts. You can also combine it with other indicators that you like so that the profits you get are also even greater. I hope you give me input so that this indicator can be better. We recommend using for the period M1 to M15. feel free to discuss with me. Thanks.

Trade Dragon Pro An expert trade utility perfect for intraday, mid-term and long-term trading. Trade Dragon Pro generates stop-loss and take-profit levels for you based on the previous Tokyo-Sydney session.
In-built risk management Configurable number of entries On-the-fly risk and SL and TP adjustment (TP is based on SL) In-built trade manager for auto break-evens and trailing stop losses Per-day support and resistance levels Pending levels menu 3 MA trend signal Trade projection to show you
ADX 지표는 추세와 강도를 결정하는 데 사용됩니다. 가격의 방향은 +DI와 -DI 값으로 표시되며, ADX 값은 추세의 강도를 나타냅니다. +DI가 -DI보다 높으면 시장은 상승 추세에 있고, 반대로이면 하락 추세에 있습니다. ADX가 20 미만이면 명확한 방향이 없습니다. 지표가 이 수준을 돌파하자마자 중간 강도의 추세가 시작됩니다. 40보다 큰 값은 강한 추세(하락 추세 또는 상승 추세)를 나타냅니다.
평균 방향 이동 지수(ADX) 지표의 다중 통화 및 다중 시간대 수정. 매개변수에서 원하는 통화와 기간을 지정할 수 있습니다. 또한 지표는 추세 강도 수준이 교차할 때, 그리고 +DI 및 -DI 선이 교차할 때 알림을 보낼 수 있습니다. 마침표가 있는 셀을 클릭하면 해당 기호와 마침표가 열립니다. MTF 스캐너입니다.
통화 강도 측정기(CSM)와 마찬가지로 대시보드는 지정된 통화가 포함된 쌍 또는 해당 통화가 기본 통화로 포함된 쌍을 자동으로 선택할 수 있습니다. 표시기는

처음에 저는 Dragon Ultra Expert Advisor 를 본격적으로 사용해 보기 시작했습니다. 데모 계정에서 충분한 시간을 가지고 테스트하세요.
실제 거래를 시작하기 전에, 반드시 사용 중인 Expert Advisor를 완벽하게 이해하고 있어야 합니다. 통계에 따르면, 경험을 통해 이 시스템을 사용하는 법을 배울수록 성공 확률이 높아집니다. Dragon Lite 는 봇이 어떻게 작동하는지 이해할 수 있도록 제공되는 무료 버전입니다. Parameter Trading Mode: UNLIMITED 로 변경하세요. Dragon Ultra 를 사용하기 전에 반드시 Dragon Training 을 능숙하게 사용할 수 있어야 합니다. 포렉스 트레이더 vs 포렉스 도박꾼 오늘의 수업은 당신의 눈을 열어주고,
당신이 지금 거래를 하고 있는지 , 아니면 도박을 하고 있는지 를 스스로 판단하게 도와줄 것입니다.
그러므로 필요하다면 세 번이라도 아주 주의 깊게 읽어보세요. 시장 도박에 문제가 없
FREE
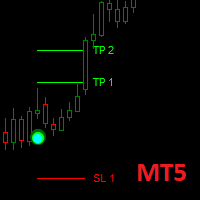
Dark Point is an Indicator for intraday trading. This Indicator is based on Trend Following strategy, also adopting the use of the atr to determine the right volatility. We can enter in good price with this Indicator, in order to follow the strong trend on the current instrument. If you love Dark Point, consider adding some power: Dark Power
Key benefits
Easily visible take profit/stop loss lines Intuitive directional points/arrows by colors Useful statistics , which indicate the wi
FREE
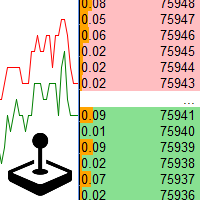
Playback of previously saved data from the order book.
Key features: Historical data navigation Adjusting the playback speed with the "---" and "+++" buttons, as well as with the mouse, you can by scrolling the wheel over the area of these buttons and between them Turning Price Centering On and Off Time display accurate to thousandths of a second Attention: This product also needs a utility to save data: https://www.mql5.com/en/market/product/71642
FREE

1. What is it The classic Bollinger Bands and the Bollinger Bands indicator built into the system, they have the same mean period and deviation period. And the method of average is just the simple moving average method. The deviation method used is just the standard deviation method. All this limits our research because: Sometimes we would like to have longer period averages + shorter period deviations. Sometimes we want moving averages that are not limited to simple moving averages but als

The Inside Bar e one is a reversal/continuation candle formation, and is one of the most traded candle patterns. Robot F1 allows you to configure different trading strategies, Day Trade or swing trade, based on the Inside Bar as a starting point.
This pattern only requires two candles to perform.
Robot F1 uses this extremely efficient pattern to identify trading opportunities. To make operations more effective, it has indicators that can be configured according to your strategy.
Among the o

Investment Castle Channels — Trade With the Flow
Price always flows within rising and falling channels. This non-repainting indicator projects those channels for you on any timeframe, giving you a clear path for placing buy and sell trades — the levels experienced traders draw by hand, mapped for you automatically.
What it does for you Non-repainting channels: rising and falling channels projected from real price structure. Multi-timeframe: see the channels that matter on any timeframe, or acr
FREE

R FACTOR Multi Strategy Expert Advisor with Proprietary Dynamic Portfolio Management System
After 4 years of development and more than 3 years of real positive results, R Factor is available for MQL5 community! It has always been important for us that the strategies performed positively for the creator before it could be shared. Skin In The Game is essential to demonstrate the belief in the strategy and also to provide a continuous improvement of it.
Anyone who has been in this market for s

In the SM Trend Cloud indicator, two buffers are used for calculation and rendering. One of the main advantages of this tool is its simplicity, while its signals can be quite accurate. But, again, we have a trend indicator in front of us, and therefore it will generate false signals mainly in conditions of consolidation. At the same time, I do not advise using the indicator in its own form, there is no way to do without additional filters. As an additional signal, I suggest using ZigZag indicat
FREE
It so happened that it is no longer necessary to write about the principles of operation of indicators of this type. The presented indicator redraws the trend direction until it changes to the opposite. whether this is right or not is up to you to judge. It works well together with SM trend Cloud, which is implemented in the SMak ZigZag EA and Pyramid EA Expert Advisor code. When these two indicators work together, it is possible to determine the further trend movement with a high degree of pr
FREE
ToolBox 360 is the swiss knife of all indicators. It is full packed with useful tools to help you with your trading. It can be used to find best entry and exit points and help you to decide if you should open a trade or not. It shows market trends, candlestick formations outside / inside bars and you can sett time based allerts.
Main features:
Time based Fibonacci lines Choose a start and end time and the indicator shows you Fibonacci lines within the selected time range including range high a
An indicator of patterns #24 and #26 ("Head and Shoulders") from Encyclopedia of Chart Patterns by Thomas N. Bulkowski. Parameters: Alerts - show alert when an arrow appears Push - send a push notification when an arrow appears (requires configuration in the terminal) PeriodBars - indicator period K - an additional parameter that influences the accuracy of pattern shape recognition ArrowType - a symbol from 1 to 17 ArrowVShift - vertical shift of arrows in pixels ShowLevels - show levels Col
An indicator of pattern #30 ("Island Reversal") from Encyclopedia of Chart Patterns by Thomas N. Bulkowski (two gaps, the second gap is in the direction of the first one). Parameters: Alerts - show alert when an arrow appears Push - send a push notification when an arrow appears (requires configuration in the terminal) GapSize - minimum gap size in points ArrowType - a symbol from 1 to 17 ArrowVShift - vertical shift of arrows in pixels ShowLevels - show levels ColUp - color of an upward line
MetaTrader 마켓은 거래로봇과 기술지표를 판매하기에 최적의 장소입니다.
오직 어플리케이션만 개발하면 됩니다. 수백만 명의 MetaTrader 사용자에게 제품을 제공하기 위해 마켓에 제품을 게시하는 방법에 대해 설명해 드리겠습니다.
