 MetaTrader 5
 エキスパート
 インディケータ
 ライブラリ
 ユーティリティ
 ウィジェット
 ルール
YouTubeにあるマーケットチュートリアルビデオをご覧ください
ロボットや指標を購入する
仮想ホスティングで
EAを実行
EAを実行
ロボットや指標を購入前にテストする
マーケットで収入を得る
販売のためにプロダクトをプレゼンテーションする方法
MetaTrader 5のためのテクニカル指標 - 161
 テクニカル指標からのシグナルは、株式および外国為替市場での取引の開始と終了に重要な役割を果たします。指標の本質は、将来の価格変動を予測することを目的とした金融銘柄価格の数学的変換です。
テクニカル指標をテストして、市場の動きとそれからの利益をより正確に予測します。

Support: Profit Smasher 24/7 AI Assistant Disclaimer Liquidity Mapper Pro is an analytical tool for educational and informational purposes only.
It does not provide financial advice or guaranteed signals.
All trading carries risk, including potential loss of capital.
Past performance does not guarantee future results.
You are solely responsible for your trading decisions.

Niveaux mensuels + PinBar + Marubozu + ALERTES (MQL5) Version : 2.0 FINAL
Auteur : KOUAME N'DA LEMISSA See More Description du produit Cet indicateur avancé pour MetaTrader 5 combine l'analyse des niveaux mensuels, la reconnaissance des modèles de chandeliers japonais (PinBar et Marubozu) et un système d'alerte en temps réel. Il aide les traders à identifier rapidement les zones clés du marché et les opportunités de trading à forte probabilité. Caractéristiques principales Affichage automatiqu
Volume Flow Indicator for MetaTrader 5 Check all of our products from the link below Our most popular indicator
What are the specifications of this indicator? Platform: MetaTrader 5 (MT5) Type of Application: Custom Trading Indicator Level: Intermediate Timeframe: All Timeframes (Multi-Timeframe Support) Trading Styles: Scalping, Day Trading, Swing Trading, Position Trading Trading Markets: Forex, Stocks, Commodities, Indices, and Crypto
What does this indicator do? The Volume Flow Indicator

SR POC VOLUMEインジケーターは、MetaTrader 5向けに設計されており、指定された期間内のローソク足データからコントロールポイント(POC)を識別、集約、可視化する機能を提供します。本インジケーターの目的は、累積取引量とデルタ分布に基づいてサポートおよびレジスタンスゾーンを体系的に特定し、市場における重要な関心領域をトレーダーが理解できるようにすることです。 主な機能 POCの計算 インジケーターは、指定されたバックルック期間内の各ローソク足に対してPOCを計算します。 POCは、ローソク足の高値と安値の中間点として定義されます。 各POCにはデルタ値が関連付けられています。デルタはティックボリュームと方向性のバイアスに基づき、終値が始値より高い場合は正、そうでない場合は負として計算されます。 デルタは買い手と売り手間の方向性の不均衡を強調するためにスケーリングされます。 クラスター形成 POCは、ユーザーが指定した価格比率の許容誤差に基づいてクラスター化されます。 許容誤差は、POC同士がどれだけ近接している場合に同じクラスターとして扱うかを決定します。 各クラスタ

Total opened lots calculation & Average price show on chart. You can manage lots size it's helpful who opened many lots in different price leval and it's shows Average price of lots.it's indicator not EA. Available only Mt5. Attach on chart which open positions pairwhich you want to calculate and want to know all lots average price. Excellent indicator which may help to controls your lots size.

MetaTraderPro Premium Indicator (MT5) The MetaTraderPro Premium Indicator is designed to clearly and objectively identify potential entry and exit points in the market. With signals displayed directly on the chart, it provides practicality and agility to support decision-making. Key Advantage: the indicator does not repaint and does not recalculate after the candle closes, ensuring consistent and reliable signals. Features: Buy and sell arrows directly on the chart No repainting or rec

Support Resistance Catcher Indicator Features and Explanation
Overview: The Support Resistance Catcher is a custom MT5 indicator designed to identify and visualize supply (resistance) and demand (support) zones based on candlestick price action. It detects zones where price has reversed after rallies or drops, using wick rejections and clustering. The indicator draws horizontal rectangles for active and historical zones, with customizable colors, labels, and alerts.
Key Features:
1. Zone Det
Consolidation Breakout Panel EA Consolidation Breakout Panel EA は、複数の銘柄とタイムフレーム (M2, M5, M15, M30, H1, D1) を同時に監視し、 価格のレンジ(コンソリデーション) を自動的に検出し、 ブレイクアウト を特定、さらに出来高に基づいてブレイクの強弱を分類する リアルタイム・スマートパネル です。 レベルブレイクアウト戦略 を利用するトレーダー、 複数市場 を同時に追跡したいトレーダー、そして各タイムフレームごとの トレンドを明確に把握 したいトレーダーに最適です。 主な機能 レンジ検出:
5本以上の連続バー で構成され、 唯一の高値 と 唯一の安値 を持つレンジを自動的に識別。 ブレイクアウトシグナル: / → バーの終値によるブレイク確認。 大きな黄色い矢印 = 強いブレイク (出来高が平均以上)。 小さな灰色の矢印 = 弱いブレイク (出来高が平均以下)。 EMA55によるトレンド判定: ↑ 緑色 = 上昇トレンド(価格がEMA55の上 + EMA55が上昇中)
DRAGON BANDS Z – トレンド・市場コンセンサス分析インジケーター 市場をひと目で把握。3本のライン。4つの視覚的な状態。 Dragon Bands Zは、トレンド、ボラティリティ、モメンタムに関する複数のテクニカル分析ツールを1つのチャネルに統合し、チャート上で市場分析をシンプルに行えるように設計されたインジケーターです。 複数のインジケーターや独立したウィンドウを表示する代わりに、上限バンド、中央ライン、下限バンドの3本で市場の状態を表現します。これらのラインは、市場環境の総合的な判断に応じて同時に色が変化します。 色の見方 緑: 強気コンセンサス。市場の方向性とモメンタムがともに上昇を示しています。 赤: 弱気コンセンサス。市場の方向性とモメンタムがともに下降を示しています。 黄: 方向性の力が不十分、または市場が収縮状態にあります。保ち合い局面を示唆します。 グレー: テクニカル指標の判断が一致していません。より明確な確認を待つことが推奨されます。 色は市場の状態を表し、チャネルは価格周辺の複合的なボラティリティを示します。 主な特徴 ハイブリッドチャネル: Bol

Meta Cipher A:価格アクションのための高精度オーバーレイインジケーター Meta Cipher A は、人気のある Market Cipher A のコンセプトを MetaTrader 5 に導入した高精度のオーバーレイ型インジケーターです。価格チャート上に先行シグナルを直接表示するよう設計されており、 8本のEMAリボン 、WaveTrend分析、そして8種類の異なるシグナルを組み合わせることで、エントリーやエグジット、リスクの高い環境を事前に把握できます。 Meta Cipher A は単体でも強力なツールですが、 Meta Cipher B と組み合わせることで、より深い分析と確認が可能になります。
機能概要 動的なEMAをトレンドベースのカラーで描画し、視覚的な分かりやすさのために塗りつぶしエリアを採用したオーバーレイシステムです。さらに、 Blood Diamond (反転シグナル)、 Yellow Cross (操作警告)、 Blue Triangle (継続パターン)など8種類の特殊シグナルを備えています。 WaveTrendオシレーターはバックグラウンドで

Order Block Pro (MQL5) – バージョン 1.0 作成者: KOUAME N'DA LEMISSA
プラットフォーム: MetaTrader 5 説明: Order Block Pro は、チャート上の**強気および弱気のオーダーブロック(Order Blocks)**を自動で検出する高度なインジケーターです。小さな保ち合いローソク足と、その後の強いインパルスローソク足を分析することで、価格が加速する可能性のある重要なゾーンを特定します。 トレーダーに最適: 正確なエントリーとエグジットポイントを特定したい方。 動的なサポートおよびレジスタンスゾーンを把握したい方。 リスク管理と取引戦略を向上させたい方。 主な機能: 強気OB検出:
保ち合いローソク足の後、強い上昇が発生した場合、緑色の矢印で表示。 弱気OB検出:
保ち合いローソク足の後、強い下落が発生した場合、赤色の矢印で表示。 完全にカスタマイズ可能: 保ち合いローソク足の最大実体比率 ( BodyMaxRatio ) 次のローソク足の最小比率で動きを確認 ( NextCandleMinPct ) チャー

SRT Levels Pro Indicator — Support, Resistance & Trend Levels (Visual Trade Ideas & Alerts)
Brief description SRT Levels Pro is a powerful on-chart indicator that reads user-drawn Support, Resistance, Channels and Trend lines/zones and turns them into actionable trade ideas (Breakout, Bounce, Retest). It scores level strength, provides entry/stop/target suggestions (ATR or dynamic stops), and shows a compact dashboard and on-chart visual trade ideas. Alerts include pop-ups, email, push . Thi
ChartMaster Heikin Ashi with Pivot Indicator for MT5 Take your trading to the next level with ChartMaster Heikin Ashi with Pivot Indicator , a powerful tool that combines the clarity of Heikin Ashi candles with advanced pivot-point analysis. This indicator is designed for traders who want to identify market trends, reversals, and key support/resistance zones with precision. Key Features: Heikin Ashi Visualization – Smooths out market noise for cleaner trend identification.
Automatic Pivot
SNIPER SALES COPY Tired of Spraying and Praying? Get the Sniper's Edge with the Sniper Eye Indicator.
From Trader to Tactician: Execute Trades with the Precision of a Market Sniper.
The market is a battlefield. Most traders are like infantry—firing wildly, hoping a shot lands. They're plagued by noise, false signals, and emotional decisions that decimate their accounts.
It's time to change your role. It's time to become a Sniper.
Introducing the Sniper Eye Indicator for MetaTrader 5. This i

Chandelier Indicator for MetaTrader 5 (MT5) Check all of our products from the link below:
All Products Specifications Platform: MetaTrader 5 (MT5) Type of Application: Custom Technical Trading Indicator Level: Intermediate Timeframes: All Timeframes (Multi-Timeframe Support) Trading Styles: Scalping, Day Trading, Swing Trading, Position Trading Markets: Forex, Stocks, Commodities, Indices, and Cryptocurrency What does this indicator do? The Chandelier Exit Indicator for MT5 is a powerful tren
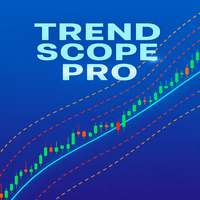
Trend Scope Pro – Precision Linear Regression Channels for Smarter Trading
Trend Scope Pro is a powerful trading indicator built on the concept of Linear Regression Channels, designed to give traders a crystal-clear view of market trends, volatility, and potential reversal zones. This professional-grade tool brings advanced statistical analysis right onto your MetaTrader 5 charts, helping you make smarter, more confident trading decisions.
Unlike traditional moving averages or static trendlin
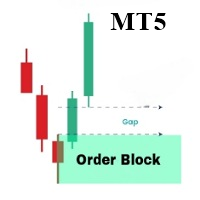
OrderBlock Analyzer は、MetaTrader 5 (MT5) 用にカスタマイズされたインジケーターで、価格チャート上のオーダーブロック(Order Blocks)を検出し、ハイライトします。このインジケーターは、市場の主要な構造を特定するのに役立ち、反転や継続の可能性のある領域を示します。OrderBlock Analyzer は、マーケットの動きに基づいて、自動的にオーダーブロックを描画し、上昇と下降のブロックを異なる色で区別します。 主な機能: 上昇および下降オーダーブロックの検出とマーキング。 グラフ上でリアルタイムにオーダーブロックを更新し、トレーディングのチャンスを迅速に特定します。 オーダーブロックの色、ボーダーライン、ラインスタイルのカスタマイズが可能です。 ボーダーラインの色と厚さの柔軟な設定。 このインジケーターは、トレンドや反転に基づいたトレーディング戦略を使用するすべてのタイプのトレーダーに最適です。
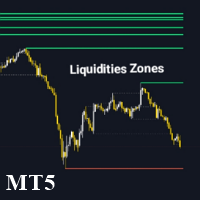
Liquidity Zone Detectorは、ZigZagインジケーターを使用して市場の重要な流動性ゾーンを特定し、強調するために設計された高度なテクニカルインジケーターです。このツールは、ZigZagによって検出された高値と安値にトレンドラインを描画することで、重要な流動性が存在する可能性のある価格レベルを特定します。Liquidity Zone Detectorは、流動性の蓄積や放出に基づいて、トレンドの反転や継続の可能性があるエリアを特定するのに役立ちます。 主な機能: 自動流動性ゾーン識別 : ZigZagインジケーターによって特定された高値と安値にトレンドラインを描画します。 高度なカスタマイズ : 流動性ラインの色、厚さ、スタイルを調整可能です。 動的な色変更 : 流動性レベルが突破された時にラインの色を変更するオプションがあります。 調整可能なZigZagパラメータ : より正確な検出のために、ZigZagの深さ、偏差、バックステップを調整できます。 Liquidity Zone Detectorは、市場の構造を分析し、重要な価格変動が発生する可能性のあるゾーンを特定

BEHOLDER – THE INDICATOR THAT REVEALS HIDDEN PATTERNS IN TIME THE REAL TRADER’S PROBLEM: TEMPORAL BLINDNESS
Every week, thousands of traders face the same dilemma: A flood of economic events (NFP, CPI, Interest Rates, Retail Sales…)
Very little time to analyze correlations
Decisions made on “gut feeling,” without reliable historical context Trying to do this manually is insane:
Scrolling back through dozens of weeks on the calendar
Comparing event by event
Trying to calculate patt
Pivot Fibo Ranges v2 is a technical indicator designed to provide a clear and structured visualization of Fibonacci levels combined with daily price zones , helping traders identify reversal points, supports, and resistances based on the market’s opening time. Ideal for traders who seek simplicity and precision , the indicator automatically draws daily reference ranges (limits, retracements, bands, and Fibonacci levels), allowing for an objective analysis of intraday price movements. Overview
Haven ZScoreオシレーター は、価格が平均値から異常に乖離したことを特定するために設計された、強力な統計的オシレーターです。このインジケーターは単に価格を追うだけでなく、現在の価格が統計的にどれほど重要であるかを測定し、買われすぎ/売られすぎのゾーンを高精度で特定し、潜在的なトレンドの転換点を見つけることができます。 このツールは、データ駆動型のアプローチを好み、調整やトレンド転換の可能性が最も高い瞬間に市場に参入することを目指すトレーダーにとって、不可欠なアシスタントになります。 その他の製品 -> こちら . 主な特徴: 統計的アプローチによる分析: 固定レベル(例:RSIの70/30)を使用する従来のオシレーターとは異なり、Haven ZScoreオシレーターは標準偏差を使用します。これにより、現在の価格位置が最近の動きに対してどれほど極端であるかを客観的に評価できます。 明確な極値ゾーン: インジケーターは、設定されたしきい値の上と下の領域を自動的に塗りつぶします。これらの色付きのゾーンは、市場が強い買われすぎ(赤色ゾーン)または売られすぎ(緑色ゾーン)の状態にある

Here our more valuable tools
SMC Trend Trading , Easy SMC Trading , Institutional SMC Architect Volume Analysis Tools , Volume flow Profile , Market volume profile , FVG with Volume , Liquidity Heatmap Profile , Volume Spread Analysis Professional trend-following indicator with comprehensive visualization and control panel Key Features: Advanced Trend Detection Reliable Half Trend algorithm for precise trend identification Color-coded trend lines (Blue for bullish, Orange for
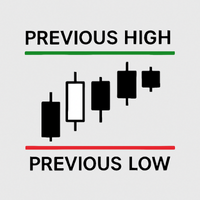
Previous Candle High/Low with Custom Time and Timeframe This indicator automatically plots two horizontal lines on your chart, showing the high and low of the most recent completed candle from a user-selected timeframe. It is designed for traders who want to clearly mark important intraday or higher-timeframe levels without manually drawing them. At the start of each trading day, the indicator waits until your chosen activation time (HH:MM server time). Once that time is reached, it deletes Prev
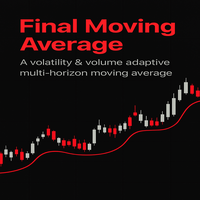
Final Moving Average – Indicator Description
The Final Moving Average is a next-generation technical tool designed for traders who demand precision, adaptability, and clarity in their charts. Unlike traditional moving averages that use fixed periods and often lag behind the market, this indicator is built on a smart adaptive algorithm that dynamically adjusts itself based on market volatility and trading volume.
How to Read the Indicator
Line Direction:
An upward-sloping Final Moving Averag

Weis Wave Volume Indicator for MetaTrader 5 (MT5) Check all of our products here: All Products Specifications Platform: MetaTrader 5 (MT5)
Type: Custom Technical Trading Indicator
Level: Intermediate
Timeframes: All Timeframes (Multi-Timeframe Support)
Trading Styles: Scalping, Day Trading, Swing Trading, Position Trading
Markets: Forex, Stocks, Commodities, Indices, and Cryptocurrencies What Does This Indicator Do? The Weis Wave Volume Indicator for MT5 is a powerful Price Action + V
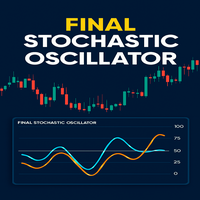
Final Stochastic Oscillator is a next-generation upgrade of the classic stochastic indicator, enhanced with adaptive smoothing, ADX filtering, and volume confirmation. Designed for traders who want more than just overbought/oversold signals, this tool intelligently adapts to market volatility and trend strength, giving you a clearer, more reliable reading of price momentum.
Unlike the standard stochastic, which can produce frequent false signals in choppy conditions, the Final Stochastic Osci

Overview Market Structure Analysis Indicator MT5 Structure Analysis Indicator automatically identifies Market Structure based on Smart Money Concepts (SMC). It clearly displays Break of Structure (BoS), Change of Character (CHoCH), Higher Highs, Higher Lows, Lower Highs, and Lower Lows in real-time. Key Features Automatic Market Structure Detection Break of Structure (BoS): Price breaks previous structure in trend direction Change of Character (CHoCH): Trend reversal signals Higher Highs/Lower L

QUANTUM PHASE - Advanced Quantum Resonance Trading Signals for MT5 Revolutionize Your Trading with Quantum-Inspired Cycle Synchronization! QUANTUM PHASE is a cutting-edge, non-repainting indicator designed for MetaTrader 5, harnessing the power of Quantum Phase Resonance (QPR) to deliver precise buy/sell signals based on synchronized market cycles. Inspired by quantum mechanics principles, this indicator detects phase alignments across multiple dominant cycles, filtering out noise for high-conf

## Chapter 1: Introduction
The AI-Trend Oscillator is a versatile and powerful indicator designed to assist traders in identifying market trends, reversals, and momentum. This indicator leverages complex calculations and smoothing techniques to provide actionable signals. The AI-Trend Oscillator can be used for intraday, swing, and positional trading, making it suitable for various market conditions and trading styles.
## Chapter 2: Calculations Overview
The AI-Trend Oscillator
Synchronize symbol changes across multiple charts instantly and effortlessly. Overview Chart Symbol Synchronizer is a professional tool for traders who work with multiple charts simultaneously. Change the symbol on your master chart, and watch all your follower charts update automatically in real-time. Perfect for multi-pair analysis, correlation trading, and efficient workspace management. Key Features Instant Synchronization - Updates all linked charts within 200ms Multiple Independent Gro

Description – ETE DETECTOR POWER v5.0(ヘッド&ショルダープロ) 「ヘッド&ショルダー」パターンの自動検出 PUISSANCE DU DÉTECTEUR ETE v5.0 , トレーダーが 市場の大きな反転を事前に捉えるた めのプロ仕様ツールです。最も強力なチャートパターンの1つである ヘッド et ショルダー(H&S)と逆ヘッド&ショルダー を利用します. Description du produit (MaxObjects) 、混雑したチャートや複数時間枠でもスムーズかつ見やすく表示されます。 主な機能 リアルタイム自動検出: 通常H&S(売り) と 逆H&S(買い) Mots clés : 肩, 頭, ネ ッ ク ラ イ ン 自動描画: 反転ゾーン (赤=売り、緑=買い) ACHETER/ VENDRE 循環オブジェクトプール によるスマート管理 完全カスタマイズ可能:ローソク本数、最小距離、許容差、最大パターン数、矩形スタイル、マーカーサイズ・色 トレーダーへの利点 時間節約:市場を自動分析
度:許容範囲調整

US30 Scalper Signal Pro — ダウ30専用スキャルピングシグナル US30 Scalper Signal Pro は、ダウ30指数(US30 / DJ30)の M1スキャルピング専用 に設計された高精度インジケーターです。 トレンドの初動をリアルタイムで捉え、市場ノイズを徹底的に排除することで、安定したトレード判断をサポートします。 主な特徴 US30専用ロジック – インデックス特有の値動きに最適化 初動キャッチ能力強化 – 1分足スキャルピングに特化 明確な矢印サイン – 誰でも直感的に使えるシンプル設計 リアルタイムアラート搭載 – サウンド / ポップアップ / プッシュ通知対応 短期トレード対応 – 推奨時間足 M1(スキャルピング特化)、M5でデイトレ活用も可能 高精度フィルタリング – ダマシ削減で勝率を底上げ なぜ US30 Scalper Signal Pro なのか? US30(ダウ30指数)は、ニューヨーク市場を代表するインデックス。 そのスピードと値幅は「一撃の爆益チャンス」を秘めています。 だか
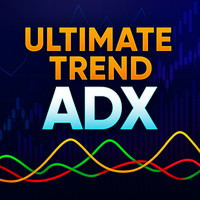
Ultimate Trend ADX is a powerful and refined version of the classic Average Directional Index (ADX), designed to give traders a clearer, more dynamic view of market trends and momentum. Unlike the standard ADX, this enhanced tool applies advanced smoothing techniques (EMA or KAMA) and introduces scaling options to make the indicator lines more responsive and visually impactful. The result is a professional‑grade indicator that helps you identify strong trends, spot reversals, and confirm entrie

Profit maximizer (PMax) indicator for MetaTrader 5 (MT5) Check all of our products here: All Products
Specifications Platform: MetaTrader 5 (MT5)
Type: Custom Technical Trading Indicator
Level: Intermediate
Timeframes: All Timeframes (Multi-Timeframe Support)
Trading Styles: Scalping, Day Trading, Swing Trading, Position Trading
Markets: Forex, Stocks, Commodities, Indices, and Cryptocurrencies
Settings & Parameters Source – source of price ATR Period Multiplier of ATR Moving Average
期間限定 無料ダウンロード NAS100 Scalper Signal Pro は、NASDAQ100専用に開発されたプロ仕様のスキャルピングインジケーターです。
シンプルな矢印サインに加え、 高精度フィルターを内蔵 することでノイズを軽減し、実戦向きのサインを実現しました。 主な特徴 M1・M5足に最適化 チャート上に矢印サインを表示 高精度フィルター搭載 (だまし削減・精度向上) アラート通知対応(ポップアップ / サウンド / プッシュ / メール) 複雑な設定は不要、導入後すぐに使用可能 スキャルピングから短期デイトレードまで対応 「シンプル × 高精度」 NAS100特化だからこそ可能になったシグナル精度を体感してください。 補足:レンジ相場ではシグナルが多く出る場合がありますが、爆発的なトレンド初動を逃さないための設計です。

月次ハイ&ロー ダイナミックレンジ + 流動性ゾーン v1.2
作成者: KOUAME N'DA LEMISSA 説明:
この強力なインジケーターで市場分析を変革しましょう。特徴は以下の通りです: 主要月次レベル: 高値(High)、安値(Low)、始値(Open)、終値(Close)で、最も重要なサポート・レジスタンスゾーンを特定。 ダイナミックハイ/ロー範囲: 価格の極端な動きを自動追跡し、重要な市場変動を検出。 流動性ゾーン: 流動性が集中するエリアを示す視覚的な矩形(Buy/Sell)。ゾーンの太さや色は完全にカスタマイズ可能で、チャート上での視認性を最大化。 全ての銘柄・ブローカー対応: Forex、株式、指数、暗号通貨で完璧に動作。 主な機能: 月次のHigh、Low、Open、Closeレベルを自動検出。 極端な動きを追跡するダイナミックハイ/ロー範囲の表示。 境界線の太さや色をカスタマイズ可能な視覚的流動性ゾーン。 すべてのタイムフレームに対応。 トレードスタイルに合わせて完全にカスタマイズ可能な設定。 インジケーター設定: Ref_Timeframe: レベル計算

Japonais (Japonais / 日本語) Booster Trading Pro par exemple : KOUAME N'DA
LEMISSA .
明 Trading de rappel Pro を使って市場分析を変革しましょう。複数のLa description de la situation est : Description du produit : Il s'agit d'un article : ダイ ナミックオープニングレンジ : Nom du produit : ダイナミックで色分けされた長方形で潜在的な買い・売りゾーンを視覚化。 主な特徴 すべての銘柄と時間軸に対応。 ダイナミックレベルを リアルタイム 更新. 柔軟なゾーン表示のために色や太さをカスタマイズ可能。 月次レベルとダイナミック範囲を明確に表示。 MetaTrader 5 est basé sur MetaTrader 5 . トレーダーへの利点 迅速な意思決定: 重要なゾーンを素早く特定可能。 Description du produit : Nom du produit :

GER40 Scalper Signal Pro — ドイツ株指数専用スキャルピングシグナル GER40 Scalper Signal Pro は、ドイツ株指数(GER40 / DAX40)の M1 スキャルピング専用に設計された高精度インジケーターです。 ロンドン市場・欧州時間の爆発的な値動きをリアルタイムで捉え、市場ノイズを最小限に抑えることで、直感的かつ安定したトレード判断をサポートします。 主な特徴 GER40専用ロジック – 欧州インデックスの特性に最適化 初動キャッチ能力強化 – M1スキャルピングに特化 明確な矢印サイン – 直感的に理解できるシンプル設計 リアルタイムアラート搭載 – サウンド / ポップアップ / プッシュ通知対応 短期トレード対応 – 推奨時間足 M1(スキャルピング特化)、M5でデイトレにも活用可能 高精度フィルタリング – ダマシ削減により実戦向きのシグナルを提供 なぜ GER40 Scalper Signal Pro なのか? GER40 はヨーロッパを代表する株価指数。 特に欧州時間の立ち上がりでは爆
Smart Multi-RSI Indicator for MetaTrader 5 (MT5) Check all of our products here: Seller - Mohammad Taher Halimi Tabrizi - taherhalimi - Trader's profile
Specifications Platform: MetaTrader 5 (MT5)
Type: Custom Technical Trading Indicator
Level: Intermediate
Timeframes: All Timeframes (Multi-Timeframe Support)
Trading Styles: Scalping, Day Trading, Swing Trading, Position Trading
Markets: Forex, Stocks, Commodities, Indices, and Cryptocurrencies What Does This Indicator Do? The Smart Mult
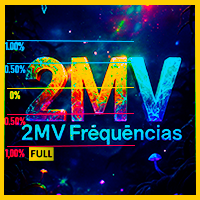
日中のパーセンテージ変動レベルを自動的にサポートおよびレジスタンスとして表示します — これは 2MV Frequencies Full インジケーターです。 Evandro Soares の独自手法に基づき、 サポートとレジスタンスゾーン を パーセンテージレベル (例: 0.50%、1%、1.50%) によってすばやく特定できます。これらは完全にカスタマイズ可能で、 反転、ブレイクアウト、レンジゾーン を高い精度と視覚的な明確さで予測します。 サポートとレジスタンスゾーン をすばやく特定。
市場が反応する前に 反転やブレイクアウト を予測。
複数のインジケーター を同じチャートに制限なく追加可能。
パーセンテージレベル を戦略に合わせて調整可能。 MetaTrader 5 に対応しており、 すべてのアカウントタイプ 、 ストラテジーテスター 、および Forex 、 株式 、 指数 、 B3 - ブラジル証券取引所 市場で完全に動作します。 ️ 使用のヒント: 無料デモ版 をダウンロードして、取引している 銘柄 でインジ
Get ALL my MT4 & MT5 indicators FREE — See how here
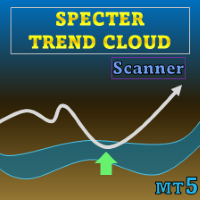
特別オファー : ALL TOOLS 、各 $35 ! 新ツール は $30 ( 最初の1週間 または 最初の3回の購入 )です! Trading Tools Channel on MQL5 :最新情報を受け取るため、私の MQL5 チャンネルに参加してください Specter Trend Cloud は移動平均に基づくトレンド可視化ツールで、市場の方向性と主要なリテスト機会を強調表示するよう設計されています。適応型平均にボラティリティ調整を組み合わせ、トレンド変化に応じて反転するカラー「クラウド」を生成し、進行中のトレンド下で価格が短期平均とどのように相互作用するかを追跡します。
MT5 版の詳細はこちら: Specter Trend Cloud MT5 Scanner MT4 版の詳細はこちら: Specter Trend Cloud MT4 Scanner その他の製品はこちら: All P roducts Key Features マル
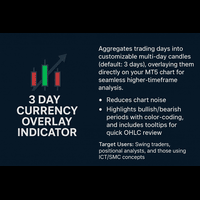
The 3-Day Currency Overlay Indicator aggregates trading days into customizable multi-day candles (default: 3 days), overlaying them directly on your MT5 chart for seamless higher-timeframe analysis. Ideal for forex, CFDs, indices and synthetics(deriv assets), it helps identify trends, support/resistance, and reversals without switching timeframes.
It displays 3Days timeframe just like every other timeframes.
It also accomodate for holidays, weekends or days with market closed in its calculati

Strategic Momentum EA is an automated trading system designed to identify and respond to short-term market movements using a momentum-based algorithm. It operates within predefined risk parameters and executes trades based on technical indicators without manual intervention. Functionality: The Expert Advisor monitors price action and volume shifts to detect potential entry points. It uses adjustable input parameters for risk management, trade frequency, and indicator sensitivity. The system is
ZigZag Fibonacci Master Indicator Master the Markets with Dual Fibonacci Intelligence ZigZag Fibonacci Master transforms complex market analysis into crystal-clear visual insights. This isn't just another ZigZag indicator - it's a complete trading intelligence system that combines precision swing detection, dual-layer Fibonacci projections, and smart distance calculations in one powerful tool. What Makes It Different? Three Tools in One Package: 1. Advanced ZigZag Engine Forget about market nois
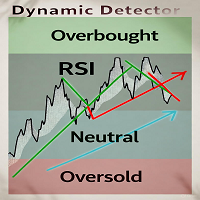
Dynamic Detector - Professional Trend and Signal Indicator This advanced indicator combines RSI and technologies to identify Overbought and Oversold zones in the market with precision. Key Features: Dynamic adaptive channels - automatically adjust to market conditions Clear visual signals - colored lines show trend direction Multi-level filters - reduce false signals Flexible settings - adapt to any timeframe and asset OB/OS zones - help identify entry and exit points Perfect for: Scalpers, da
Pivot Fibo Colors v2 is a technical indicator designed to provide a clear and structured visualization of Fibonacci levels combined with daily price zones , helping traders identify reversal points, supports, and resistances based on the market’s opening time. Ideal for traders who seek simplicity and precision in chart reading , the indicator colors the candles directly on the chart , showing daily reference zones (retracements, sideways movement, or trend continuation), allowing for an objecti
RSI Cyclic smoothed Indicator for MetaTrader5
To download all of our products, you can click this link: LINK
Introduction The RSI Cyclic smoothed Indicator is one of the leading indicators in the market, which helps you enter your trades through the RSI line’s interaction with an upper and a lower line. It is one of the best indicators for scalpers
Specifications platform metatrader5 (MT5) type custom technical trading indicator level beginner timeframes all timeframes from weekly to tradin

# Timeframepro - MT5 Candle Timer Countdown Indicator
## Overview Timeframepro is a professional MT5 indicator that displays a real-time countdown timer showing the remaining time before the current bar closes and a new bar forms. It provides essential time management functionality for traders who need to track candle closure times accurately.
## Key Features
### ️ Core Functionality - **Real-time Countdown Timer**: Displays remaining time in MM:SS format (e.g., "Time: 12:45") - **Server Ti

GOLD Trap Hunter Pro — 高精度リクイディティ・トラップ検出インジケーター GOLD Trap Hunter Pro は、GOLD(XAUUSD)専用に設計された次世代型の逆張り・転換検出インジケーターです。
高精度フィルターを搭載し、相場の“行き過ぎ”と“反転の兆し”をリアルタイムで視覚化します。 主な特徴 リクイディティトラップ検出 — 大口のフェイクブレイクを高精度に察知
仮シグナル+確定シグナルの二段階表示 — 初動と確定を明確に分離
リアルタイムアラート搭載 — ポップアップ・サウンド・プッシュ通知対応
高精度フィルター内蔵 — ノイズを極限まで抑制し、実戦で通用する精度を実現
シンプルかつ直感的なデザイン — 初心者でも即運用可能 推奨環境 対象銘柄 :XAUUSD(GOLD) 時間足 :M1(スキャルピング推奨) 相性の良い時間帯 :ロンドン時間・NY時間のボラティリティ帯で最高パフォーマンスを発揮 GOLD Trap Hunter Pro はこんな方に最適 「急反発の起点を正確に捉えたい」 「フェイクブレイ
Liquidity Sweep Detector – Detailed Description and Installation Guide Overview
Liquidity Sweep Detector is a powerful and versatile technical indicator designed to help traders identify stop hunts and liquidity grabs across any financial instrument and timeframe. Stop hunts occur when price temporarily breaches key swing highs or lows, triggering stop-loss orders from retail traders, before reversing direction. By visually highlighting these events, this indicator allows traders to better unde

SCALPFLASH-X
Where Fibonacci Precision Meets RSI Intelligence.
Next-gen trading system combining Adaptive Fibonacci Pivots, RSI Heat Mapping, and Smart Candle Analytics. Detect market dominance, momentum shifts, and reversal zones in real time across multiple timeframes. Institutional accuracy, retail simplicity — built for speed, clarity, and precision.
Advanced Multi-Timeframe Fibonacci & RSI-Driven Market Intelligence System ScalpFlash-X — A next-generation trading system combining Fibonacc
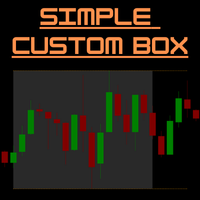
SimpleCustomBox – MT5 セッションボックス & 高値/安値ライン インジケーター 概要:
SimpleCustomBox は、MetaTrader 5 用の強力で使いやすいトレーディングインジケーターです。
チャート上で特定の取引セッションを視覚的に強調表示でき、カスタム時間範囲を設定し、そのセッションの高値・安値を即座に確認できます。
明確なビジュアル境界により、よりスマートな取引判断をサポートします。
デイトレーダー、スキャルパー、または日中の値動きに基づくトレーダーに最適です。 主な機能: カスタムセッション時間: 任意の時間範囲(例:02:00~06:00)を色付きの長方形でハイライト表示。 動的セッションボックス: 日ごとに自動更新され、複数の過去日を表示して履歴分析が可能。 高値/安値ライン: セッションの高値・安値ラインを描画し、指定した時刻まで延長可能(例:14:00 まで)。 カスタマイズ可能なビジュアル: ボックスの色、線の色、線の太さ、線のスタイル(実線・点線・破線など)を自由に調整。 自動更新: ボックスとラインはリアルタイムで更新され、最
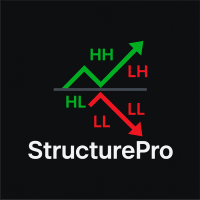
Descripción del indicador StructurePro 50 StructurePro 50 es un indicador avanzado de Market Structure diseñado para traders que buscan identificar de manera clara y objetiva los puntos clave de la acción del precio.
Con él podrás detectar automáticamente Higher Highs (HH), Higher Lows (HL), Lower Highs (LH) y Lower Lows (LL) , así como rupturas de estructura ( BOS ) y cambios de carácter ( CHoCH ). El indicador simplifica la lectura del mercado y elimina la subjetividad, permitiéndote cent
日本語 – VVMTインジケーター:あなたの完全なマーケットダッシュボード 市場状況を瞬時かつ詳細に把握できる、強力なオールインワン分析ツール。
複数の複雑なインジケーターを同時に扱う必要はもうありません。
VVMTは市場を明確かつ一元的に視覚化します。 VVMTインジケーターはリアルタイムで 4つの主要な市場要素 を分析し、直感的なビジュアル形式で表示します。
これにより、市場の動きを一目で把握できます。 VVMTの4つの柱 ボリューム(V): 各価格変動の背後にある強さと信頼度を測定します。 ボラティリティ(V): 活動量の高低を特定し、リスクとチャンスを評価します。 モメンタム(M): 価格変化のスピードと加速度を評価し、反転または継続を予測します。 トレンド(T): 市場の基調トレンドの強さと方向を判断し、その流れに沿って取引します。 主な特徴 4つの分析を1つに統合: 4種類の強力な指標を1つの整理されたウィンドウに統合し、時間とチャートスペースを節約。 即時の視覚的判断: 色分けにより、市場状態が強い(ホット)か弱い(コールド)かを瞬時に識別。 完全カスタマイズ可能: 取引

Channel Trend Bands – A Comprehensive Indicator for Market Analysis Simple to Use, Effective in Application User-Friendly and Suitable for All Traders This indicator stands out due to its straightforward functionality. Whether you're a beginner exploring the market or an experienced trader refining your strategy, this tool offers valuable insights. Using a Triangular Moving Average (TMA) with additional ATR-based bands , it provides structured market data to support well-informed decision-
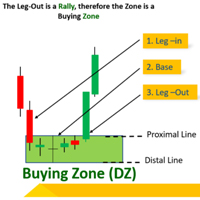
Have you ever been confused about identifying Supply and Demand zones? This indicator will work effectively to indicate the exact potential Supply and Demand zones. Core Features Smart 2-Candle Pattern Detection Identifies high-probability supply (bearish) and demand (bullish) setups with built-in ATR and candle-body filters to reduce noise.
Color-coded by Timeframe & Direction
Bullish arrows (Demand zones):
Pale Green – M15
Aqua – M30
Lime – H1
Navy – H4
Bearish arrows (Suppl

ImbalanceCandleAnalyzer: Your Algorithmic Edge on ICT Imbalances Stop Guessing. Start Trading with the Precision of Professional Smart Money. Dear Trader, if you're familiar with the ICT strategy, you know that Price Imbalances (or FVGs) are the cornerstone of high-probability entries. These are the "roadmaps" left by smart money. But manually hunting for them on the chart wastes hours, leads to missed opportunities, and human error. What if you could automate this process? The ImbalanceCandle
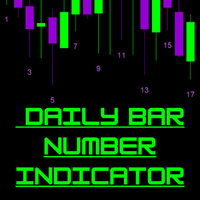
紹介:このMT5インジケーターは、トレーダーが日次ローソク足の番号を簡単に追跡できるようにします。 MT5日次ローソク足番号インジケーター 日次ローソク足番号インジケーターは、MetaTrader 5のチャート上に各ローソク足の連番を直接表示します。トレーダーは日中のバー数を追跡し、セッションパターンを簡単に分析できます。 主な機能: 各ローソク足の下に番号をリアルタイムで表示。 色、フォント、サイズをカスタマイズ可能。 偶数番号を非表示にして見やすくするオプション。 カスタム取引セッションに対応(例:08:00–18:00)。 表示日数を調整可能。 軽量で全ての時間足に対応。 注意事項:
低い時間足で最適なパフォーマンスを得るには、表示日数を制限してください。長時間稼働後、若干のずれが発生する場合があります — チャートを更新すれば修正されます。 使用方法:
ローソク足の順序を追跡したり、日中の動きを分析したり、FX、指数、商品、暗号通貨における繰り返しのセッションパターンを特定したりできます。
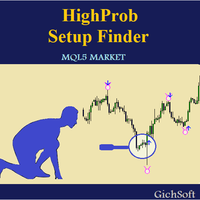
HighProb Setup Finder
Developer: GichSoft 2025
Overview
The HighProb Setup Finder is a precision-engineered market structure intelligence tool that visually reveals order flow transitions and reversal footprints directly on your chart.
It detects liquidity sweeps — where price grabs liquidity above or below a previous swing before reversing to target the opposite side. This helps traders identify institutional footprints and anticipate the next high-probability setup with confidence.
Cor

Hull Moving Average (HMA) The Hull Moving Average (HMA) is a refined version of the traditional moving average, designed to minimize lag while keeping the line smooth and precise .
Developed by Alan Hull , this indicator provides a faster and more accurate trend signal than standard moving averages such as the SMA or EMA. How It Works The Hull Moving Average uses a Weighted Moving Average (WMA) in a special way to reduce delay and smooth price movement.
Its calculation follows three main steps:
Signal Strike is a professional trading indicator designed for MetaTrader 5 that delivers clear, high‑confidence entry signals directly on your chart. Built with advanced logic that combines trend, momentum, volatility, and volume confirmation, this tool helps traders identify precise BUY and SELL opportunities with confidence.
Unlike generic indicators, Signal Strike is engineered to filter out indecision candles and weak setups. When conditions align, the indicator plots entry, stop loss, an

Quantified Trendline Strength (QTS) Overview
Quantified Trendline Strength is a technical analysis tool that automatically detects and evaluates trendlines based on price swing structures. It provides a visual and quantitative way to understand how significant each trendline may be, allowing traders to make more structured observations of market behavior. Indicator Type Category: Trend / Level Detection Display: Chart window (overlay indicator) Purpose: Identify and evaluate trendlines, support
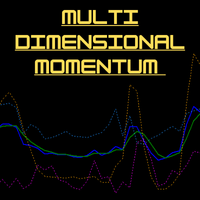
MDM indicator is the IMM (Integrated Market Momentum) line, which oscillates between 0 and 1. Here's how to interpret it: General Interpretation of the IMM Line : The indicator calculates this final value by combining momentum, trend, volume, aggressiveness, and price strength scores . Generally, readings above 0.50 suggest a strong bullish zone, while readings below 0.5 0 suggest a strong bearish zone. The area between 0.45 and 0.55 is often considered neutral or consolidating. Generating Tradi
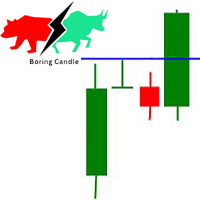
Potential Supply & Demand Compression Zone Indicator
This indicator identifies potential compression (supply & demand) zones across multiple timeframes. It highlights areas where the market has been consolidating and is likely to build up energy before a breakout.
When aarrow appears, it marks a potential breakout from the compression zone. Traders can then consider placing buy or sell orders in the direction of the breakout, following their own risk-management rules.
The indicator is design

Momentum Confluence Zone (MCZ) – MetaTrader 5 Indicator Overview
Momentum Confluence Zone is a custom chart indicator for MetaTrader 5.
It calculates dynamic price zones using a combination of moving average, volatility, and momentum measures. The indicator aims to assist traders in observing areas where price behavior and momentum interact. Operation Logic The indicator uses an Exponential Moving Average (EMA) as a reference. Dynamic zones are calculated above and below the EMA using the Avera

Precision Arrows – TPとSLを内蔵したスマートエントリーシグナル Precision Arrows は、 正確性・明瞭性・信頼性 を求めるトレーダーのために設計された高性能トレーディングインジケーターです。
高確率の買い・売りシグナルを検出し、自動的に テイクプロフィット(TP) と ストップロス(SL) のレベルを設定。
FX・株価指数・暗号資産・シンセティックインデックス など、あらゆる市場で規律的かつ一貫したトレードをサポートします。 このインジケーターは、精密なシグナル検出、インテリジェントなフィルタリング、そしてマルチタイムフレームトレンドダッシュボードを組み合わせ、あらゆる相場環境に対応する完全なトレーディングソリューションを提供します。 期間限定オファー Precision Arrows は現在、 75ドル(永久ライセンス) でご利用可能です。
(通常価格: 199.99ドル / オファー延長中) 重要: ご購入後すぐにご連絡ください。使用手順と 特別ボーナス をお送りします。 主な機能 3つのトレードモード
お好みのスタイルに合わせて、 スキャルピ

Good old UT BOT converted from TradingView script by ' QuantNomad ', initially by ' Yo_adriiiiaan ' and ' HPotter ' - so you can bet this is powerful tool. If you know, you know. This is top of the line, while keeping it really simple.
Main function: trend identification with trend switch points , created by EMA(source) and ATR -source is CLOSE PRICE with option to use HEIKEN ASHI chart instead, for this you need "Heiken Ashi" indicator - its available as free download by MetaQuotes
One of th

The Follow Line Indicator is an essential technical analysis tool that provides a clear, immediate visualization of the trend while detecting high-probability reversals in real-time. By combining adaptive price tracking with clear visual alerts, it transforms complex data into actionable trading signals. Key Features Dynamic Trend Line: Tracks the market's prevailing direction, automatically adjusting to each new price extreme. Clear Colors: The line turns Blue during uptrends and Red during dow

Perfect Entry Price — The Smartest Way to Time Your Trades
Perfect Entry Price is a next-generation indicator designed to help traders identify the most accurate and reliable price levels for market entries. It automatically scans market structure, volume dynamics, and price behavior to locate zones where a reversal or continuation is most likely to happen. The indicator is ideal for traders who want to enter the market exactly when the probability is highest and risk is lowest — whether you a

Adaptive Market-Structure Grid (AMSG) Indicator Overview
The Adaptive Market-Structure Grid (AMSG) is a custom indicator for MetaTrader 5 designed to visualize evolving market structure through adaptive grid levels.
It detects price swings, constructs dynamic grids, and adjusts to changing volatility conditions.
The indicator helps traders observe how market structure shifts between trending and ranging phases. How It Works
AMSG continuously evaluates price data to identify swing highs and low
MetaTraderマーケットは、他に類のない自動売買ロボットやテクニカル指標の販売場所です。
MQL5.community ユーザーメモを読んで、取引シグナルのコピー、フリーランサーによるカスタムアプリの開発、支払いシステムを経由した自動支払い、MQL5Cloud Networkなど、当社がトレーダーに対して提供するユニークなサービスについて詳しくご覧ください。

取引の機会を逃しています。
- 無料取引アプリ
- 8千を超えるシグナルをコピー
- 金融ニュースで金融マーケットを探索