 MetaTrader 5
 エキスパート
 インディケータ
 ライブラリ
 ユーティリティ
 ウィジェット
 ルール
YouTubeにあるマーケットチュートリアルビデオをご覧ください
ロボットや指標を購入する
仮想ホスティングで
EAを実行
EAを実行
ロボットや指標を購入前にテストする
マーケットで収入を得る
販売のためにプロダクトをプレゼンテーションする方法
MetaTrader 5のための無料のエキスパートアドバイザーとインディケータ - 58
 自動売買ロボットとインジケータを使用して、外国為替取引の収益性を高めます。 自動売買ロボットを使用すると、取引の開始と終了を自動化でき、インジケータは市場の行動をより正確に予測するのに役立ちます。
このページには、MetaTrader5アプリケーションのカタログが掲載されています。

Rich powerful mt5 expert advisor contain 13 super advanced and strong trading strategies you will find all in that amazing ea you can make high Winrate trades less drawdown and control everything through amazing parameters and inputs so long options will be under your control by one click you can use that ea even you are beginner or expert in trading it is so easy to use As advice after you purchase that high quality ea and you want to attach to mt5 go to inputs then double click on strategy sel
FREE

This software uses classical rules to the entry and exiting of the trades when trading using the ichimoku style. The EA trades in the current timeframe on the charts. According to testing results yielded more than $1k using the 1hr chart in the past year. The EA should not be expected to perform well when the price is ranging and too volatile. The best results should be achieved when the EA is turned on in the trending market only and under a solid money management plan. The results shown on the
FREE

Вилка Нео v5, разрабатывалась для торговой системы "Оракул", но постепенно дополнялась, например - углами Ганна и другими опциями... Можно создавать графические объекты с заданным цветом, стилем и толщиной, такие как: прямоугольники с заливкой и без, отрезки трендлиний и нестандартный инструмент - "вилка Нео" в виде трезубца, так же есть возможность интерактивно настраивать цветовую палитру прямо с графика, настраивать видимость объектов для разных ТФ, толщину и стили...
Панель переключается кл
FREE

A manual trade manager with a live on-chart preview. Plan every trade visually: entry, stop and up to four take-profits appear as draggable lines with filled risk/reward zones — lot size, R-multiple and money value update in real time. One click places it all. Market, Limit and Stop orders at the press of a button Position sizing by percent, money risk or fixed lot Up to 4 partial positions, each with its own TP and a shared SL Stop by pip/ATR distance or anchored to the last swing high/low Auto
FREE
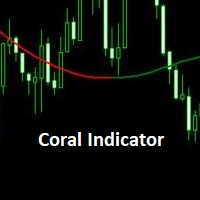
Coral trend is a trend-following indicator that is widely popular among FOREX traders . It is usually used as a confluence with other indicators. It uses combinations of moving averages with complex smoothing formulas! It has two configurable parameters: Coefficient - smoothing ratio (*)
Applied price Calculation: Coral = (-0.064) * B6 + 0.672 * B5 - 2.352 * B4 + 2.744 * B3
FREE

XAU London Breakout H1 Expert Advisor for MetaTrader 5 — Gold / XAUUSD focus
Version: 1.00 What it is XAU London Breakout H1 is an Expert Advisor for gold on the H1 chart. London session range breakout participation for gold H1. Built for structured automated participation — not grid , not martingale . Evaluate on your broker and risk profile before any live use. This product is a technical system . Exact thresholds and entry equations remain internal product design and are not published here.
FREE
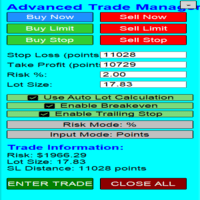
Overview Are you tired of complex manual calculations, emotional execution errors, and the constant fear of risking too much? The Advanced Trade Manager (ATM) is your all-in-one solution, a professional-grade Expert Advisor for MetaTrader 5 designed to give you institutional-level control over every aspect of your trade. From flawless risk calculation to intelligent, one-click execution, the ATM EA streamlines your entire trading process, allowing you to focus on your strategy, not the mechanics
FREE

Automated Utility & Risk Assistant (AURA) is the ultimate trading utility for MetaTrader 5, engineered for traders who demand precision, discipline, and total control. This is not just an order placement tool; it is a comprehensive Risk Infrastructure & Account Guardian (TradeCop) designed to eliminate emotional decision-making, automate complex math, and safeguard your account against prop-firm violations and execution errors. Whether you are a retail trader, a scalper, or a Prop-Firm challen
FREE
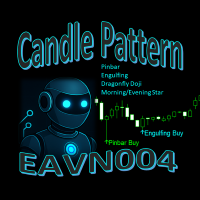
EAVN004 – Trading with Pinbar, Engulfing, Dragonfly Doji, and Morning Star Candlestick Patterns In the world of financial trading, simplicity is sometimes the key to effectiveness . EAVN004 is designed based on the principle of identifying well-known candlestick patterns such as Pinbar , Engulfing , Dragonfly Doji , and Morning Star . These patterns help traders detect potential trend reversals and make informed decisions to open BUY or SELL positions. EAVN004 offers customizable settings for St
FREE

この三か月のトレードに、いくらかかったかご存じですか。いくら勝ったか負けたかではなく、一つひとつのポジションを開いて閉じるのにいくらかかったか、です。このツールは口座にすでにある決済済みの履歴を読み、それを金額で示します。各約定の瞬間に提示されていたスプレッド、エントリーとイグジットのスリッページ、手数料、スワップ。事前に何かを入れておく必要はありません。読むだけで、注文を送ることは決してありません。
見えていないお金
トレード一回につき、四つの費用がかかります。二つは取引報告書に出てきます。残りの二つは損益の中に隠れていて、だからほとんど誰も足し合わせません。
- スプレッド。その瞬間の値段より少し高く買い、少し安く売っています。必ず。損益からすでに引かれているので、費用として表に出ることがありません。 - スリッページ。ある値段を求めて、別の値段で約定します。とくにストップが作動したときや、相場が速く動いたときに起こります。 - 手数料。ブローカーが取引に対して取るもの。多くの人が唯一数えている費用です。 - スワップ。ポジションを翌日に持ち越したときに引かれる、あるいは
FREE
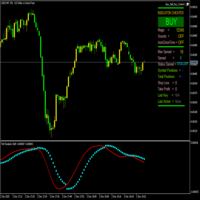
ParabolicSariTriX は、トレンドオシレーターのTriX(トリプル指数移動平均)とパラボリック反転システム(Parabolic SAR)を組み合わせたハイブリッド指標です。この指標は別ウィンドウに表示され、トレンド反転シグナルに基づいてエントリーとイグジットのポイントを識別するように設計されています。SARポイントの形で明確な視覚的シグナルを提供し、市場のトレンドが変化するにつれてTriXラインに対する位置が変わります。 SARポイントは以下のように配置されます: 下降トレンド時 :TriXラインの 上 (売りシグナル) 上昇トレンド時 :TriXラインの 下 (買いシグナル) この指標は実際の価格ではなくTriXの値に基づいて計算されるため、 価格ポジションのトレーリングストップとして使用することはできない ことに注意が必要です。その主な目的は、TriXオシレーターのトレンド反転をシグナルすることで、他の分析ツールと組み合わせた際に取引判断のフィルターとして機能します。 この指標はトレンドが明確な市場で最も効果的に機能し、一方で統合期間には偽のシグナルを生成する可能性が
FREE

アカウントダッシュボードの統計
これは、アカウントの損益を把握するために集中的に表示するのに役立つツールであり、それを追跡することができ、また、得られるリスクを知るためのドローダウン分析も提供します。 アカウントにダウンロードしてアクティブ化した後、EURUSD H1 などの任意のシンボルに添付する必要があります。その後、この瞬間からツールが統計の監視を開始します。
パネルは完全に高度になっており、非表示にしたり、好きな場所に移動したりできます アカウント操作に基づく主な特徴は次のとおりです 毎日の期間(毎日の利益と損失は毎日更新されます) 毎週の期間 (毎週更新される週ごとの利益と損失) 毎月の期間(毎月の損益は毎月更新) 年間期間 (年間の損益は毎年更新) 最大ドローダウン(残高に基づいて最大リスクに達するのを毎秒監視して制御) たとえば、残高が 1000 米ドルで、引き出しが 10% をマークしている場合、ある時点でアカウントの合計リスクが 100 米ドルに達したことを意味します。
FREE

Drag the stop line on your chart and see the lot size update live. Sizes every trade from your own risk setting, using the broker's real contract size and lot step. It does not trade and it sends no orders. What it does Set the stop where you actually want it - by dragging a line on the chart, not by typing points into a box - and read the lot size straight off the panel. The panel shows direction, entry, stop, stop distance in price and points, your risk in both percent and account currency, th
FREE

Trading Exporter for AI Assistant Trading Exporter for AI Assistant は、MetaTrader 5 用のプロフェッショナルなインジケーターで、完全で構造化された取引データを JSON 形式でエクスポートするように設計されています。その目的は、ChatGPT、Gemini、Copilot、Claude、DeepSeek などの無料または有料のAIアシスタントが、その情報を分析し、パーソナライズされた推奨事項、戦略、および説明を提供できるようにすることです。 特別な推奨事項: DeepSeek このエクスポーターはあらゆるAIで機能しますが、いくつかの理由から DeepSeek の使用を特に推奨 します。 拡張されたコンテキスト能力 : インジケーターがエクスポートする大量のデータを処理するのに理想的です。 ネイティブな多言語サポート : 含まれている7つの言語と完全に互換性があります。 高度なテクニカル分析 : テクニカルパターンとインジケーターを解釈する優れた能力。 効率的な JSON 処理 : 複雑なデータ構造を扱うた
FREE

Description : Rainbow MT5 is a technical indicator based on Moving Average with period 34 and very easy to use. When price crosses above MA and MA changes color to green, then this is a signal to buy. When price crosses below MA and MA changes color to red, then this is a signal to sell. The Expert advisor ( Rainbow EA MT5 ) based on Rainbow MT5 indicator is now available here .
MT4 version is available here .
FREE
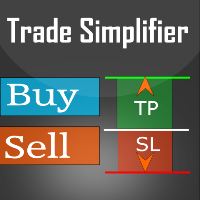
Trade simplifier is a trade panel that simplifies trade opening. It is simple and easy to understand, with key features to ease trading. Features include:
Order type selection Fixed lot entry from the chart user interface Easy Take profit entry field on the chart user interface Visual take profit selection and adjustment via the line that appears when you click the Take Profit button Easy Stop loss entry field in points on the chart user interface Visual Stop Loss selection and adjustment via
FREE

Kairon Trend Ripper MT5 is a simple trading solution designed to capitalize on market trends using a combination of reliable technical indicators. This expert advisor (EA) employs a strategy that blends the Moving Average and MACD indicators to identify and follow prevailing market trends. The EA still needs improvement.
Key Features: Trend-Following Strategy: Utilizes Moving Average and MACD indicators to detect and ride market trends. Dynamic Lot Sizing: Implements a flexible risk management
FREE

Are you tired of the stress and frustration that come with Forex trading? Introducing G FORCE , the ultimate solution for a seamless and profitable trading experience. This expertly crafted EA (Expert Advisor) is designed to take the emotion out of trading, allowing you to trade with confidence and ease. G FORCE isn’t just another trading robot; it’s your professional trading partner, engineered to generate consistent profits while you sit back and relax. Whether you're new to trading or a seas
FREE

OmniSignal Navigator - Smart Entries at Key Levels Trade Like a Professional with this daily/weekly High-Low-Close indicator, designed for scalping or intraday short term trading and precision breakout trading. Suggested Timeframes to trade with: M 5 DO NOT USE THE INDICATOR ON THE M1 TIMEFRAME! Why It Works Perfect for Scalping/Intraday: Targets key zones (PDH/PDL/PDC & PWH/PWL/PWC) on M2, M3, M5, M15 timeframes. (Lower Timeframes = More Signals, Higher Timeframes = Less Signals) No Chart Anal
FREE

KS Triple EMA — 概要と機能
概要
KS Triple EMAは、MetaTrader 5(MT5)向けに開発された、洗練されたデザインと高いカスタマイズ性を備えたトリプル移動平均インジケーターです。メインチャート上に、最大3本の独立した移動平均線(Fast、Medium、Slow)を表示し、プロフェッショナルな視覚表現と動的なラベル表示を実現しています。
ファイル名は「Tripple」となっていますが、インジケーターの内部名称は「KS ThreeMA」または「KS 3MA」です。 主な機能
機能 | 説明
--- | ---
3つの独立した移動平均線 (MA) | 高速・中速・低速の各ラインに対し、完全に独立した設定が可能
完全なカスタマイズ性 | 各MAごとに期間、計算方法、適用価格、色、スタイル、太さを個別に設定可能
動的な終端ラベル | 各MAラインの終端に、視認性の高いラベルを自動的に配置
有効/無効の切り替え | 各MAごとに表示・非表示を個別にコントロール可能
複数インスタンスの併用 | 同一チャート上で複数のコピーを安全に使用可能(オブジェクト名の
FREE

# Account Statistics Pro — Product Description (EN)
**Account Statistics Pro** is a multi-currency account analytics dashboard for MetaTrader 5. It reads your trading history and turns it into a complete, institutional-grade performance and risk report — rendered directly on the chart as a fast, fully opaque, draggable panel.
From a single glance you see where your money is made and lost: by symbol, by magic number, by hour, by weekday, by month — and what your real risk actually looks like.
FREE
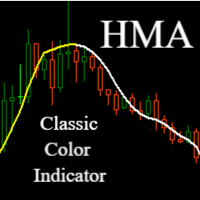
Hull Moving Average (HMA) - Faster and More Precise Trend Tracking
Hull Moving Average represents a revolutionary approach to trend analysis that overcomes the common shortcomings of traditional moving averages. This advanced indicator, developed by Alan Hull, practically eliminates the lag typical for standard moving averages while maintaining exceptional signal smoothness.
Key Benefits:
Significantly faster response to trend changes than traditional moving averages Minimal lag while mainta
FREE
Pipsometer is an elegant, real-time panel indicator for MT5 that instantly shows you both your cumulative money and pip gain/loss and total trades executed on the current chart. It dynamically changes its display color—green for net profit and red for net loss—so you can gauge performance at a glance without opening reports or scrolling through trade history.
FREE

There are thousands, if not millions, of strategies on the internet, but only less than 10% work and of those even less have stood the test of time. Very few strategies have successfully weathered the 2008-2009 financial crisis, 2020 covid effects on the markets and all other unforeseen events that have affected the market in the last 2 decades. That being said, the strategy I feature in this episode does just that, the epitome of stability as I’ll show in a 20 year back-test.
The source of th
FREE

1 つで 2 役:サブウィンドウのフル機能 RSI と、チャート上のマルチタイムフレーム RSI Board。 • 10 の色分けゾーン(0–100 の 10 分位)付き RSI——買われすぎ・売られすぎの圧力が瞬時にわかります。 • LTF チャートで HTF RSI:M5 チャートのサブウィンドウで H4 の RSI を実行。 • ダイバージェンス自動検出:強気・弱気それぞれ最大 3 つまで、ラインとラベル付き。 • RSI Board( ボタン):チャート右上のコンパクトな表に、選択した時間足のライブ RSI 値を表示——各セルは赤から緑へのゾーンスケールで色分け。市場全体の状態がひと目でわかります。 • 任意レベルのタッチアラート(デフォルト 30/70)——RSI がクロスしたときに通知。 • 期間、ピボット長、ゾーン塗りつぶしのオン/オフを調整可能。 コントロールパネルはメインチャート上(サブウィンドウではなく)に配置され、自由にドラッグ可能——11 のインターフェース言語、ダーク/ライトテーマ、30~300% のパネルスケール。すべての設定は自動保存されます。 万一、問
FREE

Risk Reward Ratio Calculator - a free tool that tells you instantly whether a trade is worth taking. Enter your entry, stop-loss and take-profit prices and see the risk/reward ratio, potential loss and potential profit before you open the position. Successful traders only take trades with a favourable reward compared to risk. This calculator draws your entry, stop and target directly on the chart and shows the exact R:R multiple, so you can reject bad setups and size good ones correctly. Feature
FREE

Professional Momentum Analysis Made Simple RSI Pro Pulse MT5 is a modern, professional, and beginner-friendly Relative Strength Index indicator designed to help traders understand market momentum, identify potential reversal zones, and spot high-quality trading opportunities with greater clarity. Unlike a basic RSI indicator, RSI Pro Pulse combines intelligent color changes, customizable signal logic, visual trading zones, alerts, signal arrows, and a compact information dashboard—all inside one
FREE

1つのチャートに8本の移動平均線、指定した2本がクロスするたびに BUY または SELL の矢印、そして入力ダイアログを開かずにすべてを変更できるコントロールパネル。 多くの移動平均ツールは2本のラインと固定ルールしかありません。このツールは8本のラインを使え、どの2本でシグナルを出すかを自分で決められ、チャート上からいつでも変更できます — 期間、手法、色、太さ、破線パターン、矢印の形、矢印のサイズ、そしてクロスがカウントされるまでにどれだけ維持される必要があるか。 すべて シンボルごと・時間足ごと に保存されます。M1 チャートでは大きな矢印の 5/21、同じシンボルの H1 チャートでは控えめなドットの 50/200 を使えます。時間足を切り替えれば、適切な設定が一緒に読み込まれます。 口座へのアクセスは一切ありません。
これはインジケーターです。チャートに描画し、アラートを出します。注文の発注、決済、変更はできず、ネットワークコードも含まれていません — どこにも何も送信されません。 実際にできること
シグナルを出す組み合わせを選ぶ パネルの FAST または SLO
FREE

"This Expert Advisor is provided free of charge to demonstrate my high-quality coding skills. I specialize in custom MQL4/MQL5 Freelance development ." "For custom Expert Advisors, Indicators, or scripts, please contact me through the MQL5 Jobs section The Single Position Risk Controlled Expert Advisor (EA) for MetaTrader 5 offers a simple, yet robust, momentum-following strategy. It is designed to prioritize capital protection by strictly limiting the number of open positions to one
FREE

Japanese ADX Cross Alert EA for MT5 ADX Cross Alert EA は、 平均方向指数(ADX) が主要なボラティリティレベルを超えたときに通知する MetaTrader 5 用のシンプルなツールです。チャートを常に監視しなくても市場の勢いとトレンドを確認できます。 チャートに追加すると、EA が ADX インジケーターを監視し、選択したボラティリティレベルを超えたときに ポップアップアラート を表示します。これにより、チャートをすばやく確認し、トレンドの強さを評価できます。 特徴 ADX が選択した ボラティリティレベル (デフォルト 25)を上回ると検出 ADX が選択した ボラティリティレベル (デフォルト 25)を下回ると検出 MetaTrader 5 のポップアップアラート すべての銘柄と時間足で使用可能 軽量で使いやすい 仕組み EA はチャート上の ADX インジケーターを監視します。ADX が選択したボラティリティレベルを超えたときにポップアップアラートが表示されます。 ADX の期間 と ボラティリティレベル は設定で変更でき
FREE

Introduction
Auto Chart Alert is a convenient tool to set alert for your trading in your chart. With Auto Chart Alert, you can set the alert line in one click in your desired location in your chart. You can even set alert over the sloped lines in your chart. Auto Chart Alert is a great tool when you have to watch out importnat support and resistance levels for your trading. You can receive the sound alert, email and push notification when the price hit the alert line at you desired location. Au
FREE

The POSITION FINDER v2.0 | iK is a professional-grade technical indicator designed for the MetaTrader 5 platform. It is engineered to provide traders with a comprehensive, all-in-one market analysis dashboard that combines trend identification, volatility tracking, and precise trade execution zones. By analyzing multiple layers of market data, this tool simplifies complex price action into clear, actionable visual signals suitable for any timeframe and any financial instrument, including Forex,
FREE

Alligator Runner EA – Smart XAUUSD Expert Advisor Alligator Runner EA is a fully automated trading robot designed specifically for XAUUSD (Gold) on the MetaTrader 5 platform. It combines trend-based logic with level trading mechanics, powered by the Alligator indicator, to detect precise entries and exits in the market. Key Features : Trend-following strategy with level re-entries ️ Built-in Stop Loss , Take Profit , and dynamic trailing Designed exclusively for XAUUSD – no optimiza
FREE

Technical Analysis Dashboard Pro (TADashboard Pro) – 統一テクニカル分析システム TADashboard Pro は、複数のテクニカル指標と時間枠(タイムフレーム)を単一のビジュアルインターフェースに統合した、高度なテクニカル分析パネルです。 正確性 と 効率性 を求めるトレーダー向けに設計されており、本システムは 8つの異なる時間枠 にわたる 7つのオシレーター と 4つの移動平均線 を同時に分析し、意思決定を簡素化する正規化されたスコアを生成します。 主な特徴 (主なとくちょう): マルチタイムフレーム分析 (Multi-Timeframe Analysis): 統合されたビジュアルセレクターにより、M1、M5、M15、M30、H1、H4、D1、W1の各期間を簡単に監視できます。 高度なスコアリングシステム (Advanced Scoring System): オシレーター、移動平均線、および総合評価の独立したスコア( $-100$ から$+100$まで)。 搭載インジケーター (Included Indicators): RSI
FREE

1つの口座で複数のEAを動かし、さらに手動の取引もいくつか行っているとします。残高に表示されるのは合計です。どのEAが利益を出し、どのEAがそれを失っているかは表示されません。 Magic Stats はMT5口座の約定履歴を読み込み、 マジックナンバーごとに1行 を表示します。選択した任意の期間で、各EAが実際にどのような成績だったかがわかります。インジケーターなので、どのEAの横でもチャート上に置けます。トレードを新規に建てたり、変更したり、決済したりすることは一切ありません。 各EA(マジックナンバー)について表示される内容 名前 と取引された シンボル トレード数 、 勝率 、 純利益 (損益 + スワップ + 手数料 + フィー)、口座通貨とその桁数で表示 プロフィットファクター 、 平均トレード EAの決済済みトレードによる資産曲線の 最大ドローダウン (金額)と リカバリーファクター (純利益 / 最大ドローダウン) 最終トレード 日、現在の 保有ポジション とその 含み損益 各行に小さな 資産ライン (最大20ポイント)、緑または赤 Total account (口座全
FREE

ATX Meridian Drift — Mean-Reversion Expert Advisor for EUR/USD (M15)
OVERVIEW
ATX Meridian Drift is a mean-reversion Expert Advisor engineered for the EUR/USD pair on the M15 timeframe. It is built on a single, disciplined premise: in the absence of a dominant trend, price tends to oscillate around its statistical mean, and structured entries at the extremes of that oscillation — rigorously filtered to exclude trending conditions — offer a rules-based way to participate in that behaviour.
Th
FREE

CANDLESTICK_MT5
A very interesting indicator of candlestick patterns, converted from the free version of the CANDLESTICK indicator for the MetaTrader4 terminal to the version for the MetaTrader5 terminal. In addition to candlestick patterns, it draws support and resistance lines, which are perfectly worked out by the price on the chart. It can work on any timeframe. Has simple settings. When converting, the logic of work and the design of the original CANDLESTICK indicator for the MT4 terminal
FREE

EA Zone Recovery Assistant เป็น EA ที่ช่วยเปิดออเดอร์ Recovery ตามระดับราคาที่ผู้ใช้กำหนดได้อัตโนมัติ //โดยหลักการทำงานมีดังนี้// เมื่อผู้ใช้เปิดออเดอร์ Buy หรือ Sell (Market Order) EA จะตรวจสอบจุด SL ภายในเวลาที่กำหนดในตัวแปร Input Delay Check for setting Price Recovery ถ้าผู้ใช้วาง SL วางภายในเวลาที่กำหนด ระบบจะลบ SL ออกแล้วใช้จุดที่วาง SL เปิดออเดอร์ Recovery เมื่อกราฟวิ่งผิดทางถึงจุดที่กำหนด //แต่ถ้าผู้ใช้ไม่วาง SL ภายในเวลาที่กำหนดระบบจะไม่มีการทำ Recovery ในออเดอร์นั้นแม้ผู้ใช้มีการวาง SL
FREE

by installing this indicator you can create a horizontal line with the click of a button press Q = to create a horizontal line at the location of mouse pointer press W = to delete all existing horizontal lines press E = to delete the horizontal line nearest to your mouse pointer WANT SIMILAR INDICATOR for PRICE ALERT ?? CHECK OUT MY OTHER PRODUCTS https://www.mql5.com/en/market/product/165765
by default the line is blue with dashes and price highlighted on the line, but its fully customizable
FREE

Треугольным арбитражем называют одновременно открытие ордеров по трем валютным парам. Направление сделок и пары выбираются таким образом, чтобы одновременно открытые позиции страховали друг друга. За счет этого можно открываться достаточно большими лотами, и риск невелик. Варианты треугольников:
EURUSD – USDJPY – EURJPY Ордера, входящие в состав такого треугольника находятся в постоянном движении. Советник анализирует реальные цены на данный момент и просчитывает какими они должны быть. При рас
FREE

KAB: A Better Baseline. KAB is an adaptive trend filter designed to track directional movement while actively suppressing abnormal volatility and noise. It behaves like a dynamic moving baseline that automatically adjusts responsiveness to changing market conditions. Unlike fixed moving averages, KAB continuously modifies its internal smoothing rate based on volatility and directional efficiency. The result is a line that tightens during strong trends and stabilizes during unstable or chaotic pr
FREE

Enhanced FVG Enhanced FVG is a technical indicator for MetaTrader 5 that identifies Fair Value Gaps on the chart and measures the buyer-to-seller volume ratio within each detected gap. Volume classification is performed using M1 timeframe tick volume data, applying the same methodology used in standard Volume Profile analysis. How It Works The indicator scans three consecutive candlesticks to detect Fair Value Gaps. A Bullish FVG is identified when the high of the first candle does not overlap w
FREE

SMC ProVision 2.0 — Professional Smart Money Concept Analysis Stop guessing. Start reading the market like institutions do. SMC ProVision maps the full smart money footprint directly on your chart — with a clean, minimal design that won't clutter your screen. Market Structure — BOS / CHoCH with HH・HL・LH・LL labels Order Blocks — Standard & Refined with mitigation tracking Breaker Blocks — Auto-converted from mitigated OBs Fair Value Gaps — Fill percentage & mitigation status Liquidity —
FREE

Plus Color Bar with Time for MetaTrader 5 説明 Plus Color Bar with Time は、ローソク足の色分け、現在のローソク足のカウントダウンタイマー、ヒゲ形成の可能性の分析を組み合わせた MetaTrader 5 用の視覚的インジケーターです。 ローソク足の色分け 上昇と下降のローソク足を異なる色で表示し、価格の方向を視覚的に確認しやすくします。 ローソク足タイマー 現在のローソク足の横に、そのローソク足が終了するまでの残り時間を表示します。カウントダウンは選択されているチャート時間足に合わせて自動的に調整されます。 タイマーの色は形成中のローソク足の方向に応じて変化します。上昇方向と下降方向はそれぞれ異なる色で表示されます。 ヒゲ分析 現在のローソク足が形成されている間に、ヒゲが形成される可能性も分析します。 分析では、ローソク足の形成時間、ヒゲの相対的な大きさ、価格の反発、および ATR を基準とした値を使用します。 設定された条件が検出されると、タイマーは通常とは異なる点滅表示を使用して、ヒゲ形成の可能性を示します。 設定
FREE

1. 製品名: Smart Multi-Timeframe MA (MTF MA) 1行の要約:単一チャートで7つの主要なタイムフレームの移動平均線をリアルタイムで確認するオールインワントレーディングソリューション。
2. 製品紹介(Description) トレーダーは複数のタイムフレームを同時に分析し、トレンドの大きな流れを読む必要があります。 Smart MTF MAは面倒なチャートの切り替えを必要とせず、現在のチャートにM1からD1までの移動平均線を視覚的に投影し、市場のマルチタイムゾーンの流れを一目で把握させます。
主な特長: 完全同期:現在のチャートの動きに合わせて7つのタイムフレーム(M1〜D1)の二平線を自動計算して表示します。
カスタマイジング:各タイムフレームごとの期間(Period)、色、線の太さを個別に設定して、独自のチャート環境を構築できます。
柔軟な設定:不要なタイムゾーンは「OFF」機能で簡単に隠すことができます。
最適化されたパフォーマンス:MQL5環境に最適化されており、チャートの移動時にもシームレスな滑らかなパフォーマンスを提供します。
FREE
フラワーインジケーターは、主にトレンドを特定し、スキャルピングやデイトレード戦略を支援するテクニカル分析ツールです。
フラワーインジケーターは、テクニカル分析と価格動向分析に基づいたシグナルトレンドインジケーターです。色付きの花を使ってトレンドを視覚的に示します。青い花は上昇トレンド、赤い花は下降トレンドを示します。
各レベルはサポートラインとレジスタンスラインのように機能します(チャート上に+/- 200レベルとドットが表示されたら注意してください)。
買われ過ぎ/売られ過ぎの静的レベル、付随するバンド、両方、またはどちらかを突破した時にドットが表示されるように設定できます。
このインジケーターは、アキュムレーション/ディストリビューションゾーンを特定しながら、市場の反転の可能性を探ります。あらゆる銘柄と時間枠に対応しており、パラメータは自由に調整できます。各レベルはサポートラインとレジスタンスラインのように機能します。
FREE

この無料EAはタイムフレームはM5専用になっています。 なおかつ運用通貨はJPY建て専用となっています。 USDやEUR建てでバックテスト、実運用は出来ないよう仕様になっています。 運用ロットに関しても0.01固定です。 あくまでバックテスト用EAという試験品としてご覧ください。 実際にフォワードでも使用していますのでライブシグナルもダウンロードが続いていくようでしたら公開しようと思っています。
TYO EA LABの開発思想
TYO EA LABでは、プロップファームの運用思考を取り入れたクオンツEA開発を行っています。 重視しているのは、単体EAの一時的な成績ではなく、複数戦略を組み合わせた際の安定性、分散性、そして実運用での再現性です。
開発には、長期検証データに加え、AIによるデータマイニングを活用しています。 市場データを多角的に分析し、時間帯や月別傾向、価格変動の偏りなど、繰り返し現れる統計的優位性を抽出しながらロジックを構築しています。
また、TYO EA LABのEAは、ク
FREE
ZIGZAG and FRACTAL CANDLE PRO ( Only candles, No RSI strength panel) " Suitable for QQE RITZ " > Check My Product is an advanced market structure visualization system built for precision trend detection, powered by dynamic fractal logic and adaptive swing validation.
It seamlessly identifies Higher Highs (HH), Lower Lows (LL), and key structural shifts — allowing traders to read the true rhythm of market transitions with institutional clarity. This system combines ZigZag precision , fractal
FREE

詳細な説明 概要 SmartRisk Investment Robotは、エントリー前に上位足のトレンドおよびストキャスティクスのクロスシグナルと、下位足の値動き構造の確認を組み合わせるエキスパートアドバイザー(EA)です。ロット数は固定値ではなく、ユーザーが選択した口座資金とリスクレベルに基づいて計算され、資金規模に応じた上限が設定されるため、リスクを資金に比例させやすくなっています。 取引ロジック 上位足で新しいバーが形成されると、EAは価格と移動平均線の位置関係を確認し、ストキャスティクス・オシレーターがミッドラインを通過するクロスを探します。この上位足の条件が満たされると、EAはポジションを開く前に、直近の価格水準のブレイクや下位足移動平均線に対する価格の位置関係など、下位足での値動き構造の確認を行います。ストップロスとテイクプロフィットの水準はアベレージ・トゥルー・レンジ(ATR)に基づいて計算されるため、決済までの距離は固定ではなく、現在の市場のボラティリティに応じて調整されます。 リスクレベルのプリセット EAには**「低」「中」「高」**の3つのリスクレベルのプリセット
FREE
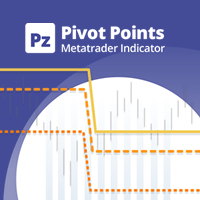
This indicator displays pivot points in the chart, including historical vales, and supports many calculation modes for Pivot Points and S/R levels. [ Installation Guide | Update Guide | Troubleshooting | FAQ | All Products | Get Help ] It plots historical levels for backtesting purposes
It allows you to select the reference timeframe It implements different Pivot Point calculation modes It implements different SR calculation modes
It implements customizable colors and sizes
Calculation Mod
FREE

Read detailed blogpost with screenshots here: https://www.mql5.com/en/blogs/post/770947
Features at a Glance One-click symbol change across all charts simultaneously One-click timeframe change across all charts simultaneously Live trade status on every pair button — buy/sell counts, profit/loss coloring Pending order indicators shown separately on buttons Panel background color changes with your overall profit or loss Sync panel position across all charts Sync the number of buttons per row acro
FREE

The Market Momentum indicator is based on the Volume Zone Oscillator (VZO), presented by Waleed Aly Khalil in the 2009 edition of the International Federation of Technical Analysts journal, and presents a fresh view of this market valuable data that is oftenly misunderstood and neglected: VOLUME. With this new approach of "seeing" Volume data, traders can infer more properly market behavior and increase their odds in a winning trade.
"The VZO is a leading volume oscillator; its basic usefulness
FREE

Stochastic Cross Alert PRO Stochastic Cross Alert PRO is a lightweight and accurate indicator designed to detect Stochastic (14,3,3) crossover signals directly on the main chart. Instead of watching the oscillator window constantly, this indicator automatically marks buy and sell signals when the %K line crosses the %D line , making trade opportunities easier to spot. The calculation is built to match the native Stochastic oscillator behavior , ensuring that the signals appear exactly when the r
FREE

ED Multi-Timeframe Market Bias Dashboard ED Multi-Timeframe Market Bias Dashboard is designed to give traders a fast and clear overview of market direction across multiple timeframes without having to continuously switch between charts. The dashboard analyzes market bias from M1, M5, M15, M30, H1, H4 and D1 , displaying each timeframe as either BULLISH or BEARISH . Market direction is determined using the relationship between the 20 EMA and 50 EMA , providing a simple and consistent method of id
FREE

重要な価格レベル、利益目標、リスク閾値を二度と見逃しません。 目標に到達したら利益を確定し、取引を一時停止したいですか?Price and Target Alerts は、すべてのポジションを自動的に決済し、通知を送り、それ以降の取引を停止することができます。安心して利益を確保できます。 Price and Target Alerts は、市場価格と取引口座を継続的に監視し、口座レベルの条件が満たされると自動的に通知するか、あらかじめ設定した保護アクションを実行する、MetaTrader 5 向けの高度なユーティリティEAです。 主な機能 複数の価格アラート 任意の銘柄に対して複数の価格アラートを作成できます。入力タブから設定することも、チャート上で直接設定することも可能です。 各アラートの動作を選択できます: Once(デフォルト) – 価格が設定レベルに初めて到達したときのみ発動します。 Every Cross – 価格がそのレベルを通過するたびに毎回発動します。 以下の用途に最適です: サポート&レジスタンス ブレイクアウト セッションの高値/安値 需給ゾーン ニュースレベル 価
FREE

USD STRENGHT VERSUS MARKET USD (DXY) Versus Market Panel is a professional visual indicator designed to analyze US Dollar strength and pressure against major trading symbols in real time. The indicator compares USD performance (based on DXY logic or internal strength calculation) versus selected symbols, allowing traders to quickly identify dominant currency flow, relative strength, and market bias from a single panel view. Built with a clean, lightweight, and non-intrusive panel , this tool hel
FREE
The Multi-Frame MACD Indicator is a robust MetaTrader 5 (MT5) indicator that utilizes the Moving Average Convergence Divergence (MACD) to analyze trends across multiple timeframes. This indicator synchronizes MACD-based trend signals from up to nine timeframes (M1, M5, M15, M30, H1, H4, D1, W1, MN1) and presents them with clear visual cues, including a colored MACD line, signal arrows, and a customizable dashboard. Perfect for traders seeking momentum and trend reversal insights. Features Multi-
FREE

Apex MTF Panel
A clean, standalone multi-timeframe RSI/MACD dashboard that instantly shows buy, sell, or neutral confluence signals across your chosen timeframes in a compact horizontal layout. TF names sit directly above signals with matching colors for instant readability. Fully customizable signal colors, live font-size adjustment, corner positioning, and smart “loading” state ensure performance on any chart. Support and questions via MQL5 product comments. For questions, updates, and to conn
FREE

King_Expert EA - Professional Trading System Overview King_Expert EA is a sophisticated automated trading system for MetaTrader 5 that combines trend-following strategies with intelligent risk management. The EA uses a multi-layered approach to identify high-probability trading opportunities while incorporating advanced features like grid averaging and dynamic position management. Core Trading Strategy Primary Signal Generation EMA Crossover System : Uses dual Exponential Moving Averages (21/50
FREE

The indicator draws daily support and resistance lines on the chart, as well as the Pivot level (reversal level).
Adapted to work in MT5
The standard timeframe for calculating support and resistance levels is D1. You can choose other timeframes according to your strategy (for example, for M1-M15, the optimal timeframe for calculations is H1)
The function for calculating support and resistance levels has been updated; in this calculation option, fibonacci levels are taken into account, respec
FREE

Trend Survival States for MetaTrader 5 — 適応ボラティリティバンドと 5 つの状態のトレンド分類を使用して強気圧力と弱気圧力を測定する自由市場体制インジケーター MT5 では、強気圧力と弱気圧力、適応バンド スプレッド、および 5 つの状態の市場分類が無料で利用できます。 現在の動きの背後にある売買圧力を測定し、それを市場の状態(強い強気、弱い強気、中立、弱い弱気、強い弱気)に分類します。 これは完全な体制の指標であり、期限付きの裁判や不自由なデモではありません。チャートに描かれているものはすべて完全な計算です。 有料版で追加されるもの。 トレンド生存率は、現在の状態が次のバーまで生き残った頻度を報告し、ブライアー スコアを使用して実際に起こったことに対して予測するスコアを示します。これら 2 つの数値とそれらを管理する設定は、この無料版には含まれていません。それ以外はすべて同一であり、両方を同じチャート上で同時に実行できるため、違いは説明されるのではなく、目に見える形で表示されます。 仕組み 2 つの圧力コンポーネントが価格から計算されます。上
FREE

EA Free for the rest of the week ! Please test and comment ?? Sky is the Limit EA works very nice but read below and test in all case. It is trading on Supporting and Resistance levels ! See the Settings picture for the ulitmate settings I use ! It does have a SL setting but i found that, whatever i made it, the market will trigger it. I found that Long trades do better. Suggestion is to set Sell=0 or =1. It is possible that in a bullish market, long trades work better. I will be adding filt
FREE

LRC Pro with Alerts Overview LRC Pro replaces standard candlesticks with Linear Regression smoothed candles , eliminating market noise and making trend direction instantly clear. A signal line (SMA or EMA) is overlaid directly on the smoothed candles, giving you clean, actionable entries and exits without cluttering your chart. Unlike standard candles that react to every tick, LRC Pro show you where price is actually trending — making it far easier to stay on the right side of the market. How It
FREE

Equity Panel for MT5 Equity Panel is a free MT5 indicator that gives you a fast and convenient live overview of your account directly from the chart. Monitor balance, equity, floating P/L, drawdown, daily performance, margin data, and warning levels in one compact dashboard. Built for traders who want better control, faster risk awareness, and clearer account monitoring in live market conditions. Equity Panel is a lightweight and practical account monitoring indicator for MetaTrader 5 that helps
FREE

Hello everyone! Talented Investors I'm not very good at English, so I used Google Translate. Please bear with me :) There's no need to say much about the capabilities of the BOT. Try it out to make the most informed decision. Some information you need to pay attention to: 1. The BOT will automatically trade based on your adjustments. Avoid trading during periods of high volatility such as: New York market open, CPI, NFP, FOMC news. 2. Recommended for use on M1 - M15 timeframes. 3. Minimum trade
FREE

The "Session Time Vertical Lines" indicator displays vertical lines on the chart that mark the beginning and end of major global trading sessions: Sydney, Tokyo, London, and New York . It is designed to help traders visually identify active market hours, overlaps, and potential high-volume periods directly on the price chart. This tool is especially useful for intraday traders who rely on market session timing to plan entries and exits. Inputs / Settings Parameter Name Description DaysToDraw Num
FREE

The Keltner Channel is a volatility-based technical indicator composed of three separate lines. The middle line is an exponential moving average (EMA) of the price. Additional lines are placed above and below the EMA. The upper band is typically set two times the Average True Range (ATR) above the EMA, and the lower band is typically set two times the ATR below the EMA. The bands expand and contract as volatility (measured by ATR) expands and contracts. Since most price action will be encompasse
FREE

No Nonsense Forex Methodのトレードパネル チャートをきれいに保ちながら、取引速度を向上させます
特徴: - ポジションサイジング: [Buy/Sell] をクリックすると、このツールはリスクに最も近いロット数 (各取引で使用される残高の割合) で 2 つの取引を開始します。ピップ値の計算は忘れてください!
-SL と TP: 各取引は 1.5*ATR のストップ ロスで開かれ、1*ATR のテイク プロフィットで 2 つの半分のうちの 1 つが開かれます。使用される ATR 値は、現在のローソク足の値であり、日足のローソク足を完了するまでの残り時間が 4 時間未満の場合、そうでない場合は前のローソク足の値になります。
-ストップロスの更新 : ストップロスを損益分岐点に設定するか、NNFX のルールに従ってトレーリング ストップを更新します (価格が 2*ATR に移動した後、ストップ ロスは 1.5*ATR に移動します)。 - ポジションを閉じる: 決済シグナルを受け取ったら 、ワンクリックですべての売買を決済します
その他の考慮事項: -プログラム
FREE

What Gets Drawn Most level tools mark every swing they can find, and a chart with forty lines answers nothing. This one keeps a level only when price came back to it, and prints the evidence next to the line: the number of touches and the age in days. Lines above current price and lines below it are drawn in different colours, so the map reads at a glance without counting. What Puts A Level On The Chart A swing high is a bar whose high is not lower than its neighbours on both sides, within the n
FREE

MT5用パターン・スキャナー&ローソク足タイマー
「パターン・スキャナー&ローソク足タイマー」は、チャート上でローソク足パターンの特定、確定までのカウントダウン、および現在の値動き(pips)をリアルタイムで確認できる、オールインワン型の視覚的インジケーターです。
手動でチャートを分析する手間を省き、シングル・ダブル・トリプル・ローソク足パターンを自動的にハイライト表示します。さらに、パターンの信頼性を測るための「グレード評価(A、B、C)」も即座に提示します。
主な機能:
リアルタイム・ローソク足パターン検出:
グレードA(信頼度:高): 赤三兵(Three White Soldiers)、黒三兵(Three Black Crows)、明けの明星(Morning Star)、宵の明星(Evening Star)、包み足(Bullish/Bearish Engulfing)。
グレードB(信頼度:中): ハンマー(Hammer)、流れ星(Shooting Star)、マルボウズ(Marubozu)、切り込み線(Piercing Line)、かぶせ線(Dark Clo
FREE
MetaTraderマーケットは、開発者がトレーディングアプリを販売するシンプルで便利なサイトです。
プロダクトを投稿するのをお手伝いし、マーケットのためにプロダクト記載を準備する方法を説明します。マーケットのすべてのアプリは暗号化によって守られ、購入者のコンピュータでしか動作しません。違法なコピーは不可能です。

取引の機会を逃しています。
- 無料取引アプリ
- 8千を超えるシグナルをコピー
- 金融ニュースで金融マーケットを探索