YouTubeにあるマーケットチュートリアルビデオをご覧ください
ロボットや指標を購入する
仮想ホスティングで
EAを実行
EAを実行
ロボットや指標を購入前にテストする
マーケットで収入を得る
販売のためにプロダクトをプレゼンテーションする方法
MetaTrader 4のためのエキスパートアドバイザーとインディケータ - 259

The Trend Sniping is a home made medium-term trading strategy and good for strategy diversification and earning huge profits per trade .
Before purchasing the strategy, you are recommended to browse the characters of this strategy below:
1. This strategy is built for trend hunting seekers. The default parameters is for 1 hour chart AUDUSD only . 2. It comes with both appropriate range of taking profits and appropriate range of stopping loss default settings. 3. Smooth back-testin

EchoSonic V1.0
EchoSonic is a fully automated Expert Advisor with no use of martingale EchoSonic double Strategy , Night trade and Full day trade
General Recommendations The minimum deposit is 300 USD,
Recomend low spread pair The best on EURUSD Time Frame M5 ,H1 Input parameters The product works both on 4 and 5-digit quotes DrawDown_Filter: Active if set true, the EA not entry more trade when DrawDown reach certain level below. MaxDrawDown(%): Maximum Draw Down Level that make EA stop o

The lifetime EA of my best Trading Signal. This is for AUDCAD M15.
Entry: - contrary positioning
Exit: - when sufficient profit is obtained (independently calculated Long/Short profit)
I'm using this and getting annual interest at 10%~30%. Let's take it!
--- My Introduction --- Experience of my trading and developing EA: 9 years Now I work as an AI researcher in Japan.
Thank you for your interest.

https://www.youtube.com/watch?v=ygibWOftQ7c <---- CHECK OUT HOW IT TRADES VISUALLY HERE Currency - Eur/Usd Candle Time - 1m for best results(works on multiple timeframes) Recomended Broker - IG(works on most) Leverage - 1:200 Fully Automated EA for Longs and Shorts You can adjust to whichever RSI period and value you want. -RSI PERIODS & VALUES WHEN THEY CROSS ARE ALL ADJUSTABLE IN THE INPUTS AS WELL AS COLOR OF WORDS AND NUMBERS
Default settings are to... LONGS - are to buy when RSI cr

Stairway to heaven It is an advanced trading system. This is a fully automatic Expert Advisor. ONLY TWO INPUT TO SELECT FOR THE TRADER 20 YEARS BT IN DIFERENT PAIRS Stairway to heaven . It is a 100% automatic system, the system controls both the inputs and the batches, the operator just has to place the robot on the graph and let it act It is an ideal system for people who do not want complications or strange configurations. The system is self-sufficient, performing all the work.

The Harvest Divergence Strategy is a home made long-term trading strategy and good for strategy diversification and earning huge profits per trade .
Before purchasing the strategy, you are recommended to browse the characters of this strategy below:
1. This strategy is built for trend hunting and extreme speculation seekers. The default parameters is for 1 hour chart EURUSD only . 2. It comes with wider range of taking profits but narrower range of stopping loss default settings in order to

RRobot is a fully automatic Expert Advisor. It is designed for EURUSD on M30 Timeframe and it uses different strategies to minimize the drawdown. Using this algorithm, the expert advisor is able to get a high-rate of winning trades.
The Expert was tested on the whole available historical period in EURUSD since 2015 with good results. From 2018 was tested with around 90% win and maximal drawdown around 58%. You can download the demo and test it yourself. Our tests were performed with the real

序章 「仮想OCO保留中」-リスク評価を備えた半自動注文管理ユーティリティツール(エキスパートアドバイザー)。これにより、OCO保留ルール(ワンキャンセル)を使用して、仮想テイク利益とストップロスで現在の価格でボタンクリックするだけで保留中のストップまたは制限をすばやく配置できます。他の)。簡単に視覚的に確認できるようにチャートに描かれた視覚レベル。このユーティリティを1つのチャートから使用して、他の任意のシンボルで注文を送信できます。メニュー設定で注文するシンボルを指定するときに、対応するチャートに添付する必要はありません(オプション)。 視覚的な仮想レベル これらは、アタッチされている現在のオープンチャートユーティリティにのみ描画され、設定「取引シンボル」と一致する必要があります。つまり、「EURUSD」を設定し、チャートEURUSDにユーティリティをアタッチしている場合、これらのレベルは視覚的ではありません。
戦略テスター ストラテジーテスターでこのユーティリティを実行すると、その目的を示すためにランダムに注文が開かれます
ユーティリティの利点 動的リスク評価または固定ロッ

ADX revolution its an revolutionary indicator, this one simplificate all the signals of convencional ADX indicator, analyzing the market more quickly and giving more colour to the entry signals, to gift you more time for trade and dont waste time analizing. Nice to meet you trader!, im from Argentina if you have any question please contact me by my email: despiertatutrader@gmail.com

Stochastic easy cross, its a simplificated version of original Stochastic indicator, its one its based on the cross of the main line and the signal line of the indicator,and when a cross ocurrs , a cross or a flower will be drawn , if a blue cross appear its one give us a buy signal, and if then is drawn a red cross its talk us about a sell signal, well this is all its really easy to use, any question please ask me to mi email see you! email: despiertatutrader@gmail.com

RSI orbes its an remake of the classic RSI indicator, it have the same but show it by a different way, if lvl 30 or lvl70 are crossed the RSI orbs will draw red orbs or blue green orbes,you can create your own strategy configuring the periods, also for sell when the red orbs appear or to buy when the green orbs its drawn, you can use it by your way, any question please ask to me to my email , good luck see you! email: despiertatutrader@gmail.com

Symbols Strength meter Graph :::: It is programmed to work on any M5 Chat windows !! Used to determine the Strongest currency pairs and the Weakest pairs also detect the peak of deviation of currencies strength IT CAN BE USED FOR INDICES AND STOCKS TOO !! Strategy one : It can be used in to BUY Strongest pair and SELL Weakest one Strategy two: It can be used on Daily basis to Hedge BUY Strongest pair with high % (ex: +1%) and BUY Weakest one with % lower(ex: -0.7%) the same with SELL Strateg

TWO SYMBOLS CORRELATION line indicator It compares the power/strength lines of two user input symbols and create a SMOOTHED line that indicates the degree of deviation of the 2 symbols Strategy#1- FOLLOW THE INDICATOR THICK LINE when CROSSING O LEVEL DOWN --- TRADE ON INDICATOR THICK LINE (TREND FRIENDLY) !! Strategy#2- TRADE INDICATOR PEAKS (Follow indicator Reversal PEAKS Levels)!! you input - the index of calculation ( 10/20/30....) - the indicator Drawing start point (ind

Ala Forex Robot open position both way on start then follow the price with the magic of mathematics calculations. Hedging trades after big differences of price for minimum drawdown, maximum profit. Then close all positions (with hedge positions) with profit. This EA is a profitable trading expert advisor for investors and traders who want to earn 8% - 12% profit per month.
Don't claim to earn millions of dollars with scalping or news trading. Ala Forex Robot offer reality of this market, we of

Gold Eye is one of advance profesional expert that use deep neural network to catch probability of true trend on XauUsd market,
this expert can be run on forex pairs also (Default setup is for XauUsd).
This expert can be set as trend grid follower, or can be set as like hedging system but with flat lot size (not using martingale).
Then unique setup for Money Profit/Loss management is the good things not like any others paid expert here on Mql5. # EA MUST BACKTEST USING TIME_FRAME_001 # PARAMETER

PROMOÇÃO LIMITADA, NA COMPRA DE 1 INDICADOR VOCÊ LEVA CLUBINARIAS 6.0 , 5.1 e DonForex DE BRINDE!! ATÉ FINAL DO MÊS!
-NA HORA DA COMPRA SELECIONAR COMBINAR COM O VENDEDOR OU BUSCAR PESSOALMENTE, A ENTREGA É DIGITAL EM POUCOS SEGUNDOS
==> VEJA O VIDEO PARA TIRAR AS SUAS DUVIDAS <==
==> VÍDEO OPERANDO NO YOUTUBE
ROBÔ FEITO COM MUITO ESFORÇO E CARINHO E QUE ESTA TRAZENDO
ÓTIMOS LUCROS
APESAR DE EXISTIREM PESSOAS QUE APENAS VENDEM ROBÔS FAKES DE OPERAÇÕES , ACREDITO QUE SERIA MUITO BOM DA MI
Average Directional Movement Index Technical Indicator (ADX) helps to determine if there is a price trend. It was developed and described in detail by Welles Wilder in his book "New concepts in technical trading systems". This ADX Signal Scanner will search in Market Watch for a good Entry Point on the chart on every Time frame interval. You can set it to view back shifted signals with custom ADX period, levels and more.

Elite SR - Advanced Level Indicator for automatic detection of support and resistance levels with different degree of credibility should become a part of your trading arsenal. This indicator is accessible via iCustom function and provides level values as well as their degree of credibility. Elite SR is fully adjustable and can work on any time-frame with any trading instrument!
Important information For all detailed information about this indicator you can visit 747Developments website.
Featur
This EA has been developed, tested and traded live for EURJPY H4 TF. Everything is ready for immediate use on real account. Very SIMPLE STRATEGY with only FEW PARAMETERS. Strategy is based on CANDLE PATTERNS . This EA uses them for trying to predict the future move of the market. We are using the most common candle patterns which works for years . It uses STOP pending orders with FIXED STOP LOSS and TAKE PROFIT. To catch at least some profit there is TRAILING PROFIT function provided in

Version of the snowy Owl trend adviser, which is based on determining the combination of candle patterns. A virtual trailing stop tracks each open order and groups open orders to close them simultaneously. The version can work on opening the scalp. orders on the selected TF. Trend indicator: MA+candle combination or only candle combination. The breakeven function and closing all trades (or only profitable ones) with a trawl will reduce the risk of losses. It is recommended to work with stop orde
The EA uses 3 strategies: 1 - a strategy for breaking through important levels, 2-a strategy for reversing, and 3 - trading on a trend. To open a position, the expert Advisor evaluates the situation on the charts using 5 custom indicators. The EA also uses averaging elements in the form of several additional orders ( the EA does not increase the lot for averaging orders). The EA uses 8 adaptive functions for modifying and partially closing orders. Hidden Stop loss, Take Profit, Break Even and T

MACD Cross with additional features which conditions must met if there was set on 1. Stochastic Limit : Buy Above, Buy Below, Sell Above & Sell Below 2. RSI Limit: Buy Above, Buy Below, Sell Above & Sell Below 3. EMA Limit : Buy if EMA1 & EMA2 above EMA3, Sell if EMA1 & EMA2 below EMA3 It also can set whether show arrow and sound alert. MACD, RSI, Stohastic and EMA values can be changed according each user

Yasha Firooz について
Yasha は 2012 年に資産管理会社のスタッフでした。
彼はさまざまな事務および技術業務を委任され、資産管理チームの一部と創設者のニーズを橋渡しすることができました。資産管理会社はトレーディング業界に多額の投資をしていました。
FX Fishing MT5 (Meta Trader 5 インジケーター) について
Yasha は市場のボラティリティに悩まされ、強気相場と弱気相場の間の市場の波を感じることができるかどうか考えていました。そのため、まさにそれを実現するインジケーターを考案しました。すべての上昇ピップがカウントされ、すべての下降ピップがカウントされます。これらの 2 つのティックは、以下のインジケーター画像のように表示されます。
- 緑の数字 (上昇ティック/ピップ)
- オレンジ色の数字 (下降ティック/ピップ)
中央の下に表示される数字は、上昇ボラティリティと下降ボラティリティの差です。
強い強気または弱気のボリュームを示します。
フィッシング インジケーターは、右側のカラー ドットで示される 1:2 の比率で動

SYMBOL POWER based on inputted 5 time frames and Compared to 20 Other Symbols !! Great Indicator YOU DON'T HAVE TO SHIFT ON ALL TIME FRAMES FOR EACH CURRENCY PAIR TO CONCLUDE ITS TREND AND ITS POWER YOU HAVE IT ALL IN ONE TABLE , 20 CURRENCY PAIR WITH 5 TIME FRAMES ALSO , COMPARE BETWEEN CURRENCIES STRENGTH AND ALERTS THE STRONGER /WEAKER PAIR BASED ON 5 TIMEFRAMES CALCULATIONS ALEERTS enable /disable using 5 time frames M5 M30 H1 H4 and D1 ( latest version You SELECT you own 5 timeframes fr

MACDは、最も人気のある勢いとトレンドの指標の1つです。 通貨強度メーターは、複数の通貨に基づくトレンドインジケーターでもあります。 MACD通貨強度メーターは、MACDと通貨強度メーターのアルゴリズムを備えた1つのチャートインジケーターです。 また、ダッシュボードに28のメジャーペアとマイナーペアが表示されるワンクリック機能があり、特定のペアをクリックすると、チャートが自動的に選択したチャートに変わります。
製品の利点 インジケーターの使用方法に関する記録されたウェビナー 資金管理、入場、TPおよび出口戦略のための完全なシステム 入力パラメータ MACD設定-高速および低速のEMA値を入力します。デフォルト値は12,26,9です 折れ線グラフの種類、ダッシュボード、市場動向 表示設定-フォント通貨の色、信号の色、線の色、X軸とY軸のオブジェクトの配置 コンピューター、電子メール、チャートアラート

The Trend Change indicator allows you to use the moving average to indicate to the trader a change in the direction of the trend movement. This is a modified indicator, the advantage of which is the ability to keep up with rapid changes in price dynamics in the presence of excellent SMA smoothing over the period. I recommend the standard indicator settings. Apply on a timeframe not lower than M30
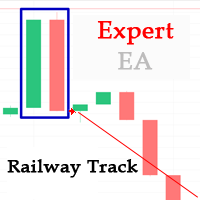
Данный торговый эксперт осуществляет сделки на основе индикатора Railway Track https://www.mql5.com/ru/market/product/20278 Основные положения Рельсы являются разворотной формацией в Price Action. Возникает она в основном при коррекции движения основного тренда. То есть ловить паттерн необходимо на откате от основного тренда. Различают следующие виды паттерна: бычий паттерн – образуется при нисходящем движении и обозначает смену медвежьего тренда на бычий тренд; медвежий паттерн – образуется п

Telegram to MT4 bridge EA is the utility for anyone who wants to COPY TRADES FROM ANY FORMAT TO MT4.
This EA is capable of being modified as you want to take any trading signals from any signal provider. Join the Chat to ask questions about my product : link
In order to make the EA work correctly, you need a free tool that is at your disposal in the Comment section .
*MAIN FEATURES:
EXECUTION TIME : Compared to other products you might find on MQL5 market, this software has a very low executio
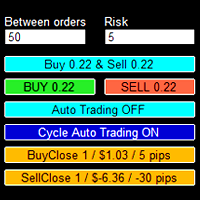
The trading panel is designed to help the trader in managing transactions in the MT4 terminal.
There is a possibility: Open deals using BUY and SELL buttons; In Auto Traiding On mode, already opened positions are averaged by their type until profit is received (the amount of profit at which orders will be closed is set in the settings - in points or percent of the deposit); In Cycle Auto Trading On mode - the EA initially opens two opposite orders and makes two multidirectional grids until pro

PMRC EA
======================================
The Robot is based on 4 Indicators to catch profitable trades. ==========================================
This Robot is fully automated and has been created for everyone. The Robot works also on cent accounts. =============================================================================================== => works on all Time Frames from 1Minute to 1Day => On the lower Frames there are too many small trades but its up to yourself. => I would re

Binary Trend System is a professional scalping indicator designed for trading binary options and Forex instruments. The indicator is based on Price Action patterns that are able to predict future price movement with a high probability. The alert system (alerts, email and push notifications) will help you to simultaneously monitor multiple trading instruments. Attach the indicator to a chart, and the alert will trigger once a signal emerges. With our alerting system, you will never miss a singl

Term "shark" in the business world denotes a high volume investor who just made a good investment in a highly Potential business deal.So, sharks are the ones who make the market move. In our case, if an American shark bought a Japanese company, he/she has to convert American dollars into Japanese yen to make the deal. So, the demand for the Japanese yen will increase sharply. Thus USD/JPY will go short rapidly if the deal was from the shark. Another example, In the case of forex, if fed increa
This EA utility does not trade on its own, but it only modifies the open trades to add take profit and stop loss that was opened manually or by any other expert advisors.
The distance is based on Average True Range Indicator(ATR).
How Does It Work? If Symbol to modify is set to "All Symbol" simply attach it to one chart, and all open trades in the entire terminal will set the take profit and stop loss with the distance of Average True Range value of their corresponding symbol. If Symbol

The " Trade Expert" Expert Advisor is a professional tool for ride trends on financial instruments. The algorithm of the program is arranged in such a way that the EA uses signals based not on the current price, but on the price of the edges of channel. A special algorithm calculates the channel and the price range and uses it to generate signals. A special code processes the channel for the last several periods to identify the trend direction. Advantages Automatic trading mode, no need manual

ITM Breach ITM Breach 作为一款突破类型的交易策略他有很好的稳定性,适用于所用的货币兑 但是我还是重点推荐只挂GBPUSD这一个货币,当然我们也会发现在EURUSD USDJPY 等货币也会出现不错的效果 ITM Breach 不属于超短线头皮,在交易中你会发现它的盈利通常都会在200-500点可能甚至更多 ITM Breach会自动根据动能力度来调整开仓手数以及止损距离 运行周期 1 H 推荐使用 ECN账户类型 如 Exness ,Tickmill 等延迟滑点较小的平台 如果你想拥有Exness的0点差的账户可以点击此处获取开户链接 参数说明 •.TradingLot=0.2; //动态仓位调整----自动判断行情力度来决定开仓的大小 2.WeightedStopLoss=360; //动态止损距离----自动判断止损点数 3.AllowedMaxSpread=50; //点差控制 ----平台点差超过设定值停止开仓

Smart Psar its an strategy indicator, based on the strategy of parabolic sar and exponencial moving average of 30 periods, when them aim to a long trend, then a white arrow will spawn in the high of the candle and it will a draw a line to follow the trade near the candles , before a time when the conditions are gived ,then a close position signal will be appear like a white check,but also if them aim to a shoty trend, then the arrow will be turn yellow spawning in the low of the candle and it wi

A trading range takes place when a financial instrument (stocks, indices, bonds, commodities, Forex currencies or cryptocurrencies) oscillates between two upwards and downwards boundaries for a period of time. This Indicator tool help us to view range on the chart bar per bars, also set range in percent and get clean posicion. Range trading works best in the absence of a trend. When the markets lack a clear direction, that’s when these consolidation periods settle in. Alternatively, more exper
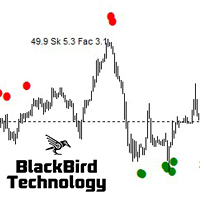
Dear Trader, this is one of the most powerful signals you will find in the market place. I worked many months to improve the accuracy. Check for yourself with the demo version. Parameters are set for EURUSD. I can assist you to configure it for any other symbol or TF. It can be configured to generate more of less in-trend or contra-trend signals. Extreme Swing Indicator is a no-nonsense, no delay, no repaint indicator ! It selects buy/sell entry signals based on a number of swing calculations a

インジケーターは、古典的なガンの角度と同様に、(特定のキャンドルをクリックした後)トレンドラインのファンを構築します。インジケーターの特徴は、固定スケールで角度を作成するだけでなく、特定の数のバーの平均価格を使用することです(オプション)。
インジケーターの角度の平均価格を計算する方法は2つあります(オプション)。
1)高値から安値への(特定の数のバーの)平均価格の動きの計算。
2)平均価格の計算はオープンからクローズに移動します。
オプション:
1.Method -コーナーを構築する方法。
2. FixedScale-固定スケール(メソッドでFixed_Scaleが選択されている場合)。
3.SecondaryAngles-二次角度を描画するための許可を制御します。
4.RayRight-トレンドラインの光線を設定します。
5.DrawBackground-背景として線を描画します。
6.AnglesQuantity-角度の数。
7. Bars_To_Process-期間、バーの数、これに基づいて平均価格が決定され、角度の「速度」。ゼロ以下の場合、すべての履歴

Sharp expert system works with a deposit of $ 100! The classic method of scalping. It is also worth noting that with the allowable level of the spread, the bot goes through any historical period on any currency pair.
The key for the Sharp bot is the spread, it works with default settings, it is possible to work with a spread of up to 10. If the spread is more than 10, then you need to select other settings. Testing should be performed with a spread of up to 10 on all ticks. There is no point i

The GBP index is an index (or measure) of the value of the Great British Pound relative to a basket of foreign currencies, often referred to as a basket Britian. trade partners' currencies. The Index goes up when the great british pound gains "strength" (value) when compared to other currencies. Displays a GBP chart in a separate window of the current chart. Based on EURGBP, GBPSEK, GBPUSD, GBPJPY, GBPCHF . All these pairs should be added to Market Watch for indicator to work. customizable mov

Moving Average of Momentum This indicator shows you trend and also how strenght it is together. You can use this indicator for your own experts with iCustom() Momentum is in the buffer ( 0 ) and moving average is in the buffer ( 1 ) there are afew parameters for using this indicator on different currencies and different time frames. you can test it and optimize it . Input Parameters: MomentumPeriod: default is 40 SignalMaPeriod : default is 28 SignalMAMode : default is SSMA

Tradingscenes Trading Panel
How will Trading Panel work ? Trading Panel is created as an Expert Advisor, which will enable traders to set pending orders, or mass pending orders in different types Limit orders with additional functions for taking profit as partial, trailing stop and also taking profit with differences price levels; let’s explain in every single functions for you as following parts: Read the full description here: https://drive.google.com/file/d/10O10dBLLUcdT3MdPvKqO7L3CIFR

Bitcoin Alert utility : This utility provides helpful Bitcoin infomation including : Order Book from 3 brokers Bitfinex, Binance and Bitmex help you make the decisions to open any long or short. https://c.mql5.com/31/424/bitcoin-alert-screen-7997.jpg
For retail traders, we couldn’t know the real incoming volume in currency market from big brokers. But in cryptocurrency, there are many brokers offer us the information. And from my perspective Bids and Asks volume from many bitcoin borker have a
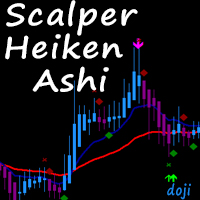
There are several types of Patterns, We choose Doji that is used for continuation and trend reversals.
Signal types : #1 Premium Signal- ---------------- Doji should have the colour of the expected direction change along with normal candle colour matching direction.
#2 Secondary Signal ---------------- Doji has the perfect formation however the bar maybe in the same colour as the previous bar but the candle colour has new direction colour.
Stochastics-Filter: ---------------- The Stochas

Moving Average protec ======================================
The Robot is based on one standard moving average Indicator.No other Indicator required ========================================== The ea is based on a simple Moving average crossover.The default settings are already profitable.But you can change the settings and decide which averages you wan to cross. =============================================================================================== This Robot is fully automated and has

Gold Sell EA pro
Welcome to the Gold Sell Ea pro.
This Gold Robot does only sell trades The Robot is based on one standard Indicator.No other Indicator required =============================================================================================== This Robot is fully automated and has been created for everyone. The Robot works also on cent accounts. =============================================================================================== => works on all Time Frames from 1Minut

Icebreaker trend indicator provides an opportunity to classify the direction of price movement, determining its strength. The solution to this problem helps to enter the market on time. You can not only see the direction of the trend but also the levels by which you can work.
The indicator determines the prevailing trend in the price chart. But not only, but also analyzes the price movement, and indicate the points of possible reversals. This contributes to the quick and optimal opening of buy

Reflector is an auxiliary tool for technical analysis, which helps to determine the direction of the trend: either upward or downward price movement on the selected trading instrument. The indicator is an indicator of a trend type; it smooths out price fluctuations during signal formation by averaging data. The indicator uses calculations designed to smooth out sharp fluctuations that do not affect the overall picture of price movement.
A trend can be increasing (bullish trend) and decreasing
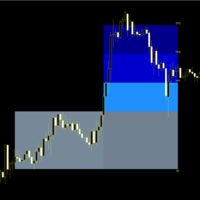
NO REPAINT The system combines several analytical techniques and presents BUY/SELL signals in an easy-to-read form. You don’t have to be a professional to use it. Aggressive TP SL can make amazingly accurate market predictions by constantly auto-analyzing every price movement, trading patterns and with the help of complex trading algorithms.
This indicator main task is to look for gravity zones and generate buy/sell signal with exact SL and TPs location. When specified conditions are fulfi

UPDATE 2020: Download Source Code - follow the link to the website in my profile!
" Clown Trader Pro " is a fully automated short-term (M1/M5) and medium-term (H1/H4) trading robot. You can choose between RSI- or CCI- trading strategy! Buy ONE get TWO .
No low spread needed!
Clown Trader PRo automatically analyzes CCI-values. Each time either the CCI or RSI comes from the overbought zone crossing the given upper level the robot will open sell-orders automatically. The lot-size will be inc

---> Check all the other products <---
The Multi Time Frame Chandelier Channel is a good synthesis of the chandelier trailing stop and let you analyze the trend.
Enter when the price breaks one of the two lines, then trail using the opposite line. Ideal for scalping, entering after the dot appears.
Plenty of customization: Choose the lookback period, the longer, the slower Choose the Time Frame to use (must be greater or equal your chart TF Play around with the options to get the opti

Multi Strategies Combined Signal All in One Multi Strategies Single Combined Select from up to 6 Strategies solo or Combine different strategies for signal generation (Combining more than 2 strategies may LIMIT a lot the number of signals)! ALL inputs and Strategies selection From Chart !!! Also Inputs editing from Chart !!! Push your strategy bottom (one strategy) OR Combine signal from as may strategies (up to 6) : Selected and enabled strategies will be in GREEN !!! 1- BUY SELL areas 2-

FEATURES OF THE HELPTRADER TO ENTER THE MARKET INDICATOR ! four types of moving averages for building a channel; ! ability to select the width of the flat (Central MA) and the margin for the channel borders; ! four options for the display channel; ! three settings for the appearance of the arrow signal; !customizable notification system. The arrow channel indicator HelpTrader to Enter the Market, due to its variability, can become a fairly effective tool for trading in combination with other in
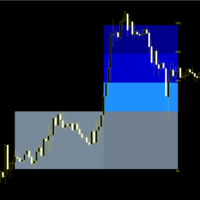
NO REPAINT The system combines several analytical techniques and presents BUY/SELL signals in an easy-to-read form. You don’t have to be a professional to use it. Conservative TP SL can make amazingly accurate market predictions by constantly auto-analyzing every price movement, trading patterns and with the help of complex trading algorithms. This indicator main task is to look for gravity zones and generate buy/sell signal with exact SL and TPs location. When specified conditions are fulf

This EA has been developed, tested and traded live for EURUSD M15 TF. Everything is ready for immediate use on real account. Very SIMPLE STRATEGY with only FEW PARAMETERS. Strategy is based on ICHIMOKU indicator . It enters if volatility raise after some time of consolidation . It uses STOP pending orders with FIXED STOP LOSS. To catch the profits there are BREAKEVEN and TRAILING PROFIT functions in the strategy . At 9:00 pm we are closing trading every Friday to prevent from weekly gaps

The indicator draws support and resistance lines on an important part of the chart for making decisions. After the trend line appears, you can trade for a breakout or rebound from it, as well as place orders near it. Outdated trend lines are deleted automatically. Thus, we always deal with the most up-to-date lines. The indicator is not redrawn .
Settings:
Size_History - the size of the calculated history. Num_Candles_extremum - the number of candles on each side of the extremum. Type_Arrow

这里是最大的自动交易应用商店。是自动交易和技术指标的开发人员能够获得他们辛勤工作应得奖赏的地方。在成功发布市场产品方面,很难高估标识,描述和截图的角色。如果应用设计简陋,潜在买家将很容易忽视它。决定性的购买之所以产生,得益于市场展窗上吸引眼球的产品标识。标识必须具有让潜在买家想要下载的吸引力。这就是恰当的设计是成功的关键的原因。 因为产品标识整体大小不能超过200x200像素(实际上在主要橱窗展示的大小比那个更小),在有限的空间充分展示是非常重要的,以便于潜在买家获得良好的第一印象。例如,让我们看一下EA交易。它不仅有一个设计精美的标识,并且在光标悬停的时候还会弹出主要理念的简要说明。 很好解决。

Indicator designed for binary options trading buy signals come along with hiding a new candle blue arrow on histogram buy signal red arrow on histogram sell signal buy worth 1 or 2 candles the signal appears with the opening of a new candle but may appear during its formation it’s worth entering the deal only when the signal has arrived at the opening, the signals do not disappear Recommended currency pairs: Any Timeframe: up to H1 You can customize the PERIOD parameter to your trading style Rec

https://pdfhost.io/v/XFFnqY8Ow_The_Boogie_Pips_v2_Manualpdf.pdf NOTE: The EA open and close trades automatically. It only open one position at a time and close it at high profit or less loss. A next position will be opened whenever the EA Strategy requirements are met. Watch our video to see how it works INPUTS: Use Pips, Trade Size, Maximum Spread, Adjusted OnInit, Maximum Stop Loss, Maximum Take Profit, Audible Alerts, Push Notifications, Maximum Open Trades, Hedging
BROKERS: ECN or STP
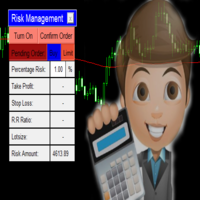
Every trading guru, every YouTube tutorial, every trading book and every experienced trader tells us to risk a certain predetermined percentage of our account on a trade. (This isn't gambling! They said). But what they don't tell us is the number of computations it takes to balance the calculations of lot size, percentage risk and risk reward ratio all while ensuring the stoploss is the right number of pips away. Enter The Forex Calculator. This Expert adviser is designed to make your trading s

Matematik Logik Reversal 1.23 MLR v 1.23 - это математический, автоматизированный конструктор для создания множественных торговых тактик, на любом инструменте рынка форекс, в зависимости от поведения цены в тот, или иной период времени. Первый эксперт, который останется вашим автоматизированным помощником в торговле на форекс навсегда! Основные преимущества
Исполь

Email and push notification Alert This is very powerful tool to get Detailed view of all of your trading on same spot. it can send 2 types of alerts, Email Alerts Push Notification
1: Email Alert email alerts are consist of 4 sections Section 1 includes Account number and name details Section 2 includes Account Balance Equity and Floating Profit/Loss details. Section 3 includes Pair wise Profit and loss Section 4 includes Pair wise+Order wise Detailed view of all trades. its includes numbers

Standart MACD indicator but All parameters can be changed for users. Extern Inputs: FastMA method : Simple, Exponential, Smoothed and Linear Weighted FastMA Price : Close, Open, Low, High, Median, Typical and Weighted FastMA count : Default is 12 SlowMA Method : Simple, Exponential, Smoothed and Linear Weighted SlowMA Price : Close, Open, Low, High, Median, Typical and Weighted SlowMA Count : Default is 26 Draw Mode : Line or Histogram SignalMA Method : Simple, Exponential,

XperX WPR Hit uses WPR (Williams' PercentRange) to determine the highest/Lowest Hit count from the top and bottom to make a trade order. It is equipped with a Efficient Savior Martingale which do a Reverse Buy/Sell before activating the Martingale. The Reverse Buy/Sell will help to balance user's Margin before activating Martinglae . Addon: Display ReadingPanel Realtime update with Bid and Wpr readings. Auto Display Setting Candles Best Timing 5mins, 30mins and 1 hour. Trade Settings: Lots S

Gold Magnet Gold Magnet EA is New EA based on advance strategy that is based on chart behavior of Gold. more than 6 indicators are used to build up the strategy which is more than 80% true in testing. Strategy Nature: Gold magnet is actually based on trend following strategy. Installation Instructions: This EA is build for MT4 only, we are working on MT5 compatible version. Use M15 Time frame. It is highly recommended to use built in default settings. This EA stored Some trading information i

MT4 to Telegram Signal Sender is full featured tool which enables signal providers to send signals from MT4 to telegram groups or channels without delaying. It does not matter if the group or channel is private or public. What you only need is to provide channel or group tokens and IDs, then you got go.
This is unlike EA in the market, it's well developed and advance using and easy friendly to use.
you can On or Off any option you want to customize to send in the telegram channel. The EA also

この指標は、いくつかの複雑なアルゴリズムを使用して、トレンドを正確に判断します。すべてのアルゴリズムは、プライスアクションに基づいているので、一方では、エントリーがトレンドの終わりにのみ行われ、あなたはすでに数pips未満を持っていることを、例えば、時間の損失はありませんが、これは、このインジケータでは起こりません。一方で、国際取引はほぼ完全にプライスアクションをベースにしているので、こちらの方が安全性も高いです。
入力パラメータ「数」は、表示器が矢印を表示するために必要な適用条件の数である。この値は5を超えてはなりません。
この指標は、エキスパート・アドバイザーへの統合にも非常に適しています。。

The indicator is usefull for: binary options and forex trading..
.Support all trading Pairs.
--->Recommended expiration time for 3 to 5 candles. Exemple:
Time frame 1 minute then expiration time will be 3 to 5 minutes.
The indicator support MT2trading autotrading platform ;
SELL BUFFER : 0 (red arrow)
BUY BUFFER : 1 ( green arraw)
See #screenshot1.
This is a premium powerfull indicator show hight daily winrate..

スキャルピングインスタントインジケーター。
インディケータの地下値と一緒に売買するシグナルは矢印で示されます。
矢印と4つの時間枠を表示する地下インジケーターが予測で一致する場合、強い信号が考慮されます。
このインディケータには、1つの結果にまとめられた多くのアルゴリズムとタスクが含まれています。これは、Skalpingインスタントインディケータが提供します。つまり、トレーダーに市場の方向性を通知します。したがって、彼は与える
1.スキャルピングシグナル(図1)図1-D1に示すように、D1チャートの選択された期間とインジケーターの地下セクションに買いシグナルがあります。信号は遅滞なく到着します。この場合、スキャルピング戦略を使用して取引することをお勧めします。
2.信号補正またはトレンド。 図2に示すように、地下室のグラフのすべての期間。すべての期間はレッドゾーン->売りポジションにあります。チャート自体の時間枠と地下インジケーターが一致したときに色が変わるまで取引を保持します。 そのため、インジケーターは他の戦略に非常に適応できます。
主要通貨ペアで使用することをお勧め
MetaTraderマーケットはトレーダーのための自動売買ロボットやテクニカル指標を備えており、 ターミナルから直接利用することができます。
MQL5.community支払いシステムはMetaTraderサービス上のトランザクションのためにMQL5.comサイトに登録したすべてのユーザーに利用可能です。WebMoney、PayPal または銀行カードを使っての入金や出金が可能です。
取引の機会を逃しています。
- 無料取引アプリ
- 8千を超えるシグナルをコピー
- 金融ニュースで金融マーケットを探索
新規登録
ログイン