YouTubeにあるマーケットチュートリアルビデオをご覧ください
ロボットや指標を購入する
仮想ホスティングで
EAを実行
EAを実行
ロボットや指標を購入前にテストする
マーケットで収入を得る
販売のためにプロダクトをプレゼンテーションする方法
MetaTrader 4のためのエキスパートアドバイザーとインディケータ - 302

This indicator is based on a combination of 2 different SuperTrend, a trend following indicator developed by Oliver Seban. You can find some implementation in the following pages: https://www.mql5.com/en/code/8268 https://www.mql5.com/en/code/10851 and others. Double ST indicator combines 2 different SuperTrends to have the trend direction at a glance. Simply insert the values for the 2 SuperTrends and you will see a ribbon with 3 different colors: red means that price is under both the SuperTre

A trend indicator based on the CCI indicator. ZI Trend PaintBar Indicator is an improved variant of the CCI indicator, which shows the moment of trend following quite accurately. Combination of CCI indicator makes a better use of these advantages: Colored candlesticks showing the trend direction based on CCI indicator. Messages/Sounds (Notifications and sound settings) Mail - enable/disable sending emails. Alerts - enable/disable messages in the terminal when signals occur. Push - enable/disable
Merlin Grid is a fully automated EA that uses a clever combination of grid, price action, fast scalping, smart filtering and artificial intellect (artilect) to determine profitable entry and exit points into the FX market. Merlin Grid is optimized and backtested over a period of 8 years (2010–2018). Download the free demo version and give it a run yourself. Visit Merlin Grid's blog for set files, news, updates, wish list, etc.
Characteristics FIFO compliance option. Price averaging of same kind

Introduction to Harmonic Volatility Indicator Harmonic Volatility Indicator is the first technical analysis applying the Fibonacci analysis to the financial volatility. Harmonic volatility indicator is another level of price action trading tool, which combines robust Fibonacci ratios (0.618, 0.382, etc.) with volatility. Originally, Harmonic Volatility Indicator was developed to overcome the limitation and the weakness of Gann’s Angle, also known as Gann’s Fan. We have demonstrated that Harmonic

Trend Control is a trend-following Expert Advisor that determines the trend direction and closes positions only at trend reversals. The EA is equipped with a minimum of the most necessary functions to simplify working with it. The EA is most suitable for working on the EURUSD currency pair and the M5 timeframe. The EA is suitable for both five-digit quotes and four-digit quotes. The EA is equipped with a Stop Loss. The EA does not use any risky systems which increase the volume or increasing the

News Robo Expert Advisor は、ニューストレーダーがニュースリリース中に隠れストップロスを含む未決注文をオープンできるように設計された強力なツールです。取引体験を向上させ、取引を保護するいくつかの機能を提供します。 News Robo の重要な機能の 1 つは、ストップロスの隠蔽です。これは、マーケットメーカーブローカーからストップロスを隠したいニューストレーダーにとって理想的です。利益を得るポジションが得られるとストップロスが自動的に表示されるため、利益を効果的に確保できます。さらに、エキスパートアドバイザーは適切なリスク管理手法を採用して、取引資金を確実に保護します。 News Robo では、保留中の注文を開くには、クイック モードとタイム モードの 2 つのオプションがあります。クイック モードを使用すると、デフォルト設定に基づいて保留中の注文を迅速にオープンできるため、ニュース時間を手動で設定するのを忘れた場合に便利なソリューションとなります。一方、時間モードを使用すると、未決注文をオープンする正確な時間を指定できるため、より柔軟でカスタマイズが可能にな

An indicator of round levels. A range of important price levels with sound and text alerts, which are generated when the current Bid price of a currency pair is equal to a round number. This indicator visually shows the trader true support and resistance levels, which are used by most of traders and trading robots. The advantage provided by this indicator is that the trader using this indicator on a chart does not need to draw any additional levels. Round price levels represent a certain barrier

This Expert Advisor is designed for working with all major currency pairs on all timeframes (M1-D1). Micro Martingale is a flexible concept of Martingale, which can work as Full Martingale (Average closing) or Martingale combined with trailing, stop loss and take profit, depending on parameter settings. Orders are triggered based on mathematical algorithms of price correction/reversal. The Expert Advisor will work better during high fluctuations.
Warning Martingale System is at high risk. For t
This is a grid Expert Advisor. It features several trading strategies based on Moving Average. It works on minute bar Open prices. Virtual trailing stop, stop loss and take profit can be set in pips, in the deposit currency or as a percentage of the balance. Depending on the settings, different orders may be opened for diversifying risks. Their closure can be either an oppositely directed or unidirectional basket of orders. The order grid is adaptive and is made of market orders. If the price ha
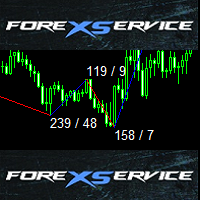
This is standard ZigZag indicator with some cool additional features - colored range, amount of pips between highs and lows and also amount of candles between indicator range.
Default ZigZag indicator variables depthZigZag deviationZigZag backstepZigZag
Bullish market variables lineUpColor - line color lineUpStyle - line style lineUpWidth - line thickness textUpColor - color of text with amount of pips and candles textUpFont - font of text with amount of pips and candles textUpSize - size of t
This indicator is based on the Stochastic on one or more timeframes and on any Currency Cross Pair. The indicator generates an alert message when it detects a buy or sell signal. It also draws a vertical bar on the price chart: green for buy or red for sell, yellow if flat. Alert messages and Vertical bars for BUY or SELL, are generated when the Stochastic is consistent for all chosen timeframes else a FLAT signal is generated.
Features Easy flexible settings: Detection of the Stochastic signal

This Expert Advisor is based on a scalping strategy that uses Moving Average Envelopes Indicator . The Moving Average Envelopes indicator reflects the price overbought or oversold conditions, which help to identify the entry or exit points as well as possible trend break-downs. The moving average envelopes consist of an upper envelope placed above, and a lower envelope placed below. The distance between the moving average envelopes or the width of the bands/channels based on the volatility measu

SDX is our latest and most advanced dashboard for manual trading. The app is based on our proven grid platform and offers unique trading opportunities for both experienced and new traders. This unique combination of innovative tools is designed to simplify the trading process and to give you real advantage. The system is ideal for short term trend following, counter-trend trading and scalping on the Forex market.
Main Features Ability to work simultaneously with 10 pairs from one screen. Abilit

The Momentum Channel indicator works according to the daily price index. The indicator is used to analyze the parity price. This analysis is done through channels. channels are used to find trend return points. The indicator has 3 channel lines. these are the lines at 30, 50, and 70 levels. The 70 level is the overbought territory. Price movements in 70 and above indicate that the chart will fall in the near future. Price movements at 30 and below indicate that the chart will rise in near future

TSO Bollinger Bandit Strategy is an indicator based on the Bollinger Bandit Trading Strategy as presented in the book Building Winning Trading Systems with TradeStation by G. Pruitt and J. R. Hill. SCANNER is included . Now with Scanner you can find trading opportunities and setups easily and faster.
Features A complete entry and exit strategy for trending markets. Get email / push notifications when an entry signal occurs. The indicator is not repainting. Can easily be used in an EA. (see For

SFO Trend Racer system is a trend indicator created by the CEO and Founder of " Simple Forex Options ", Tevin Marshall . It serves 6 different functions all in one. It shows the trader the entry signals as well as exit signals, whether it is a take profit or a stop loss. It also uses trend filters and signal confirmations so that the trader is able to make the most logically fit decision. Trend Racer uses various filters and specific settings from a plethora of indicators. The beauty in this ind

Compas - is a fully automatic intraday trading robot, that trades mainly in the Pacific session. The EA Compas is safe and trades one order with a fixed Stop Loss. EA Compas is suitable for investment accounts that require reduced risks. The performance of EA Compas should be evaluated over long distances.
The default settings are for GBPCAD M1
Setting For the operation to be correct, follow the instructions: To download the news list, it is necessary to add http://ec.forexprostools.com to th

This is a short-term scalping Expert Advisor making a small number of trades. The EA follows the price using BuyStop and SellStop orders at a fixed distance and catching fast movements of currency pair quotes. It has a minimum number of adjustable parameters.
The robot is ideal for a trader as an addition to a manual strategy or in conjunction with another EA. The EA distinguishes its trades by a magic number. Pending orders, like market ones, are not left for weekends and are closed 10 minutes

CCI アクション エキスパート アドバイザーは、 CCI (商品チャネル インデックス) 戦略 を自動化するように設計された強力なツールで、トレーダーが CCI レベルのタッチを活用できるようにします。ユーザーフレンドリーな設定と堅牢なリスク管理システムを備えたこの EA は、CCI インジケーターを取引アプローチに組み込もうとしているトレーダーに信頼性が高く効率的なソリューションを提供します。 この Expert Advisor の重要な機能の 1 つは、トレーダーが取引資金の管理を維持できるようにする適切なリスク管理システムです。ロットサイズと最大リスクを証拠金合計のパーセンテージとして指定することで、トレーダーは市場へのエクスポージャーを効果的に管理し、投資を保護できます。 EA は完全に自動的に動作し、事前定義された CCI レベルのパラメーターに基づいて取引を実行します。指定された CCI レベルに到達すると、EA はそれに応じて注文をオープンし、トレーダーは CCI 指標によって識別される潜在的な市場の動きを利用できるようになります。この自動化により、CCI シグナル

This panel is designed for quick visual search for the price action patterns on several instruments simultaneously. It is possible to add and remove instruments. Clicking the signal button allows you to quickly move to the chart with the identified pattern and timeframe. The panel searches for 8 candlestick patterns: PIN-BAR, EXTERNAL BAR, INSIDE BAR, DOJI, LEVEL, HIGH/LOW OF N BAR, FAKEY, ONE-WAY N BAR. Any of the patterns or the periods can be disabled by clicking its title. It can also search

Schrodinger trading machine is an Expert Advisor (robot) for any financial instrument on MetaTrader 4 platform. Both main input parameters (N and M) are optimized for EURUSD H1 . Of course, you are able to optimize these parameters for any currency pair and timeframe. For example, the main input parameters for GBPUSD H1: N = 5.0 and M = 12 The main input parameters N and M can be any positive numbers. These are input parameters (weight coefficients) of the one layer neural network. N is a double
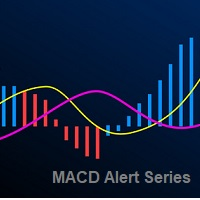
The Moving Average Convergence Divergence Indicator (MACD) is both a trend–seeking and momentum indicator which uses several exponential moving averages set to closing prices to generate trading signals. We added several types of alerts to aid in your search for better opportunities in the market.
Product Features Email Alert Sound alert Push Notification (Alerts can be sent to your mobile phone) Signs on chart Alert box Possibility to work with both histogram and visual line Alert on zero hist
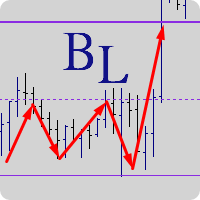
"Balance cost" analysis method Created by Trader AFI_man. The BalanceLines indicator plots balance levels for a given time interval. The balance line divides the market volume into sellers (above the balance level) and buyers (below the balance level). In any movement, if the price is fixes above the balance level, there comes a moment when sellers are unable to hold off buyers, which leads to a growth. Similarly, when the price is fixed below the balance level, there comes a moment when buyers

GUME Simple Entry indicates the buy and sell entry points of all instrument by analyzing the market movement. It is designed to indicate entry points for any currency pair and all trading periods. It is optimized for M5 for scalping and M15 and higher periods for long term trading. It is also optimized for EURUSD, GBPUSD, GBPJPY, EURJPY and XAUUSD. It is designed to display a colored arrow up or down for buy or sell signal respectively for convenience and ease of use.
Indicator Parameters time
This specific indicator is designed to solve one specific problem : In case the connection to the broker's server is lost, remember when the connection was lost, and at what time the connection was resumed. Thus, the user sees the time when there was no connection to the broker's server . An Alert box is displayed on the screen, which records when the connection was lost and resumed. Of course, the indicator will not react to slight losses of packets. For better visualization of the indicator op

This Expert Advisor's main strategy is based on the usage of two kind of indicators: two built-in shifted RSI to measure the asset prices oscillations and a Parabolic SAR to check the prices trends. It combines these indicators signals in order to get stronger signals and ensure the EA will do good trading operations. The second strategy consists of sending a new opposite order against a losing order since it reaches the minimum negative profit defined by the "Minimum Loss Value to Reverse (in c
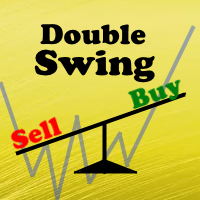
The Expert Advisor's operating algorithm is based on a priori known truth 'The price does not stand still'. We add math and logic to this truth and receive an Expert Advisor, which allows catching almost all the movements in the market. When an order is opened, a breakout Stop order of a larger volume is set instead of Stop Loss. If the price reaches this order, another pending Stop order of a larger volume is placed. This approach is called Swing or Pendulum Swing . Double Swing uses this appro
The Average Daily Range shows the dynamic levels of average pip range on a pair measured based on the daily Highs and Lows over a certain periods. You can use the ADR to visualize potential price action outside the average daily move. When ADR is above average, it means that the daily volatility is higher than usual. The ADR can be helpful in setting targets for positions. If the ADR shows you that a pair has an average daily range of 80 pips, then it might be wise to tighten up your target

InvestorPRO is a stable Expert Advisor for professional traders. The EA trades in a fully automated mode. The trading algorithm of the EA is based on analysis of numerous factors that affect the dynamics of an instrument. This EA has been created to provide the trader with a comfortable environment for investment in the financial instruments of the Forex market.
The EA is installed in the usual way and is suitable for trading any trading symbols. The EA is designed for trading on the D1 timefram
The utility is created to assist traders. How it works
Changes in the balance are displayed as a green or red line on the screen. The market entry moments are displayed on the chart both for current deals and deals in history. If there are several orders of the same type, the utility calculates the average price and marks it with white dashes. The utility can send a report on balance change to the user's email.
By user's command Modification of all TP (SL) of Selected orders on the Current pair

Turbo Scalp is a scalper based on mathematical analysis of the market situation, for working under any market conditions. The scalper moves along the expected trend line and closes positions at a trend reversal. The EA uses an algorithm based on rough mathematics to determine the expected trend line. The EA does not use any indicators. The EA trades around the clock. When deals in one direction is closed, it opens deals in the opposite direction.
The EA is most suitable for working on the EURUS
Manage your risk and make your trading easier A free version with no restriction, only limited up to 20 trades, is available here . With Fx Easy Trade you can create orders easily and system will calculate automatically the position size, create statistical report, draw supports and resistances on all timeframe you have in one click, create alerts, send notification, scan the market, etc. More details below. Define your risk in euro or dollar (for example, 20€), and the system will calculate pos

NC Strength EA is a trending single EA system that supports single currency or multi currency operations. The EA's algorithm tries to determine a trend reversal in the short term and send orders. The risk level can be flexibly set. Of course, risk and profit are often proportional too.
Parameters MoneyManagementType: Fund management model. Risk: Percentage of funding risk. Lots: Order Lots. MagicNumber: Chart unique identifier (please set different values for multiple charts). RiakLevel: The ri

このインジケーターは、他の(および非標準)時間枠の高値/安値/始値/終値レベルを示します - 年、6 か月、4 か月、3 か月、2 か月、月、週、日、H3-H6-H8-H12 時間 M45 M90。 キャンドルを開くシフトを設定し、仮想キャンドルを構築することもできます。 これらの時間枠のいずれかの「期間区切り記号」は、垂直線の形式で使用できます。 現在または以前のレベルのブレイクアウト (昨日/先週の高値/安値ラインのブレイクアウトなど) に対してアラートを設定できます。 すべてのレベルを 1 ピリオド右にシフトすることもできます。 つまり、前の期間の高値/安値が現在の期間に表示されます.
パラメーター Number of levels to calculate (0-all) — 画面に表示されるバーの数。 Change the opening of bars (hours) — ローソク足の始点を n 時間ずつシフトします。 インジケーターは、新しい開始時間を考慮して仮想バーを描画します。 MN1 より上の期間は変更されません。 Move the levels to th

This long-term trading system works on 9 pairs and timeframe. The Expert Advisor uses various trading systems, such as trend trading, counter-trend trading and others. The EA has the built-in smart adaptive profit taking filter. The robot has been optimized for each currency and timeframe simultaneously. It does not need arrival of every tick and high execution speed. The EA works with all brokers. EA uses economic news. No martingale, grid and other risky strategies. Use multicurrency testing

This Expert Advisor trades only following the market directions. So if the market goes north buy positions will be added, and if the market goes south sell positions will be added to a specific number of pips from the last entry. If a market range is set the expert will not open another position but wait for the breakout. The open positions are managed until they are closed with a profit. You can limit the number of opened positions. Only one position can be opened on a bar. A useful tool when t
Round Lockは、ダイナミックポジションロック機能を備えたスマートアドバイザーです。Round Lockは、ダイナミックポジションロック機能を備えたインテリジェントなアドバイザーであり、段階的なポジション増加と市場への動的な適応を備えた双方向注文ロック戦略を実行する高度なトレーディングアドバイザーです。 ラウンドロックの利点: ポジションロックによるリスク管理、 市場のトレンド分野におけるダイナミックなボリューム成長、 制限に応じた柔軟な動作設定、 フラットとトレンドのフェーズに適しており、それぞれの状況で結果を最適化します。 保護メカニズムを備えた平均化戦略とグリッドアプローチの自動化。 MT4バージョン -> こちら / トラブルシューティング -> こちら アドバイザーは、反対方向の注文を2つオープンします。そのうちの1つが利益確定で決済されると、2つの注文が再度オープンされます。注文量は、Multiplier_Volume乗数のボリュームとアドバイザーがオープンした注文数に応じて増加します。新しいオープンペアごとに、同数の注文がオープンされ、互いにロックされます。同じ種

Everlasting Grid Expert Advisor is a grid scalping robot and is able to work with any currency pair on M15 timeframe (currencies with lower spreads are preferred). It uses Moving Averages to find trend and place orders. If it is a false signal, the robot places a recovery grid orders to recover the losses. All the positions are closed when it reaches the target profit defined in settings.
Requirements Optimized to work on EURUSD M15. Minimum recommended deposit is $3000. An ECN broker with low
The Signal SASON indicator is designed to generate trading signals. It works to find potential trade entry points. The signals are found by analyzing a series of candlestick movements and a set of algorithms. This indicator calculates the reversal points of the pair you are using. It does not have deceptive properties like re-painting.
Rules and Features When a signal arrives, it is recommended to use take profit and stop loss level. Use timeframe M15 and up. It works on all currency pairs, exc

Crossover Action Expert Advisor は、 最も人気のある取引戦略の 1 つである移動 平均クロスオーバー戦略 を自動化するように設計された高度なツールです。直感的なインターフェイスと強力な機能を備えたこのエキスパートアドバイザーは、手動取引の複雑さを取り除き、移動平均クロスオーバーに基づいて自動的に取引を実行します。 このエキスパートアドバイザーの重要な機能の 1 つは、適切なリスク管理システムであり、適切なロットサイズと最大リスク制限で取引が実行されることを保証します。これは、取引資金を保護し、潜在的な損失を最小限に抑えるのに役立ちます。 Expert Advisor は完全に自動で動作するため、手動介入の必要がありません。潜在的なトレンドの反転または継続を利用して、移動平均のクロスオーバーで注文をオープンします。さらに、取引の進行に応じて利益を保護するためにストップロスレベルを自動的に調整します。ストップロスレベルは隠されているため、取引にさらなる安全性が追加されます。 信号の信頼性を高めるために、エキスパートアドバイザーは高度なフィルタリング技術を適用
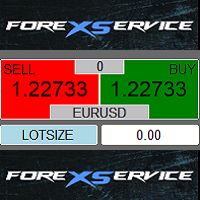
One Click Trader is a tool designed for MetaTrader 4 platform, which enables you to take your trading to the next level. It enables you to open, manage and close your trades in simple an efficient way by just one click of your mouse button. Up arrow minimizes the OCT panel Down arrow maximizes the OCT panel Right arrow displays the next panel with additional features Left arrow hides the panel with additional features Red SELL button enables you to open short market orders Red SELL STOP button e
Heterodyne ヘテロダインは、強度指数インジケーター(RSI)に基づく発振器です。インジケーターの読み取り値の現在の値が、指定された期間の最大および最小のインジケーター値と比較され、平均値が計算されます。インジケーターの読み取り値も、移動平均(MA)法を使用して平滑化されます。買いのシグナルは、インジケーターが下から上に特定のレベルを横切ることであり、売りのシグナルは、インジケーターが上から下に特定のレベルを横切ることです。
設定 RSIPeriod-インジケーター期間 係数-最大値と最小値を見つけるための係数 正中線-信号線レベル Applied_Price-中古価格 MAPeriod-平滑化期間 MAMethod-アンチエイリアシングメソッド アラート-カスタムデータを含むダイアログボックスを有効にします Text_BUY-買いシグナルのカスタムテキスト Text_SELL-売りシグナルのカスタムテキスト Send_Mail- [メール]タブの設定ウィンドウで指定されたアドレスにメールを送信します 件名-メールヘッダー Send_Notification- [通知]タ

The indicator has the following features Predictive Trend (Histogram) - it uses an advanced predictive probability and statistics calculation plus linear regression to know the possible trend. This must be used with at least 3 timeframes for a more accurate reading of the trend: D1, H4, H1. In some cases (subjective), you may want to use M5 for a more precise reading. Velocity (Dotted Line) - Green dotted line indicates a speed of price movement upward. Red dotted line indicates a speed of price
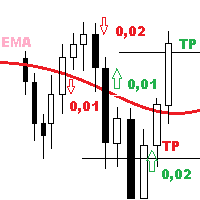
UniMartin is a universal Expert Advisor combining trend strategies, grid and martingale. The EA trades in the trend direction, making decisions based on the MA indicator (at least TrendBars amount of bars should closer for a trend to appear). If averaging is necessary, the minimum step is set for the EA. The decision on the need for averaging is made based on original methodology for determining the market volatility (the CoeffOfVolatMarket parameter can be changed from 0 to 10 with any intermed

Boxy Trader is a trading robot, which is not using indicators. The Expert calculates and trades the tops and the bottoms of the current swing with more than 70% success rate. Its robust risk management system is the key of its success. This system works on all instruments with no restrictions. Usage of Stop Loss and Take Profit, always . No martingale, no grid, no hedging. Suitable for deposits starting at $100. 100% made in Spain. Stable results, tested since 2003. Testing, determining risks an

Special Trend Oscillator is an indicator designed to detect trend change points and measure the power of the current trend. This indicator is a different model of the MACD indicator. The indicator has two channels. The blue channel is the upper line of the upward trend. The red channel line is the underscore of the downward trend. Buy when the trend line reaches the red line. Sell when the trend line reaches the blue line. Our Popular Products Super Oscillator HC Cross Signal Super Cross Trend S
The Expert Advisor calculates the divergence on the current and higher timeframes. In case the divergences coincide, the EA starts its operation. Deals have strict take profit and stop loss levels. Each deal is managed by trailing stop. The strategy involves the use of a tight stop-loss. Therefore, losing deals and/or series of losing deals are not uncommon. This EA is not suitable for those who have difficulties coping with losing deals. The EA is recommended for simultaneous use on the followi

Big Pineapple is a martingale Expert Advisor with a great diversification of operations and different systems working on 27 pairs. This increases the chances of sustained growth and reduces exposure to a single pair. The risk is very controlled. Unlike other martingale EAs, this EA is very safe with very low drawdown. The minimum deposit is 10,000 USD with 0.01 initial lot size. If you want to run it in a smaller account, you could open a cent account and run it with at least 100 USD. The EA doe

Harrow Race is an Expert Advisor that has been developed based on Harrow Order. This is the high risk version of Harrow Order, which uses decreasing Anti-Martingale lot for real orders, and increasing Martingale lot for virtual orders. This EA is for traders who are brave enough to take risk with the Anti-Martingale method. For more information about Harrow Order, you can read https://www.mql5.com/en/market/product/28456 . This EA works using the same principle as the Harrow Order. When the pric

Harmonic Master Scanner is a dynamic tool that helps harmonic traders to identify and draw harmonic patterns on the chart. Harmonic Master Scanner is a software designed to work in MetaTrader 4. Harmonic Master Scanner works based on original MetaTrader 4 Zigzag indicator and the standard harmonic patterns elements. This software can send alert and email to you when a Harmonic pattern is detected on any charts. The entry point is the "D" point. The scanner only shows the present pattern one by o

StarEA is an Expert Advisor based on the StarBot utility. The EA opens orders when the price passes trade levels calculated on the average volatility for the previous day. Stop Loss is set to the opposite level. Take Profit is not set, as the EA continues to monitor the distances covered, and partially closes the order by three levels. The EA works on the Н1 timeframe. Currency pairs: GBPUSD, EURUSD, EURGBP, USDJPY, USDCAD, USDCHF (more will be added). Set files for each pair are available in th

One of the main goals in the development of this Expert Advisor was ease of use. As a result, this EA has a minimum of parameters, which are easy to understand. At the same time, it is very flexible and customizable for almost for any instrument (currency pair).
The logic According to the given algorithm, the EA determines local support and resistance levels (at startup, the previous quotes are disregarded). When a candle closes beyond any level, a deal is opened in the same direction. By defau

I recommend you to read the product's blog (manual) from start to end so that it is clear from the beginning what the indicactor offers. This multi time frame and multi symbol indicator identifies double or triple top/bottom formations or a following neckline breakout (confirmed top/bottom). It offers filters for RSI overbought/oversold, candle patterns (pin bar, engulfing, tweezer, morning/evening star, three line strike) and divergences (MACD, OsMA, Awesome (AO), RSI, CCI, Stochastic) whic

MartinTrend trades in the market every day at certain times. To determine the trend direction, it uses a built-in original indicator on the specified number of bars of the current chart timeframe. After opening a trade, it either opens additional orders with decreased lot sizes, or averaging orders with an increase in the lot. It uses a risky martingale strategy with a constant coefficient of 2 both for decreasing the lot for additional orders and for increasing the lot for averaging. To reduce
This indicator displays an equidistant price channel, identifies short-term trends and automatically finds the best levels for the upper and lower borders of the channel. It is optimized for major timeframes and currency pairs.
Advantages visualization of short-term trends automatic setting of upper and lower channel borders suitable for scalping strategies based on a rebound from the channel borders
Parameters smooth - border smoothing coefficient. The default value is 1; pricetype - use Open

This grid Expert Advisor uses signals based on breakout of waves by R.N. Elliott. The operation principle of the Expert Advisor lies not only in accumulating positions against the trend (as all grid EAs do), but also along the trend (the principle of turtles). The unique risk control system manages the entire process from opening the grid of order to closing it. The risk control system consists in determining the critical level of lot accumulation in one direction. When a critical event occurs,

The KFX PATTERN manual Expert Advisor is a price pattern based System. Manual stands for the fact that he does not open trades independently. Only shows the individual levels with the profit target. The individual strategies are based on those of Thomas Bulkowski's books. The following Patterns have been integrated: Three Falling Peaks. Three Rising Valleys. Diamond Pattern. High and Tight Flags. Cup with Handle Pattern. Horn Top. Horn Bottom. Earnings Flag. Three Line Strike. Falling Three Meth
The Full Control is a fully automated multi-currency Expert Advisor, which applies indicator-based analysis of the market using "Stochastic", "Ichimoku" and "Volumes". It trades on the M1 timeframe using one order at a time. The EA uses the Martingale system.
The Expert Advisor Operation Principle When buy or sell conditions are detected based on the Stochastic, Ichimoku and Volumes indicators, the EA opens the first order with the initial lot (equal to StartLot) with preset Takeprofit and Stop

TwilightTrade SEES is an automated Expert Advisor based on level trading strategy, price action and some MetaTrader 4 standard indicators. With Profit Close and Profit Percent, you will control your profit and with no stop loss you will protect your balance. The money management gets the right automatic lot calculation based on your risk per trade. This system uses no grid, no martingale, no arbitrage, no hedges, no tick scalping, and the best part is running fully automatic. TwilightTrade SEES

This panel is designed for quick visual search for the price action patterns on several instruments simultaneously. It is possible to add and remove instruments. Clicking the signal button allows you to quickly move to the chart with the identified pattern and timeframe. The panel searches for 8 candlestick patterns: PIN-BAR, EXTERNAL BAR, INSIDE BAR, DOJI, LEVEL, HIGH/LOW OF N BAR, FAKEY, ONE-WAY N BAR. Any of the patterns can be disabled by clicking its title. It can also search in history (by

This is an Expert Advisor for effective management of investments, making a large number of medium-term trades. The strategy uses only price action and timing. The EA monitors and accumulates statistics of the price action, rate of tick changes, and makes trades depending on how the price has changed on a given period. The EA works with market orders in two directions simultaneously. It uses a self-adjusting algorithm for closing trades, which is based on tick data.
The EA has functions for wor
This multifunctional Expert Advisor has been created in the form of a designer and is suitable both automatic and manual trading. Its main advantage is the ability to select and adjust the strategy for the current market conditions. To recover from the drawdown, the EA fully utilizes the feature of the currency market - the price cannot remain in a narrow channel for a long time. A breakout of the flat in one direction or another is inevitable. So, by placing orders in the breakout direction, yo
Yellow mouse scalping is a fully automatic Expert Advisor designed for night trading on a calm market. The strategy is night scalping. The standard RSI and ATR indicators are used to find entry points. Closing of transactions takes place according to the author's algorithm, which significantly improves the risk control and security of the deposit. Risky strategies like "martingale" are not used. Monitoring of the advisor's work, as well as my other developments, can be viewed at https://www

This EA uses an Alligator indicator and has a classic strategy to trade as the Alligators Jaw, Teeth and Lips calculation results are compared each tick. This way, the EA opens orders at right moment and closes the orders as it reaches the right profit value. It protects your money because it is provided with: trailing stop loss to protect your profit. Once your order has a positive profit, it sets SL at a certain distance in order to keep a positive profit; Spread value limit to prevent opening

It is so very disappointing when the price does not have enough points to achieve Take Profit and makes a reversal. This EA sets virtual levels near the TakeProfit levels. This EA sets virtual levels next to TakeProfit orders. If these levels are reached by price, breakeven or trailing stop is applied for an order.
Features This EA does not set new orders. The aim of this EA is to manage stop losses of existing orders that are set by another EA or manually (magic number equals 0). For correct w

SA Assistant is an intuitive tool without complicated settings, designed to facilitate the trading operations in the MetaTrader 4 terminal. SA Assistant is not designed for working in the strategy tester. Please test the EA on a demo account before using it on a live account.
The SA Assistant EA is visually divided into 4 blocks: 1. "Information" - displays in real time: trading account balance leverage spread of the instrument the EA is attached to current account profit account equity account

The KFX High and Tight Flag pattern Indicator is part of the KFX Pattern manual Expert Advisor. The indicator shows the entry level (breakout) with the profit target and the stop loss. The strategy is based on Thomas Bulkowski's book, Encyclopedia of Chart Patterns second edition. High and tight Flags are the best performing Chart Pattern in both Bull and Bear markets. They are perfect pattern for trend following. Suitable for every Currency pair, Options, Commodities, Stocks, Indicies and Timef

The KFX Bulls and Bears indicator consolidates the Bulls and Bears Power sample indicators in one indicator. This indicator is a modification of a known Bulls/Bears power indicator by Elder. It measures distance between extreme price and moving averages.
Parameters Source - choose between Close, Open, High, Low, Median, Typical or Weighted Price. Periods - period for calculating the moving averages. MA Type - Select between Simple, Exponential, Smoothed or Linear Weighted. Verbose - Allows the

This indicator visualizes the intersection of two moving averages. (SМА, EMA, SMMA, LWMA). It has been created for visibility of signals and notification about intersections of Moving Average. Moving Average is simply the averaged value of the price for the selected timeframe (TF).
Therefore, the moving averages are used on a wide variety of timeframes, from 1 minute to a year and even decades.
Possible types of moving averages in the indicator SMA (Simple Moving Average); EMA (Exponential Movi

BullsBears Action Expert Advisor は、 ボリュームベースの市場分析に頼るトレーダー向けに設計された高度な取引ソリューションです。この EA は、Bulls と Bears のボリューム データを活用して、市場の強さに基づいて潜在的な取引機会を自動的に特定し、ユーザー定義のパラメータに従って買い注文または売り注文を実行します。完全にカスタマイズ可能で、トレーダーは複数のフィルター、リスク管理オプション、取引実行コントロールを使用して戦略を微調整できます。
この EA には、トレーダーが取引ごとに最大リスク率を定義できる強化されたリスク管理システムが含まれており、エクスポージャーを効率的に管理するのに役立ちます。ロット管理システムは、リスク率に基づいた動的なポジション サイズ設定をサポートします。トレーリング ストップ、損益分岐点、ステップ ベースの利益ロックなどの利益保護機能により、トレーダーは利益を効果的に確保できます。アラート システムが改良され、取引実行と市況に関するタイムリーなポップアップ、モバイル、および電子メール通知が提供されます。
トレ
MetaTraderマーケットは自動売買ロボットとテクニカル指標を販売するための最もいい場所です。
魅力的なデザインと説明を備えたMetaTraderプラットフォーム用アプリを開発するだけでいいのです。マーケットでプロダクトをパブリッシュして何百万ものMetaTraderユーザーに提供する方法をご覧ください。
取引の機会を逃しています。
- 無料取引アプリ
- 8千を超えるシグナルをコピー
- 金融ニュースで金融マーケットを探索
新規登録
ログイン