YouTubeにあるマーケットチュートリアルビデオをご覧ください
ロボットや指標を購入する
仮想ホスティングで
EAを実行
EAを実行
ロボットや指標を購入前にテストする
マーケットで収入を得る
販売のためにプロダクトをプレゼンテーションする方法
MetaTrader 4のための新しいエキスパートアドバイザーとインディケータ - 89

The indicator is designed to work on any trading platform. The program is based on proprietary algorithms and W.D.Ganna's mathematics, allowing you to calculate target levels of price movement based on three points with the highest degree of certainty. It is a great tool for stock trading. The indicator has three buttons: NEW - call up a triangle for calculation. DEL - delete the selected triangle. DELS - completely remove all constructions. The probability of achieving the goals is more than 80

The Indicator show Daily Pivot Points. It is possible to specify the number of days to display. For forex it doesn't consider the sunday session data. It is possibile to modify the color, style and width for every level.It is better to use this indicator with timeframe not higher than Н1. 4 Levels of support and resistance with also Intermediate Levels that is possible to hide.
Pivot trading:
1.pp pivot
2. r1 r2 r3, s1 s2 s3
Pivot points have been a trading strategy for a long time, orig
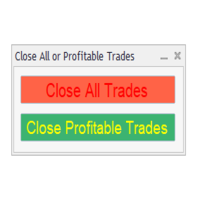
This EA creates two buttons in a panel that you can drag to any part of the chart (simply click on the panel and drag with the mouse to the part of the chart you want) with which you can close all the open operations in the account with a simple click, or close only the trades that are currently in profit. Check out my new trade dashboard assistant : Simple and Easy MT4 Trade Panel Tell me if you like the product and how it could be improved, Thanks :)
FREE

The " Fortune Long " bot works using pending orders and reacts to a channel breakdown with the direction of work in the channel; it is necessary to correctly calculate the levels of entry, stop loss, take profit, and the level of deviation of the pending order from the price. The bot needs to be optimized for 2 years with a forward period of 1/2. Once optimization is complete, select the best settings and save them. Work for 6 months. The bot automatically calculates all levels and the entry le
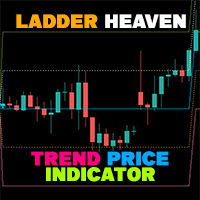
If you have difficulty determining the trend as well as entry points, stop loss points, and take profit points, "Ladder Heaven" will help you with that. The "Ladder Heaven" algorithm is operated on price depending on the parameters you input and will provide you with signals, trends, entry points, stop loss points, take profit points, support and resistance in the trend That direction.
Helps you easily identify trends, stop losses and take profits in your strategy!
MT5 Version: Click here
FREE
This utility will help you avoid losing money on your trades when your terminal loses connection to the broker or your VPS / computer goes into an update and doesn't open your MetaTrader client automatically after the update. How is this product different from the other disconnect alerts? This one will email you and/or an SMS even when your MetaTrader client gets disconnected from the Internet or doesn't respond! Your client is monitored externally and doesn't rely on its own Internet conn
FREE
Automated trading tools [Expert Advisor] using the Trend Following Strategy combined with vertical Griding entry points on the EURUSD currency pair. The trend following strategy is a simple but powerful strategy that has been widely adapted to create expert advisors for trading, espectially in Forex market. In this Expert Advisor [EA], Trend following strategies are combined with vertical grid entry methods to ensure that trades move in the right direction and close with a profit at the

The Angle Prices indicator is a tool that calculates the price angle based on price analysis, interpreting the time vector in the form of price points on the price chart. In other words, the X axis and Y axis are represented as price points, so you can actually calculate the angle with two axes of the same dimension. This allows traders to obtain information about the direction of price movement and possible entry or exit points for trades. Let's look at the main characteristics and interpr

This indicator identifies and displays zones, as it were areas of strength, where the price will unfold. The indicator can work on any chart, any instrument, at any timeframe. The indicator has two modes. The indicator is equipped with a control panel with buttons for convenience and split into two modes. Manual mode: To work with manual mode, you need to press the NEW button, a segment will appear. This segment is stretched over the movement and the LVL button is pressed. The level is displayed

The " Unforgettable Trend " indicator is a hybrid trend indicator that combines signals from elementary indicators with a special analysis algorithm. Its main task is to show the moments most favorable for entering the market, based on the current trend.
Main characteristics:
Algorithm and noise filtering: The indicator works as the main tool for determining the current trend in the market. Built-in intelligent algorithm allows you to filter out market noise and generate accurate input signal

RSI GridMaster – Advanced Grid Trading Expert Advisor Introducing the RSI GridMaster Expert Advisor, the result of extensive development and rigorous testing. This powerful trading system uses the RSI indicator to identify overbought and oversold zones, opening sell positions when the market is overbought and buy positions when it’s oversold — targeting consistent profits through a smart position averaging mechanism. With a broad range of customizable parameters, RSI GridMaster adapts to your pe

FOTSI is an indicator that analyzes the relative strength of currencies in major Forex pairs. It aims to anticipate corrections in currency pairs following strong trends by identifying potential entry signals through overbought and oversold target areas. Theoretical Logic of Construction: Calculation of Individual Currency Momentum: FOTSI starts by calculating the momentum for each currency pair that includes a specific currency, then aggregates by the currency of interest (EUR, USD, GBP, CHF,

Barry Hood's leading trend indicator is designed to more accurately determine the direction of the trend in financial markets. Here are the main characteristics and operating principles of this indicator:
Adaptive Four-Level Smoothing: The indicator uses a mechanism that allows it to effectively adapt to changing market conditions. This allows you to more accurately determine the current trend.
Characteristics and features: Redraws only on the zero candle: This means that the indicator is red

The EA is based, among other things, on EMA and SMA. And also a custom indicator.
The EA trades with the trend, and of course also trades corrections and breakouts.
It also has a hedge function built in.
There is also a news filter, with which you can avoid trading while news is being traded.
It also has equity monitoring that can be set as a percentage.
Trailing stop is also available as an option. Can be turned on or off.
You also have the option to choose different sessions, e.g. you ca

NEW VERSION! NB: IF YOU ARE USING A VERY HIGH RESOLUTION MACHINE AND THE EA DISPLAY LOOKS TOO SMALL, CONTACT ME SO I CAN HELP YOU. Open Multiple Trades on MT4 in 1 click at one price. Enter the Lot size Specify the number of trades you want to open Choose whether you want TP SL or Trailing Stop Once you are done, click Buy or Sell Open Multiple Pending Orders on MT4 in 1 click at one price. Enter the Lot size Specify the gap from the current price, where you want to place the pending order Spe
This indicator is based on the work of legendary trader William Gann, specifically using mathematical models and data from past days. It calculates potential time for a reversal based on selected parameters for the current day. The time is displayed in the future, at the opening of the day and does not change thereafter. The indicator also includes alerts when potential reversal time approaches. An algorithm for possible price movement is built into the indicator. When the time comes, an alert i

The trading indicator we've developed analyzes real-time price action to identify bullish or bearish trends in the financial market. Using advanced algorithms, the indicator automatically plots an upward line when it detects a bullish trend and a downward line in the case of a bearish trend. These lines provide traders with a quick and clear view of the potential direction of market movement, helping them make informed decisions in their trades. Each time a new candle forms on the chart, the ind

Description of work
The 'MA7 Ixora C1' expert advisor is based on the 'MA7 Ixora indicator. When a signal appears, the expert advisor opens a position, sets a stoploss and takeprofit, and after opening the position, accompanies it until it is closed. Detailed information about the 'MA7 Ixora' indicator.
Features of work
Designed to work on hedge accounts; Recovers your data in case of a sudden power outage; Stoploss and takeprofit are not installed on the server; the expert advisor itself close

SNOW EAGLE is ready to use, you don't have to change any parameters because it is already optimized in the best way.
Live Performance Click here .
Installation : Load on EURGBP chart ONLY . (if you are testing EA, you need to backtest on every single Symbols. This is an MT4 backtest limitation.) Currency pairs : EURGBP,EURCHF,AUDCAD,GBPCAD,NZDCAD. Timeframe: M15. Minimum account balance: 500$. Broker: The system is not affected by spread and slippage but it is preferable to use an ECN ac

Description of work The MA7 Aster indicator is based on the standard Moving Average indicator. Shows the price deviation from the moving average. Detailed information about the MA7 Aster indicator.
Indicator settings General settings: Period ; Method ; Apply to ; Minimum distance – minimum distance from the moving average to the closing price of the candle.
Message settings: Send message to the terminal (Alert) – permission to send messages to the terminal using the Alert function; Send messag

1. Going offline means that the market is in a wait-and-see state. In this situation, it is common to choose to wait and see rather than taking immediate action to wait for more market information or trend confirmation in order to make wiser decisions. 2.When there is a trend of going up and down, the market shows a bullish signal. At this point, investors may consider entering the market in hopes of future price increases and profits. 3.When the market situation is online, it will once again t

The well-known ZigZag indicator that draws rays based on the “significant movement” specified by the pips parameter. If a ray appears, it will not disappear (the indicator is not redrawn), only its extremum will be updated until the opposite ray appears. You also can display text labels on each rays describing the width of the ray in bars and the length of the ray in points.
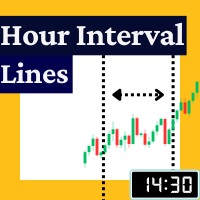
The Rayol Code Hour Interval Lines indicator was designed to assist your trading experience. It draws the range of hours chosen by the user directly on the chart, so that it enables traders to visualize price movements during their preferred trading hours, providing traders a more comprehensive view of price movements and market dynamics. This indicator allows the user to choose not only the Broker's time, but also the Local time. This way, the user no longer needs to calculate local time in re
FREE

StarBody è un indicatore istogramma che rappresenta la dimensione delle candele in relazione al loro volume ed evidenzia quelle più grandi delle precedenti. La formula per il calcolo dell'altezza dell'istogramma è semplice quanto efficace: Ampiezza * Volume La grafica indicherà tutte le candele più estese delle precedenti in base alle impostazioni scelte.
L'indicatore può essere utile, a volte indispensabile, nelle strategie che prevedono lo sfruttamento della continuazione del trend. Le strate
FREE

The UNIVERSAL DASHBOARD indicator will eliminate the need of using dozens of indicators on dozens of charts. From one place you can monitor all the pairs and all the timeframes for each of the following indicators: MACD STOCHASTIC WPR RSI CCI You can also use any Custom indicator in the dashboard as long as it has a readable buffer. With a single click you can quickly navigate between charts, pairs and timeframes. Alerts will provide clear indication about what happens for your favorite pairs on
FREE
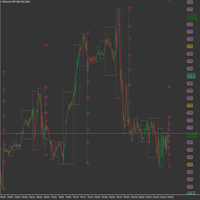
This product has been developed to complement various proven range expansion strategies, with features like the Fibonacci retracement and session/range definition along round numbers indicator. All coming together to provide a clear visual of areas which can potential present the trader with a position or even a quick scalping of price action. Download the demo and check it out for yourself!!!
FREE

Gold Trading EA is an expert advisor who uses a combination of trading strategies. Gold Trading EA is a proven short term scalping system with outstanding results over many thousands of trades. The EA focuses on short-term intraday trading and places pending orders at a possible break out levels. Also, one of the key priorities of this EA is to keep the account balance safe. This maximum accuracy backtests show a high payout rate and good resistance even in an unexpected market event. It ana

FTMO passing EA (High risk) is unique Expert Advisor that continues the iBoss series of advisors. Innovative methods of the programme's approach to trading, and promising performance results are possible thanks to the use of modern technologies and methods. The iBossTrade is a fully automated EA designed to trade currencies only. Working pairs US30. EURUSD, GBPUSD, EURGBP, USDCAD. XAUUSD. Expert showed stable results on currencies in 1999-2023 period. No dangerous methods of money management
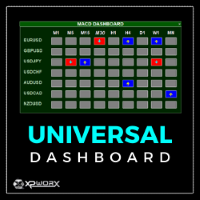
The UNIVERSAL DASHBOARD indicator will eliminate the need of using dozens of indicators on dozens of charts. From one place you can monitor all the pairs and all the timeframes for each of the following indicators: MACD STOCHASTIC WPR RSI CCI You can also use any Custom indicator in the dashboard as long as it has a readable buffer. With a single click you can quickly navigate between charts, pairs and timeframes. Alerts will provide clear indication about what happens for your favorite pairs on

RaysFX DrawProfit RaysFX DrawProfit è un indicatore MQL4 progettato per i trader che desiderano visualizzare in modo efficiente sul grafico tutti i risultati delle posizioni chiuse: profitto o perdita. Se imposti DrawProfit sul tuo grafico gestito da un Expert Advisor (EA), potrai vedere chiaramente le sue prestazioni attraverso i suoi profitti e perdite. Caratteristiche principali Visualizzazione del profitto : Mostra il profitto in valuta, pips o entrambi. Filtro magico : Filtra gli ordini in

YOU MUST OPTIMIZE FOR YOUR RISK The Martingale Mastermind EA is a built on the Martingale strategy, this Expert Advisor aims to capitalize on market fluctuations by strategically adjusting trade sizes during winning or losing streaks. Disclaimer: I do not provide files. By purchasing and using this Expert Advisor (EA), you acknowledge that you have thoroughly tested the EA on the strategy tester and understand the associated risks involved in automated trading. You further acknowledge that past

Indicator for determining the trend. The arrows and lines on the chart show the price reversal and the probable current trend or correction. You should always trade in the direction of the arrow. It is best to use the indicator on several time frames at once and enter the market when all time frames have the same arrow. For example, we open a sell trade if there is a red arrow on the M5, M30 and H4 timeframes. Or we open a buy deal if the indicator shows a blue arrow on all timeframes.
Advanta

BROWN EAGLE is ready to use, you don't have to change any parameters because it is already optimized in the best way.
Currency pair : NZDCAD . Timeframe: M15. Minimum account balance: 500$. Broker: It's preferable to use an ECN account. Type of System: Trend-Following. ----------Settings--------- Lot Sizing: Lot Sizing method ( Fixed Lot or Based on Balance ) . Fixed lot : Set manually the open lot size. Based on Balance (LotSize/Balance Step): Automatic balance lot sizing based on balance

The Ultimate Indicator For Trading Trend This indicator clearly shows you the strength of the market in one direction or the other, which means that you can trade knowing you are either with or against the market. When used in conjunction with the +3R principles you are sure to have some serious results. The +3R Principles Routine - This is when you trade and how often Rules - This is the rule you follow Risk:Reward - This is the percentage amount of your account which is at risk Whether you t
FREE

TrendCompass is a powerful indicator for trading in the currency and cryptocurrency markets on the MetaTrader 4 platform. This innovative tool is designed to simplify analysis and decision-making in trading. The indicator combines various technical indicators and algorithms to provide accurate and timely trading signals. Key Features:
Multilevel Strategy: TrendCompass is based on a comprehensive strategy that includes analyzing major trends, support and resistance levels, and various technical

EA Hero Duck is an Expert Advisor designed specifically for trading the Trend. The operation is based on opening orders using the M ACD indicator in addition to higher Trend. We will improve the system step by step. Addition to that the price will increase to 999$. In addition it uses a smart martingale system. Use 0.01 Lot / per 1.000 Units Use EUR/USD 5 Min Chart SETTINGS MACD Fast MACD Slow MA Slow MA Fast Trading Distance SL TP Trade Spacing Use Smartingale BreakEevenTrailAmount Show Com

ゴールドターゲットは最良のトレンド指標です。 このインジケーターの独自のアルゴリズムは、テクニカル分析と数学的分析の要素を考慮して資産価格の動きを分析し、最も収益性の高いエントリーポイントを決定し、矢印の形でシグナルと価格レベル(買いエントリー/売りエントリー)を発行します。 注文を開きます。 このインジケーターには、ストップロスの価格レベルとテイクプロフィットの 5 つの価格レベルもすぐに表示されます。
注意: このインジケーターは非常に使いやすいです。 ワンクリックでチャートにインジケーターをインストールし、そのシグナルと価格レベルに基づいて取引します。チャート上では、インジケーターが設置されている時間枠に関わらず、4つの時間枠(M30 H1 H4 D1)からトレンド状況が表示されます。
インジケーターの利点:
1. インジケーターは高精度の信号を生成します。 2. インジケーター信号は再描画されません。 価格が各ラインを超えた場合に音声通知(アラート&メッセージ)を搭載しています。 3. どのブローカーの MetaTrader 4 取引プラットフォームでも取引できます。
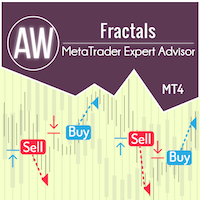
AW フラクタル EA は、AW フレキシブル フラクタル インジケーターからのシグナルに基づいて動作します。フラクタルはサポート レベルとレジスタンス レベルとして使用され、アドバイザーはレベルの内訳に取り組みます。市場に参入すると、アドバイザーは市場と未決注文を自動的にオープンし、ポジションを終了するときは、インテリジェントなトレーリング システムを使用して未決注文との平均化を行います。 Advisor には、リスク管理の自動計算、柔軟な設定、および多くの作業シナリオのための機能が組み込まれています。 問題解決 -> こちら / Version МТ5 -> HERE 利点: 柔軟な自動取引システム、 調整可能なトレーリングシステムを内蔵 アドバイザ内のカスタマイズ可能なインジケーター、 入力変数を直感的に簡単に設定でき、 未決注文を平均化するための組み込みシステム、 接続可能なリスク管理自動計算システム。 注記!アドバイザにはインジケーターマークは表示されません。 戦略の説明: フラクタルは、中心に頂点を持つくさびの形をした幾何学的図形を形成するキャンドルの組
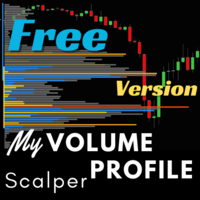
MyVolume Profile Scalper EA の無料版 https://www.mql5.com/en/market/product/113661
推奨通貨ペア:
ETHUSD
ゴールド/XAUUSD
AUDCAD
AUDCHF
豪ドル円
オーストラリアドル
オーストラリアドルUSD
CADCHF
カナダ円
スイスフラン円
ユーロウド
ユーロカナダドル
ユーロフラン
EURGBP
ユーロ円
ユーロ円
ユーロドル
GBPAUD
GBPCAD
GBPCHF
ポンド円
GBPNZD
ポンドドル
ニュージーランドドルCAD
NZDCHF
ニュージーランドドル
ニュージーランドドルUSD
USDCAD
USDCHF
米ドル円
ETHUSD
BTCUSD
US30 現金
タイムフレーム: すべてのタイムフレームで動作します
-------------------------------------------------- --------------------------------------
-
FREE

カスタムMT4インジケーターで外国為替取引を成功させるための秘密を発見してください!
Strategy with RangeBars https://youtu.be/jBaDCAPTtHc
外国為替市場で成功を達成し、リスクを最小限に抑えながら一貫して利益を得る方法を疑問に思ったことはありますか? これがあなたが探している答えです! 取引へのアプローチに革命をもたらす独自のMT4インジケーターを導入できるようにします。
ユニークな汎用性
私たちのインジケータは、RenkoとRangeBarのろうそくのフォーメーションを好むユーザー向けに特別に設計されています。 これらのチャートタイプは多くの経験豊富なトレーダーに好まれていることを理解しています。そのため、私たちのインジケーターはそれらとシームレスに統合され、比類のない市場分析を提供します。
クリアトレンドシグナル
複雑な分析を忘れてください! 私たちのインジケーターは、鮮やかな色と明確なドット構造を利用して、市場の動向を明確に示しています。 赤と青の点は、価格の動きの方向性について疑いの余地がなく、取引の迅速な意思決定を可能に

Rule Plotterインジケーターで作成した戦略をRule Plotterエキスパートで取引する Rule Plotterインジケーターを使用してカスタム戦略を作成し、チャート上のエントリーポイントや出口ポイントを示す矢印を視覚化したら、これらの戦略を金融市場で活かす時が来ました。Rule Plotterエキスパートを使用すると、これらの矢印に基づいて自律的かつ正確に取引することができ、戦略のポテンシャルを最大限に活かすことができます。 矢印をアクションに変換する Rule Plotterインジケーターによって生成された矢印は、取引戦略によって定義された重要なエントリーポイントおよび出口ポイントを表します。Rule Plotterエキスパートを使用すると、これらの矢印が解釈され、金融市場で実行されるアクションに変換され、取引戦略で特定された取引機会を利用することができます。 Rule Plotterエキスパートで取引を開始し、戦略を収益性のあるアクションに変換しましょう! 自動化された効率的な実行 Rule Plotterエキスパートによって矢印が検出されると、それに対応するアクシ

Night Swimmer は強力なナイト スキャルピング EA です。
ボラティリティの低い市況向けに設計された高度なスキャルピング システムである Night Swimmer EA を使用して、夜間取引を体験してください。 この EA は慎重に使用し、許容できる金額のみリスクを負うことが重要です。 実際のティック モデリングを使用して EA をバックテストし、設定を試して、最適な設定を見つけることをお勧めします。
この EA は無料です。 したがって、EA が気に入った場合は、5 つ星の評価を残すことを検討してください。
推奨されるシンボル: EURUSD、GBPUSD、EURCHF、USDCHF 推奨時間枠: M5 (5 分チャート)
特徴: 夜間取引に最適化: 当社の EA は、価格変動がより予測可能で変動が少ない傾向がある夜間市場の独特の特性を活用するように特別に調整されています。 平均回帰戦略: EA は、価格が平均値に回帰する傾向を利用し、短期的な価格変動を捉えて一貫した利益をもたらします。 スマートな機能: 当社の EA には、パフォーマンスの低い取引をインテ
FREE

アジアンプロアイ | Expert Advisor Unlimited (MT4)
- 15 分足 (M15) チャートで 3 つの外国為替ペア (AUDCAD、GBPCAD、GBPUSD) を取引します - エキスパートアドバイザー (EX4) - SETファイル - 無制限のサポート - 最小口座サイズ 200 (EUR/USD/X) - 最小レバレッジ 1:30
!! マーチンゲール法、グリッド法、平均法などの危険な取引管理方法は使用しません。 セットアップごとに 1 つの取引のみを行い、最大リスクを固定した純粋なプライスアクション取引のみ!!
ASIAN-PRO EA はおそらく私たちの最大の秘密です。 この EA の開発は 2017 年に開始され、2019 年末に第 1 世代が完成しました。
その後 3 年間にわたり、私たちはこれまで見てきたすべての市場 (2008 年の金融危機、2020 年の新型コロナウイルスとその後の市場など) を文字通り取引できるように追加の反復を加えて EA を最適化しました。
バージョン V1.2 は 1 年以上にわたってライブ取引が

SkalpAUDNZD is a highly accurate and reliable advisor for trading the AUDNZD currency pair( time frame М5) . The advisor does not have dangerous technologies such as martingay, grids and averaging and is therefore safe for a trading account. Orders are closed using a signal or take profit and stop loss; the advisor forcibly closes orders on the opening day. The advisor opens only one order at a time and all orders are protected by a fixed Stop Loss. The advisor is easy to use, as it has fe
FREE
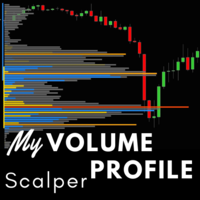
購入する前に、デモアカウントMyVolume Profile FV (無料版) を使用してフォワードテストによるテストを数か月間 行ってください。 それを学び、自分に合った最適なセットアップを見つけてください。 MyVolume Profile Scalper EA は、ボリューム プロファイルを使用するように設計された高度な自動プログラムです。 ボリューム プロファイルは、 指定 された期間中に特定の価格レベルで取引された総量を取得し、その総量を上昇量 (価格を上昇させた取引) のいずれかに分割します。 )またはダウンボリューム(価格を下げる取引)を行い、オープンまたは デア を行います。 このEAのコアエンジンは、インジケーターボリューム、平均足、ADXを使用しています。 カスタマイズ可能な移動平均を使用した追加フィルターにより、移動平均インジケーターによって与えられる傾向を確認し、追跡します。 このフィルタはオプションであり、デフォルトでは TRUE です (このフィルタを使用します)。 MyVolume Profile Scalper EA は、 すべての時間フレーム
Moving Average Reversal and Pullback Range Breakout MT4 EA
What this EA does: This EA place pending BUY STOP and SELL STOP order trailing moving average by distance pts.
It waits for price to make a reversal trend or hit moving average and make a pullback.
Pending order stop trail the moving average until executed.
For scalping, change the moving average to shorter period.
Please change the Close and Delete orders before and after trade parameter to true. Features or Setting:
Parameters must b
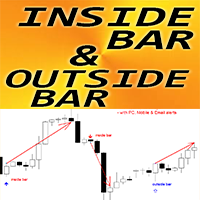
Crypto_Forex インジケーター「インサイドバーとアウトサイドバーパターン」MT4用。
- インジケータ「インサイドバーとアウトサイドバーパターン」は、プライスアクション取引に非常に強力です。再描画なし、遅延なし。 - インジケータは、チャート上のインサイドバーとアウトサイドバーパターンを検出します。 - 強気パターン - チャート上の青い矢印信号(画像を参照)。 - 弱気パターン - チャート上の赤い矢印信号(画像を参照)。 - インサイドバー自体の R/R 比率(報酬/リスク)が高い。 - PC、モバイル、および電子メールアラート付き。 - インジケータ「インサイドバーとアウトサイドバーパターン」は、サポート/レジスタンスレベルと組み合わせるのに最適です。
高品質のトレーディングロボットとインジケーターをご覧になるにはここをクリックしてください! これは、この MQL5 ウェブサイトでのみ提供されるオリジナル製品です。

Renko Starは、練行チャートを取引するように設計されたMT4矢印タイプのインジケーターです。このインジケーターには、勝率や獲得ポイントなどの役立つ情報をトレーダーに伝えるバックテストダッシュボードがあり、ATR x乗算のtpとslも提供されます。バーオープンまたはイントラバーのシグナルであり、シグナルが与えられた正確な価格を示す黄色のマークが付いています。このインジケーターの使用方法は、インジケーターが示す矢印に従って買いまたは売りを開始し、tpを設定することです。インジケーターによって与えられる sl や sl も、インジケーターの設定をいじってみると結果が良くなったり最悪になったりするため、信頼できるダッシュボードで良い結果が得られるまでインジケーター設定を変更する必要があります。
このインジケーターは再ペイントまたはバックペイントを行いません
パラメーター : atr tp : atrに基づくtp値 atr sl : atrに基づくsl値 atr期間 星期 スターフィルター History : バックテストする履歴の量 スプレッド : 計算にスプレッドを使用したバッ

このインディケータは、チャートのビジュアルを向上させるだけでなく、チャートに躍動感やダイナミックさを与えます。このインジケータは、1つまたは複数の移動平均(MA)インジケータを組み合わ せたもので、常に色が変化し、カラフルで興味深い外観を作り出します。
この製品はグラフィカルなソリューションであるため、テキストでその機能を説明することは困難です。 このインジケーターは、ビデオ編集用にチャートの美しい画像を作成したいブロガーや、チャートを生き生きとカラフルにしたいトレーダーに適しています。
MAラインのカラーパレットは、虹のように変化したり、ランダムに変化したりします(設定したパラメータによる)。MAインジケータは、「MA期間」パラメータのステップを維持することで、独立に並び、美しい画像を作成します。
また、このインジケーターにはMA期間を常に変更する機能があり、チャートに活気とダイナミズムの効果を作り出すことができます。
ご清聴ありがとうございました。 ご清聴ありがとうございました。
FREE
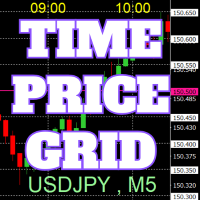
チャート上に、キリの良い数値で価格のグリッド、時刻のグリッドを描画します。
「パラメータの入力」から、各ピリオドごとに、価格の間隔設定が可能。 キリ番(ラウンドナンバー)のグリッドは、ほかの線より太く、目立つのでわかりやすいです。 キリ番(ラウンドナンバー)のグリッドは、ほかの線と異なる色に設定できます。
各所の色は、個別に設定できます。 シンボル、時間足を表示でき、場所も任意に設定できます。 時刻の表示は、上下どちらにするか設定できます。 表示する時刻は、サーバー時刻、ローカル(PCの時刻)、ユーザー設定(サーバーとの時刻差を任意で設定)から選べます。 無料でお使いになれます。 皆さんのトレードのお役に立てれば幸いです。
FREE

This indicator continuously, smoothly changes the color of candlestick edges and bodies, as well as the color of volumes in real time like a lamp. The indicator is easy to use. The palette of colors is diverse. This product is a graphical solution, so it is difficult to describe what it does by text, it is easier to see by downloading it, besides the product is free. The indicator is suitable for bloggers who want to create a beautiful picture of a chart for video editing or traders who want to
FREE

「Scalper M5 システム」は、外国為替市場におけるスキャルピング戦略のために設計された強力なツールです。 最大 95% の精度を持つこのインジケーターは、再ペイントせずに取引を開始するための信頼できるシグナルを提供します。 シンプルかつ効果的なアプローチを採用して短期取引の機会を特定し、あらゆるレベルのトレーダーに適しています。 この指標のアルゴリズムは、価格の勢い、ボラティリティ、市場トレンドなどのさまざまな要因を考慮して、誤ったシグナルを除去し、確率の高い取引設定を提供します。
主な特徴: 非再描画シグナル: Scalper Pro インジケーターの際立った機能の 1 つは、再描画しないシグナルを提供する機能です。 これは、シグナルがチャートに一度表示されると変化しないことを意味し、トレーダーが取引の決定に自信を持てるようになります。 高精度: 最大 95% の精度率を備えた Scalper Pro インジケーターは、トレーダーに高い成功確率を提供します。 高度なアルゴリズムとテクニカル分析技術を利用することで、取引の正確なエントリーポイントを特定し、利益の可能性を最大
News Catcher Range Breakout MT4 EA "Trade on news and capture sudden price movement"
What this EA does:
This EA will help you trade on News.
User input the news hour and time or read the next news date and time from a text file.
The text file should be in MQL4\Files folder for live trading.
and in tester\files folder for back test.
Specify trading window time, start minutes before and end minutes after news.
User can also trade after the news to avoid risk of slippage
and capture price revers

Trend Martingale for MT4 is a fully automated advisor that trades based on the Martingale strategy (which involves increasing bets until a win is achieved). The strategy can be applied to any currency pair and performs well in clearly defined trends.
Input parameters :
mn : Unique magic number for orders.
MaxSpread : Maximum allowable spread for entering a trade.
tp : Take-profit level in points.
sl : Stop-loss level in points.
StartInvestment : Initial investment.
LostMultiplier : Multiplier

Turbo Trend technical analysis indicator, which determines the direction and strength of the trend, and also signals a trend change. The indicator shows potential market reversal points. The indicator's intelligent algorithm accurately determines the trend. Uses only one parameter for settings. The indicator is built for simple and effective visual trend detection with an additional smoothing filter. The indicator does not redraw and does not lag. Take profit is 9-10 times larger than stop loss

Limited time offer! For the launch of NextBot Scalper EA , the price of this indicator will drop to FREE !
Introducing a pragmatic and innovative tool for MetaTrader 4 (MT4) traders: the Linear Regression Next channel indicator, enhanced with the determination coefficient R 2 . This indicator serves as a foundational tool for traders seeking to understand market trends through the lens of statistical analysis, specifically linear regression.
The essence of this indicator lies in its ability t
FREE

Volume Horizon is a horizontal volume indicator that allows you to observe the density of market participants' volumes across various price and time intervals. Volume histograms can be constructed based on ascending or descending market waves, as well as individual bars. This tool enables more precise determination of entry or exit points, relying on levels of maximum volumes or volume-weighted average prices (VWAP).
What makes Volume Horizon unique? 1. Segmentation into ascending and descendi
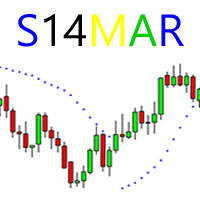
附上20240307市況, 順勢加單真開心 附上20240306市況, 順勢加單真開心 ※ ※ ※ This configuration is extremely aggressive and extremely risky. Please conduct your own backtesting and adjust it to a suitable risk level. ※ ※ ※
Additionally, please share the configuration and EA modification requirements with me. ※ ※ ※ ※
This EA trades based on the multi-time frame Parabolic SAR indicator. E.G. if there still a buy signal on the M15 timeframe SAR, In the M1 timeframe, the EA will execute a buy trade when M1 SAR buy signal.
The Xeon indicator was created to display the trend in a visual form. One of the main definitions for monitoring the currency market is trend. A trend is a stable direction of price movement. To find it, the indicator uses calculations designed to smooth out sharp fluctuations that do not affect the overall picture of price movement.
The indicator was created for those who value their time and money.
A trend can be increasing (bullish trend) or decreasing (bearish trend). In most cases, a tre

Trends are like the "Saint Graal of traders": it can give you an higher win rate, a better risk to reward ration, an easier position management and so on...
But it is really hard to determine the trend with accuracy, avoiding fase signals, and with the right timing, in order to take massive movements. That's why I created the Trend Validator: a new and EASY tool that will make identifying trend and build new strategy a really easier work.
ANATOMY OF THE SOFTWARE
The indicator is composed by 3
FREE
Candle Range Breakout and Reversal MT4 EA by SK What this EA does:
It find the high-low or open-close from the previous candle trade using that range. For scalping, user can use shorter candle timeframe.
Everytime there is a new candle, the range is updated to the previous candle.
This process is repeated until trading window ended.
If the candle size is big, there might be only small momentum left for breakout . That's why reversal strategy should be implemented.
If the range size is bigger

Description: The forex risk management script is designed to assist traders in effectively managing the risk associated with their trades and maximizing profit potential. This script can be used on a trading platform to automate and simplify the risk management process. Features: Risk Configuration: Allows the user to set the percentage of capital they are willing to risk on a trade. Position Size Calculation: Automatically calculates the position size based on the specified risk percentage and

Close all open orders, delete all pending orders, and clear the entire account's orders. Please use caution! After clicking the button, the account order will be 0! Help us quickly clear account orders! As it is a free version, only the function of closing all orders is available. If other functions are needed, customization is required! The paid version has more features!
FREE

Graphic Shapes -using history, it projects four types of graphical shapes at the moment, allowing you to determine the main ranges of price movement in the future, as well as gives an understanding of the main market reversals, while giving entry points by priority!The panel contains three types of figure sizes expressed by timeframes. They allow you to conduct a complete market analysis without using additional tools! The indicator is a powerful tool for forecasting price movements in the forex
FREE

AUD,CAD,NZDによる平均回帰EA Trading Camp MT4 Trading Campは平均回帰傾向の強い3通貨(AUD,CAD,NZD)に着目し、逆張り戦略を行うEAです。トレード手法としてグリッドを用いますが、両建てによるセキュリティ機能を搭載しており、ストップアウトになりにくい設計にしてあります。各種フィルターも充実しており、厳選したエントリーを行います(そのため、エントリー頻度は高くありません)。また、入力パラメーターも各種取り揃えているため、お好みによりEAの動作を変更して運用することが可能です。 Trading Campはあなたの旅を存分にサポートいたします! 平均回帰とグリッドによる勝率の高い戦略 両建てによるセキュリティ機能を搭載 各種フィルタリングによる厳選したエントリー 1つのチャートに設定するだけで複数銘柄の取引が行える簡単セットアップ
充実した入力パラメーターによる幅広い運用 インフォメーションパネルによる運用状況の表示 経済カレンダーはこちら : 2010-2019 , 2020-2025 MT5版はこちら : Trading Camp MT5
Time Range Breakout and Reversal MT4 EA by SK
What this EA does:
It find the high and low from a specified range period of time and trade using that range. The EA trade on that range breakout. But If the range size is bigger than max range size specified by user,
user can add distance pts to activate Reversal Trade Strategy.
If the range size is big and price swing inside the range,
reversal trade can capitalize on that.
It has the option to trade as soon as the time range ended or wait until

The Trend Prior indicator ignores sharp fluctuations and market noise and tracks market trends. Suitable for trading on small and large time frames, it ignores sudden price jumps or corrections in price movements by reducing market noise around the average price value. The indicator works on all timeframes and currency pairs. The indicator gives fairly accurate signals and is commonly used in both trend and flat markets. It is advisable to use the indicator in conjunction with other tools for m

It works in a digital way with the number of points of market movement and some indicators that work to confirm the trend After entering into the BUY OR SELL transaction The expert opens a pending transaction of type BUYSTOP or SELLSTOP Control the distance from Step The expert is chasing profit from TrailingStop The expert has a profit of $ win_USD All if you do not want to work with it, set it = 0 Work on the 5 M timing The expert works to close the losing trades from the last profitable tra

Note: This strategy is a pure Martin strategy and must be manually combined. It must not be fully automated, otherwise it will eventually result in losses. This strategy is only used by newcomers to simulate and familiarize themselves with EA operations and learning. It is best not to use real trading accounts. If you use real trading losses, you will not be responsible for any losses
Like you when I first started trading, It was overwhelming...learning about indicators, about lotsize, leverage and many more things. Its been almost 3 years. I am more knowledgeable in trading. My trading continues to improve as I work on my strategy, technical analysis, trading psychology and trade management. One thing I am not worried about though is being able to close my trades quicky if a trade goes against me or if the trade has reached my take profit level with the help of my Close Tra
MetaTraderマーケットは、履歴データを使ったテストと最適化のための無料のデモ自動売買ロボットをダウンロードできる唯一のストアです。
アプリ概要と他のカスタマーからのレビューをご覧になり、ターミナルにダウンロードし、購入する前に自動売買ロボットをテストしてください。完全に無料でアプリをテストできるのはMetaTraderマーケットだけです。
取引の機会を逃しています。
- 無料取引アプリ
- 8千を超えるシグナルをコピー
- 金融ニュースで金融マーケットを探索
新規登録
ログイン