YouTubeにあるマーケットチュートリアルビデオをご覧ください
ロボットや指標を購入する
仮想ホスティングで
EAを実行
EAを実行
ロボットや指標を購入前にテストする
マーケットで収入を得る
販売のためにプロダクトをプレゼンテーションする方法
MetaTrader 4のための新しいエキスパートアドバイザーとインディケータ - 227
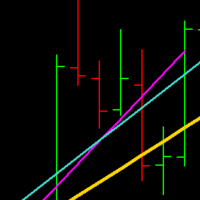
TrueRegression will calculate the linear regression of a given sequence of bars, and display the line of best fit on the chart. Regression is used to determine whether a market is currently trending, and whether sub-trends are occurring, which can hint at a potential breakout situation. The indicator will recalculate every 'n' bars (defined by the user input). When the indicator re-draws, it will keep the original lines on the chart, unmodified, so they can be referenced by a custom EA, or by th

Advanced Currency Strength Indicator
The Advanced Divergence Currency Strength Indicator. Not only it breaks down all 28 forex currency pairs and calculates the strength of individual currencies across all timeframes , but, You'll be analyzing the WHOLE forex market in 1 window (In just 1 minute) . This indicator is very powerful because it reveals the true movements of the market. It is highly recommended to analyze charts knowing the performance of individual currencies or the countries ec

This cost averaging Expert advisor (EA) places additional trades in the same direction as the original (manually opened) order when the price goes against you. It can be used as a grid system or as pure martingale system (exponential increasing of lot size) or smoothed martingale (for instance linear increasing of the lot size). Due to the risk involved, this EA is more suitable for intermediate to advanced traders who are well aware of how to handle risk management and trading an already profit

Notify To Telegram MT4 Expert Advisor will send notifications via Telegram when orders are opened/modified/closed on your MetaTrader 4 account. Send message to person, channel or group chat. Easy to customize message. Support custom message for all languages. Support full Emoji.
Parameters: Telegram Bot Token - create bot on Telegram and get token. Telegram Chat ID - input your Telegram user ID, group / channel ID Magic number filter - default all, or input magic number to notify with co

This indicator displays the histogram and arrows on chart. When Simple The Best Pro are placed on a chart, they identify the trend. The color of may be blue or red. The blue color stands for upside moves and the red color stands for downside trends. The indicator offers to set Stop Loss (SL) and Take Profit (TP) setting. The default value is ATR. Indicator has automatic optimization. The STB is a unique indicator that shows the tendency (button Bars) of a particular signals. The STB tells us

Principles of construction of the indicator. The Absolute Bands (AB) indicator is reminiscent of the Bollinger Bands indicator with its appearance and functions, but only more effective for trading due to the significantly smaller number of false signals issued to them. This effectiveness of the Absolute Bands indicator is due to its robust nature. In the Bollinger Bands indicator, on both sides of the moving average - Ma, there are lines spaced from Ma by the standa
FREE
This indicator helps you control several pairs in a small workspace, therefore, it is not necessary to open several charts on the platform to do so. The indicator shows sequentially up to 6 different pairs, besides that each of these pairs has a button with which you can stop the indicator to observe the selected pair. Place the indicator on a chart to monitor several pairs and the rest of your space use it on the chart of the pair you wish to observe in detail. MT5 version Parameter

This indicator will allow you to evaluate single currency linear regression.
WHAT IS LINEAR REGRESSION?(PIC.3) Linear regression is an attempt to model a straight-line equation between two variables considering a set of data values. The aim of the model is to find the best fit that can serve the two unknown values without putting the other at a disadvantage. In this case, the two variables are price and time, the two most basic factors in the Forex market. Linear regression works in such a wa
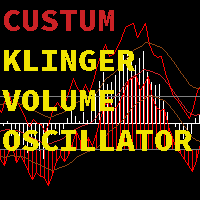
Or (KVO) determines the long-term trend of money flow while remaining sensitive enough to detect short-term fluctuations.It u ses the key price compared to the prior bar's key price to assign volume as positive or negative value. Volume is a measure of how many units of a pair are trading per unit of time.You can choose between a KVO line, histogram, or both combined with this Klinger Volme Oscillator.The Klinger Volume Oscillator is a trend reversal indicator. It relies on the concept of a vol
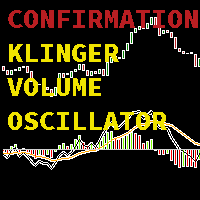
Or (KVO) determines the long-term trend of money flow while remaining sensitive enough to confirm short-term reversals.It u ses the key price, and increasing and decreasing bars compared to the prior bar's key price and increasing and decreasing bars to assign volume and the trend as positive or negative values. Volume is a measure of how many units of a pair are trading per unit of time, while the increasing and decreasing bars are a measure strength of the trend the trend .The Klinger Volume O

Currency Dashboard Trader is a multi-currency trading system. It uses two sets of indicators across multiple time frames. Each set can be evaluated for trend following or reversal. The system calculates strength/weakness of currency pairs , and generates a list of pairs eligible for trading. The system also incorporates a trade manager that supports currency basket management.
Trading Modes:
Manual Mode: Dashboard in manual mode is used as an indicator for trade signals. Clicking a pair fro

Trade easily from the chart with CAP Trade Pad EA . It handles risk management for you and can perform several useful tasks with your existing trades. Trade easily from the chart Trade with precise risk management hassle free Set your desired stop loss and take profit levels Close all existing trades with a single click Delete all pending orders with a single click Reap partial profits with a single click It has no input parameters
How to Use Please Read this blog - Details Information in
FREE

Update: For those who want to manually backtest this indicator, check this tool https://www.mql5.com/en/market/product/59248
The indicator will help make your calculation of stop loss easier as it will be visually aiding you in choosing where to put your stoploss level on the chart by calculating the current value of ATR indicator. For those who are unfamiliar with ATR, it is a useful indicator to calculate stoploss for trend following strategy. If volatility is high, ATR stoploss level will b
FREE

The purpose of this utility is to manage one or more subwindow in the same chart by opening and closing them through a button or the keyboard keys
How it works: If you want to handle more than one subwindow you need to reinstall the indicator . In this case some setups has to be customized onlu in the last subwindow installed and others setups in the installed subwindow during the first time installation. They are denoted in the input rispectively as ' LW ' and ' IW '.
First of all insta

This EA combines two built-in combined indicators (Bollinger Bands breakout and EMA Cross) to check the trends before performing any trading action. It is provided with: trailing Stop Loss; bad time to trade filter for each day of the week; define in minutes the profitable orders duration; define in currency values the profit to be taken; enable and disable martingale mode; define the maximum spread value to trade; define the minimum equity percentage to allow trading; the input values are alre

Almas Wall Street is a professional arrow indicator with no repainting. Signals appear simultaneously with the formation of a candle. Trading Guidelines: Enter a trade for at least 2 candles or on the next candle after the signal for 1 candle. Screenshot 5 . A red arrow pointing down suggests considering sales, while a blue arrow suggests buying. All you need to configure are the colors of the signal arrows. It is recommended to apply this indicator in scalping on timeframes M1-M5. Signals occur

Brilliant Wall Street is a professional arrow indicator. It is based on a mathematical calculation. thanks to a special calculation algorithm that was developed by the best specialists
he is not late, moreover, he gives advanced signals.
-----------almost complete absence of redrawing------------. signals appear with the advent of the candle.
It is recommended to enter a trade for at least 1-2 candles on the next candle, but you can also use a signal...
The red down arrow indicates

This is a dial indicator for trading from the level of support resistance
--- complete lack of redrawing ---
He is able to determine the levels of support resistance
Finds the best entry points and shows them with arrows.
If a trend is forming, the indicator will always notify with a arrow signal.
buy signal blue arrow for sale red arrow
This signaling tool can also be used on a sideways market. The main thing is that it is volatile.!!!!!!
The percentage of correct indicator pre
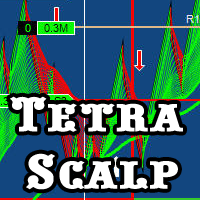
TetraScalp is an automated trading system using a smart scalping strategy. The basis of the system is fixing the fact of price consolidation in certain price channels with the definition of false punctures and straight-line trend movement.
The complex mathematical algorithm of the adviser allows you to work completely autonomously without additional manipulations. ECN-performance and VPS recommended.
Recommended use: EURUSD 15m, GBPUSD 15m, USDCAD 15m. Settings:
Comment to order - comments
This is an automated Expert Advisor . EA uses advanced algorithms to find entry points and several additional filters to enter and exit the market. EA does not require optimization or any other configuration. parameter MagicNumber - EA ID to avoid interference with other EAs. Lots - Fixed single lottery UseMoneyManagement - Automatic order number MaxRisk - Risk as a percentage of the account's available margin MaxLotsPerOrder -MaxLotsPerOrder TakeProfit - Maximum Take Profit Points StopLoss - t
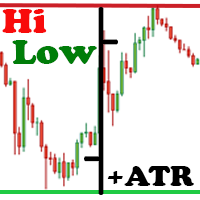
The Hi Low Last Day ( Hi Lo Last Day ) indicator shows the high and low of the last trading day and the second trading day. There are many trading strategies on the daily levels. This indicator is indispensable when using such trading strategies. In fact, everything is simple in trading, you just need to understand and accept it for yourself. There is only price!!! What is price? This is the level on the chart. The level is the price that the buyer and the seller are holding back. What price i
It's a two (2) pairs correlation system to use 3 currencies to make 2 pairs to open hedge orders on those.
The expert starts opening four orders for each couple (2 plus and 2 minus) and wait to move prices in one direction to make a grid of orders.
The expert can use a maximum of 5 currencies to make 10 pairs and make 30 couples.
It is important the order of currencies is from the strongest to the weakest.
Strongest... EUR/GBP/AUD/NZD/USD/CAD/CHF/JPY ...weakest.
Canto inputs minimum o
FREE

§ Lot - is initial lot of trade. § Koef - coefficient of multiplication of lot. § Dig-2 - average figure to the 100-th lot shares, "1" - average figure to the tenth lot shares, "2" - in the 100-th shares of the warrant. § Maxlot - is the maximum lot of volume in a series. § Stoploss - is the number of points from the warrant. § Lz is - the volume of the warrant at which a series is closed in without a loss. § Takeprofit - is the number of points from the warrant. § Pips - i
Highly configurable OBV indicator.
Features: Highly customizable alert functions (at levels, crosses, direction changes via email, push, sound, popup) Multi timeframe ability Color customization (at levels, crosses, direction changes) Linear interpolation and histogram mode options Works on strategy tester in multi timeframe mode (at weekend without ticks also) Adjustable Levels Parameters:
OBV Timeframe: You can set the lower/higher timeframes for OBV. OBV Bar Shift: Y ou can set the offs
FREE
* Based on this product "BRiCK Convert4To5 MT5 Free" was created. "Convert4To5" is a Script that converts MQL4 source files into MQL5 source files.
Experts, Indicators, Scripts, and Libraries with extension ".mq4" will be available for MT5.
Parameter
None.
Procedure
1. Open the following folder.
terminal_data_folder\MQL4\Files\ (in the terminal menu select to view "File" - "Open the data directory") 2. Confirm that the BRiCK_Convert4To5 folder exists.
If it does not exist,
FREE

This indicator helps you to comfirm SMAs' crossovers by draw a signal line that determines SMA movement direction. when Short SMA cross above Long SMA and Close price is above the signal several bars later, then uptrend is expected. when Short SMA cross below Long SMA and Close price is below the signal several bars later, then downtrend is expected.
Input Description :
MA_Period_short: Short-term SMA's period. Used for short-term PriceX. Must be higher than 1. MA_Period_long: Long-term SMA'
FREE

The Blue Lion Expert Advisor
(Very Fast, Easy Setup, Power!) The Blue Lion is a Trading Robot use an intelligent Scalping and martingale Technique to Minimize DrowDown. Schedule scalping Options. it uses some Indicators as a filter to maximize Correct entries.
Recommendations : initial Lot = 0.01. Risk_PerCent : 20%. Balance = 100 USD. Pair = EURUSD. TimeFrame = 5Min. Broker = Trusted Brokers
Inputs descriptions : Initial Lot - Initial lot size. Hedge - (Optional : enable/disabl

Introduction Professional traders use pivot points as support/resistance levels or as an indicator of a trend. Basically, a pivot point are areas at which the direction of price movement can possibly change. What makes pivot points so popular is their objectivity as they are recalculated each time the price moves further. The pivot points indicator implements 5 popular pivot points calculation and drawing: Standard – The most basic and popular type of the pivots, each point serve as an indica
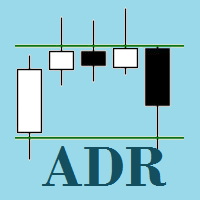
Average Daily Range (ADR) SR is an indicator which shows how far a currency pair can move in a day. It can be used to find hidden support and resistance levels (SR), estimate effective profit and stop loss targets, and provide short term trade signals from the hidden SR levels. Features
Automatically plots on the chat, the top and bottom of the ADR value (i.e. a horizontal channel) which acts as Support and Resistance Levels Automatically calculates the percentage of the ADR reached by the curr

This indicator will generate signal from other indicators like RSI, MA, Force Index etc into one confluent signal.
Which indicators to be used is up to the users to decide. You can add a simple MA, OsMa, RVI and ADX to see how these indicators will work out when combined together, an arrow will be drawn onto your chart where confluence happens.
And if that combination doesn't seem so good, then tweak the setting a little bit or remove it completely or add another different indicator, as you

Общие сведения Для начала торговли достаточно небольшого депозита. Подходит для мульти-валютной торговли. Мониторинг моих счетов: https://www.mql5.com/ru/signals/author/mizrael
Принцип работы Эксперт открывает ордера по встроенному индикатору. Каждый тик эксперт определяет ордер с самой отрицательной прибылью. Далее эксперт определяет суммарную прибыль ордеров на Buy и Sell по каждой валютной паре. Если общая прибыль ордеров на Buy или на Sell по каждой валютной паре плюс сумма ордера с самой

Psychological or Round Levels indicator automatically draws lines or zones at the psychological levels (00 or 50) as the market moves. New lines are drawn as the market moves while the old lines are deleted. This ensures that your chart is clutter-free. The user specifies the number of lines preferred on the chat, and the indicator keeps the number of lines constant. The indicator plots two types of levels, the Main Level (00 levels e.g. USDCAD 1.33000, 1.34000) and the Sub Level (50 levels -

The indicator signals about "Impulse near!" or "Reversal point near!" The arrow-signal does not disappear and does not redraw after a bar closes. On next bar you may to open orders: buy stop && sell stop. Working timeframe: D1, H4, H1, M30, M15. The indicator parameters Momentum soon Period1 18 Calculation period 1 Period2 37 Calculation pe

KT COG is an advanced implementation of the center of gravity indicator presented by John F. Ehlers in the May 2002 edition of Technical Analysis of Stocks & Commodities magazine. It's a leading indicator which can be used to identify the potential reversal points with the minimum lag. The COG oscillator catches the price swings quite effectively.
MT5 version of the same indicator is available here KT COG Advanced MT5
Calculation of COG The COG indicator is consist of the two lines. The mai

Demarker levels cross Alert is a modified version of the classic Demarker indicator, with email and mobile alert when demarker cross High or Low levels, default levels setting are: low=0.1 and High=0.9 and Demarker of periode=10, you can modify all these entries to find the best setting for every Pair or Stock. Basically these Alerts are reversal Alerts, you will get: 1-Buy alert when Demarker cross above Low level. 2-Sell alert when Demarker cross below High level. -----------------------------

SPEEDY TIGER https://www.mql5.com/en/users/earobotkk/seller#products Speedy Tiger is a fully automated EA that uses our innovative algorithm combined with our money management concept. This EA is designed for easy to use with simple inputs parameters. INPUTS Trade Comment: user comment Magic No: unique EA Number Time Frame: default is H1 Min Lot: EA will execute not less than the minimum lot size for starting lot, taking into account the calculated risk set in percentage trade risk feature. Max

Price Momentum Index (PMI) Price Momentum Index (PMI) is a powerful and easy to use indicator. It can use for any currency and timeframe. Features Noise reduction. Trend detection. No lag. Good entry point detection. Good TP guide line. All in one window, easy to use and make decision. How to Use Prepare entry - When the PMI line (aqua) is between Signal (yellow) and Sinal2 (red) line. Entry - When the PMI (aqua) line breaks through Signal1(yellow) or Signal 2 (red) line. Exit - When the PMI li

トレーディングキングのMT5バージョン
Expert Advisor Trading KingExtendedの拡張バージョン
エキスパートアドバイザーの戦略は、トレンドの強さを評価し、修正/逆転ポイントを見つけることに基づいており、特定の期間における市場の上昇と下降の絶対値を比較します。このフィルターは、時間、スプレッドの拡大、ボラティリティの増加、スリッページ、曜日に基づいています。
FIFO要件のある米国のブローカーを含むあらゆるブローカーとの連携に適しています。すべての注文には仮想ストップロスが伴い、ピップで利益を上げます。チャートには、さまざまな情報とインジケーターのインジケーターが表示されます。推奨される最低保証金は、0.01ロットで200ドルです。 20ピップのスプレッドで50-70ピップを設定するために利益を取ります。時間枠はEAパラメータで設定され、デフォルトのパラメータはEURUSD用に最適化されています
STOPLOSS_IN_PIPS = TRUEの場合、STOPLOSSはピップで設定され、それ以外の場合は残高の%で設定されます。 STOP_T

(Currently 30% OFF)
Before reading the description of this indicator, I just want to introduce to you following concept Moving Average Line - Typical moving average which is based on one chart alone. Currency Strength Line - The moving average of a certain pair in which the strength is based on 28 pairs. Can be said as the real moving average line.
Moving Average indeed is one of the most popular indicator which almost every trader use. Currency Strength Meter is also a trend indicator whic

Strong Scalper Pro by LataLab - scalper Expert Advisor is based on the author's formulas for analyzing volatility and the strength of price movement. This allows the flexibility to determine global and local trends in the market and their correction, to obtain the most accurate entry points. All of the basic algorithms of the adviser have passed multiple tests on historical data over the past 10 years, the principle of operation is maximally adapted to the dynamics and volatility of today's mark

The intention of the dashboard is to provide a quick overview of the daily, weekly and monthly range of configured assets. In "single asset mode" the dashboard shows you possible reversal points directly in the chart, thus making statistics directly tradable. If a configured threshold is exceeded, the dashboard can send a screen alert, a notification (to the mobile MT4) or an email. There are various ways of using this information. One approach is that an asset that has completed nearly 100% of

A unique author's strategy that simultaneously determines the trend reversal, entry points and estimated profit levels for each transaction. The indicator can determine entry points on any trading period, starting with the M5 chart to W1. At the same time, for the convenience of the user, an arrow is always drawn at a certain point and the recommended profit levels (Take Profit1, Take Profit2, Manual Take Profit) the Stop Loss level is also displayed.
A great advantage of the indicator Trend S

The SuPrEs indicator indicates the distance to the next horizontal line whose name begins with the configured prefix (see Options).
usage Draw support & resistance in the chart and let the indicator warn you, as soon as a configured distance is undershot. Use the prefix to provide alarms for other lines as well as standard lines (see screenshot with pivot indicator).
Display of the indicator The indicator displays the distance to the next line above and below the current (Bid) price. Not mor
FREE

The dashboard should help to get a quick overview of the correlations of different assets to each other. For this, the value series are compared according to the Pearson method. The result is the value of the correlation (in percent). With the new single asset mode, you can immediately see which symbols have the highest positive or negative correlation. This prevents you from accidentally taking a risk on your trades with highly correlated symbols. Usage
There are different methods for the cor

Salva EA Free is an advanced and fully automated system, which passes backtesting since 2005. The basis of this strategy is the price chart itself, trading is performed based on the price movement range. Dynamic algorithms and filters are used for taking profit or closing trades. Built-in reworked system for filtering market entries and exits: Checking the trading direction using integrated trend indicators. Checking the channel range for the minimum and maximum values. Checking for the price ex
FREE

This indicator allows you to analyze the hidden trends and correlations between the 8 most traded currencies via unique strength meter which creates multiple charts in a single window based on the price action of each currency in relation to all other currencies. The indicator also includes interactive panel where you can see the trends for all 28 pairs as well as the distance to the highest and the lowest price for the selected period. With this panel you can switch between currency pairs with

Scalping Binary option Pro is a dial gauge. --------complete lack of redrawing ---------
The indicator does not work correctly in the strategy tester.
The red down arrow indicates that sales should be considered, and the green one - up (purchases).
All that needs to be set up is the colors of the signal arrows, as well as the activation or deactivation of the sound signal when a signal appears in one direction or another.
It is best to use high-pair pairs with a small spread in tradin

The intention of the dashboard is to provide a quick overview of the daily, weekly and monthly range of configured assets. In "single asset mode" the dashboard shows you possible reversal points directly in the chart, thus making statistics directly tradable. If a configured threshold is exceeded, the dashboard can send a screen alert, a notification (to the mobile MT4) or an email. There are various ways of using this information. One approach is that an asset that has completed nearly 100% o
FREE

This indicator helps the trader to make the final decision. When you have already decided in which direction the price will unfold, it remains as accurate as possible to determine the reversal itself. This is the task performed by the Konkov indicator. The indicator is installed on M1 and M5 charts. Indicator parameters: for M1 chart time_frame1 5 time_frame2
FREE

The dashboard should help to get a quick overview of the correlations of different assets to each other. For this, the value series are compared according to the Pearson method. The result is the value of the correlation (in percent). With the new single asset mode, you can immediately see which symbols have the highest positive or negative correlation. This prevents you from accidentally taking a risk on your trades with highly correlated symbols. Usage There are different methods for the corre
FREE

Created for signal providers, as well as for participation in various forex contests(and not only), can independently open an unlimited number of orders on the indicators WPR (Williams Percent Range) A series of experts: Lucky Star RSI and MACD, Lucky Star WPR, Lucky Star RSI, Lucky Star MA, Lucky Star SO, Lucky Star MACD, Lucky Star MA and SO, Lucky Star MA and MACD , Lucky Star SO and MACD the probability of winning real money in management or bonuses to real accounts ( read more on this in

Created for signal providers, as well as for participation in various forex contests(and not only), can independently open an unlimited number of orders on the indicators RSI(Relative Strength Index) and MACD(Moving Average Convergence/Divergence) Expert signals are here. A series of experts: Lucky Star RSI and MACD, Lucky Star RSI, Lucky Star WPR , Lucky Star MA, Lucky Star SO, Lucky Star MACD, Lucky Star MA and SO, Lucky Star MA and MACD , Lucky Star SO and MACD the probability of winning r

Foreign Currency Robox EA - the robot was created for traders who trade EURUSD. The default settings in the robot are for EURUSD. If you wish to trade on a different currency pair, you need to select other parameters in the settings of the robot. With the help of the new Stels_FX function, this robot is able to accurately determine the current price direction and predict the future trend direction. This robot is able to automatically adapt to the current market conditions using the averaging coe
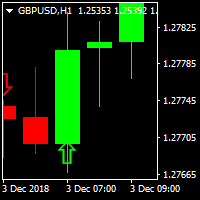
PIPs Forecast Indicator A traders perfect tool to catch big pips in the market One of its kind indcator that gets you in the game early enough
Supporting Multi-Currencies Works on all time-frames but if you're not a scalper stick to H1,H4,D1, W1 and MN for good results. Comes Pre-configured to ensure consitency Can be used alongside other indicators to avoid accumulation regions and Asian session ranges. For details, MT5 and EA questions feel free to contact me on elllykamau@gmail.com
Now wi

Duality is an autonomous automated trading system that does not use dangerous methods of trading (no martingale, no averaging, no increase in the lot).
The basis of the adviser's strategy is the correlation difference between candlestick formations and average price values at different points in time relative to the main points of the report.
Recommended use: EURUSD 5m, GBPUSD 5m, USDJPY 5m. Settings: Risk for Lot - risk percentage for the calculation of the trading lot; If MaxRisk = 0, lo

BeST_Trend Scanner is an MT4 Indicator that uses a proprietary algorithm in order to identify the most likely levels and probable moment for an upside or a downside trending price move.
BeST_Trend Scanner is a very useful tool that defines in advance and with a high statistical percentage of accuracy the subsequent Resistance & Support Levels of the anticipated upside or downside trending move of price and so
When used at its Reverse Entries Mode :
It generates Buy or Sell arrows at the

This indicator is based on the ADX indicator and indicates the trend very easily.
You can customize the indicator to your needs: ADXPeriod ADXSignal_Level BarWidth CandleWith HeikenAshi
The Adx color candles indicator is fully FREE and compatible with the other part of the system; the Acc arrow >>>> https://www.mql5.com/en/market/product/33770 ENJOY and check out my other indicator: https://www.mql5.com/en/market/product/32111
FREE

The ' Average OHLC ZigZag ' indicator was designed for entry confirmations as well as scalping with a larger trend. A custom formula to average the last two bars to generate arrows following market trends with bar 1 confirmation.
Key Features An extreme scalper calculating the averages between the last two market periods to generate a buy or sell arrow. No settings are available due to it's simplicity of custom price action pattern and using repainting four OHLC prices.
Input Parameters Zig
FREE

It's a triangular arbitrage system (three pairs correlation system) to use 3 currencies to make 3 pairs to open hedge orders on those.
The expert starts opening six orders for each ring (3 plus and 3 minus) and waits to move prices in one direction to make a grid of orders.
The expert can use a maximum of 8 currencies to make 28 pairs and make 56 rings.
It is important the order of currencies is from the strongest to the weakest.
Strongest... EUR/GBP/AUD/NZD/USD/CAD/CHF/JPY ...weakest.
FREE

EZT_Ichimoku_MTF
Multitimeframe Ichimoku indicator. Display up to 4 different Ichimoku on the chart. Every line of every ichimoku is customizable, you can turn off/on or choose different thickness or color. You can choose to see only the cloud in multiple ichimokus.
Optional info panel to identify the different Ichimokus. Works the same way like the original Ichimoku indicator.

This indicator is based on the ADX indicator and gives you safe entry points.
You can customize the indicator to your needs: RISK SSP COUNTBARS
The only condition that has to be met when entering a trade is, that the arrow faces in the same direction as the Adx color candles.
Download the FREE DEMO and test it!
The Acc arrow indicator is compatible with the other part of the system; the fully FREE Adx color candles
>>>> https://www.mql5.com/en/market/product/33768
ENJOY and ch

MARKET PREDATOR 1 --------------------------------------------------- This powerful and reliable indicator is based on a custom trend following strategy. It does not signal against the obvious trend. No fancy and clouded charts. It is a simple but powerful BUY and SELL signals indicator. It is great for Day Traders and Scalpers too. Each currency pair works better with a specific timeframe so use the recommended timeframes with their respective pairs as below:
PAIR || TIMEFRAME =
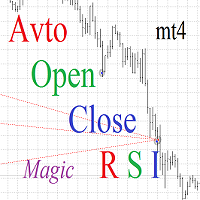
Auto Open Close Magic RSI.
Auto Open Close Magic RSI , это Робот открывающий и закрывающий ордера по значениям индикатора ( RSI Magic Kjuta ). Рекомендуемый период для установок по умолчанию М15. С советником можно загрузить RSI Magic Kjuta или RSI Magic Kjuta trial . Не забыть сделать настройки такие же, как в советнике. Скриншот за прошедшие полгода. С 500$ до 16000$ 3200%.
slip=3; Проскальзывание Lots=0.2; Объем step=120; Минимальное расстояние до открытия следующего ордера Magic=123456

What is InvisibleStopLoss? InvisibleStopLoss is a tool designed to allow the trader to hide his/her stop loss from other market participants. Unlike the usual stop loss attached to an order pernamently and visible to the broker, InvisibleStopLoss exists only on the MT4 termina l side and is visible only to the trader.
How to use it in trading?
With the help of the InvisibleStopLoss you can hide your stop order from the broker and set it up as a normal stop loss.
Additionally, InvisibleStop

What is InvisibleTakeProfit?
InvisibleTakeProfit is a tool designed to allow the trader to hide his/her take profit from other market participants. Unlike the usual take profit attached to an order pernamently and visible to the broker, InvisibleTakeProfit exists only on the MT4 terminal side and is visible only to the trader.
How to use it in trading?
With the help of the InvisibleTakeProfit you can hide your take profit order from the broker and set it up as a normal take profit. Addition
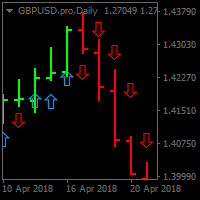
BUY SELL SIG. Utilizing unique price calculations BUY SELL SIG . generates high quality signals Now Features easy to use and Buy and Sell signals for Pro and Novice traders Supports Multi-currency Best results viewed on H1,H4 ,D1 and W1 Timeframes Supports audio alerts and notifications. No complex input parameters just notifications and the indicator style properties

SHOCK DEAL! --> BUY GOLD Scalper PRO with -$130 OFF and GET a BONUS PREMIUM EA! NOTE: (Regular Price: $397) - The offer ends soon! Click here to read more about Trend Matrix EA and the SHOCK DEAL promotion! GOLD Scalper PRO signal account: https://www.mql5.com/en/signals/2109002 For Settings, Instructions and additional LIVE Results Click Here! GOLD Scalper PRO is a fully automated trading system which takes much of the work out of trading, leaving you free to do other things! You should not

Spread Alert はスプレッドを監視し、スプレッドが通常よりも高い場合 は警告を発し 、設定したしきい値を超えている場合は 警告を発します 。 特徴:
スプレッドが正常 か、通常 よりも高い か 、アラートをトリガーし たかによって、 3つの異なる色を選択 します
カスタムサウンド を設定できる オプションのサウンドアラート (.wavファイルである必要があります)
ラベルにカーソルを合わせると、 記録された最低のスプレッド 、 スプレッド警告 、 アラートピップ 、および スプレッドステータス がツールチップに表示されます。
パラメーター:
名前
説明
サウンドアラート アラートのしきい値に達したときにサウンドファイルを再生します アラートサウンドファイル(.wavファイルである必要があります) アラートが鳴ったときに再生されるwavファイル
アラートサウンドオフ開始(ブローカーアワー) サウンドアラームがミュートされる開始時間
アラートサウンドオフエンド(ブローカーアワー) サウンドアラームがミュート解除される終了時間
アラートピップ 価格が満たすか超
FREE

In statistics, Regression Channel is a approach for modelling the relationship between a scalar response (or dependent variable) and one or more explanatory variables (or independent variables).We Applied relative strength index(rsi) values to develop regression models of various degrees in order to understand relationship between Rsi and price movement. Our goal is range prediction and error reduction of Price divergence , thus we use Rsi Regression
FREE
MetaTraderマーケットはMetaTraderプラットフォームのためのアプリを購入するための便利で安全な場所を提供します。エキスパートアドバイザーとインディケータをストラテジーテスターの中でテストするためにターミナルから無料のデモバージョンをダウンロードしてください。
パフォーマンスをモニターするためにいろいろなモードでアプリをテストし、MQL5.community支払いシステムを使ってお望みのプロダクトの支払いをしてください。
取引の機会を逃しています。
- 無料取引アプリ
- 8千を超えるシグナルをコピー
- 金融ニュースで金融マーケットを探索
新規登録
ログイン