YouTubeにあるマーケットチュートリアルビデオをご覧ください
ロボットや指標を購入する
仮想ホスティングで
EAを実行
EAを実行
ロボットや指標を購入前にテストする
マーケットで収入を得る
販売のためにプロダクトをプレゼンテーションする方法
MetaTrader 4のための新しいエキスパートアドバイザーとインディケータ - 263

This trading advisor works with strong movements of currency pairs. He can use different indicators for trading, calculate and draw trend lines according to the extremes of the price movement. It is a free, simplified version of ColdStream Expert Advisor, it has enough customizable parameters for optimization, but a little less than in the full version. Also, the maximum lot is limited to 0.1. Nevertheless, you can use almost any currency pairs and timeframes for trading. Do not forget to optimi
FREE

MoveWave - Moving waves are very handy indicators for determining pivot levels. Most Forex traders make decisions based on technical analysis. This type of analysis determines patterns and trends in the market. With the help of complex mathematical equations that are combined and made out in the form of this indicator, the trader will be able to more accurately determine the price reversal levels. Wave theory mathematically represents various behavioral models of the market. It is used as the ba

The BstMACD expert system works using the MACD indicator and sharp tick movements. Works with a deposit of $ 100! The method of trading scalping trend. With an acceptable level of spread, the bot passes any historical period on any currency pair. There is no point in testing at opening prices, either checkpoints or all tics. It is possible to work on accounts with a floating spread; entry into the market will occur only when the spread is lower than the level specified in the settings.
Settings

Ultimate Simple - полностью автоматизированная торговая система. Торговый робот работает на любых валютных парах и на любом таймфрейме. Работа робота основана на принципе дивергенции(против основного тренда).
Объем входа в рынок и риски жестко контролируются на основе алгоритмов. Количество сделок ограничено уровнем свободной маржи в процентах, которое по умолчанию равно 1500% (во входных параметрах level = 1500.00). Объем входа в рынок зависит от количества свободных средств на счету, а если с

This Expert Advisor will change how you manage your risk forever.
The EA automatically calculates your position size by either looking at your balance or equity. You need simply type in how much risk you want to have on that particular trade, move your TP line and SL line and it does the rest. Click buy or sell and it enters the position and places your TP/SL for you. It does the same thing for pending buy limits or sell stops. Feel confident knowing your risk before entering your trade! Most
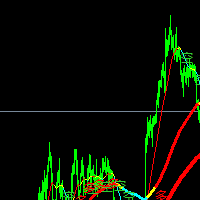
Based on the trend of more empty line. At present is version 1.03, with new later. Appear more prompt, can open more than single Empty message, can open an empty list The discoloration of three counties, represent different levels of The market at present there is an organization - the sea education, they are also more empty lines, but I more empty line is based on their changes, on the basis of identifying trend more accurately.
Trad duokong line is an automatic identification of long-short t
UPDATE: Works EXTREMELY well for EURJPY! --> more than 66% win rate monthly Guarantee! I want to introduce you the next-gen unique adaptive Binary options Indicator. This will destroy EURUSD & EURJPY The Raven is so sharp and efficient that it will pick the tops and bottoms of ANY type of market. Can also be used as a Forex Scalper. The Raven signal is based on multiple confirmation analysis. Gets confirmation from the most consistent signals known to man; Ichimoku, SMA, Bollinger Bands; and als

Euro Gift (EURUSD M15) I am celebrating my birthday, so i will publish some EAs for FREE. This EA has been developed for EURUSD M15. Strategy is based on ICHIMOKU indicator and has very little parameters - so its VERY ROBUST. It uses Stop pending orders with ATR Stop Loss . At 9:00 pm we are closing trading every Friday to prevent from weekly gaps. !!!Adjust these times to your broker time. Preset values are for UTC+2 only!!! For every candle the pending orders are modified to adapt the mar
FREE

M1Arrows is a MT4 trend arrows Indicator
* Smart Scalper Setup (M1) :: Signal 5 Main 20 + Signal 20 Main 80 + Fibonacci ZigArcs 20
(Screenshot1) Add the indicator with first setting,
then add it again to the same graph with other settings.
You can add as many as you want, but 2 M1Arrows in just one graph is enought
Never open orders againt the slow setting trend
Do not open more than 3 orders per slow setting trend
It will work better in Europe/USA markets, * M15 Day Trade Setup: Signal 20 ma
FREE

Общие сведения Для начала торговли достаточно небольшого депозита. Идеален для быстрого разгона депозита!!! Подходит для мультивалютной торговли. Невосприимчивость к большой задержке и величине спреда.
Принцип работы После запуска советника на графике советник запоминает уровень открытия первого ордера. Выше уровня открытия первого ордера советник выставляет сеть ордеров на Sell . Ниже уровня открытия первого ордера советник выставляет сеть ордеров на Buy . Если общая прибыль ордеров на покуп
FREE
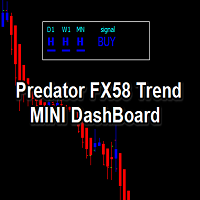
Heiken Ashi Bar Type based indicator: Enter Trades with the Confidence that higher timeframes agree. This tool will display the condition and direction bias all in one window, without need to look at the charts. Professional Traders who do trend trading or scalping with the trend, this is a great tool to be alerted by when the asset is ready. Example: Choose any MT4 timeframe you want Daily timeframe H4 timeframe H1 timeframe Choosing your favourite moving average method: EMA 50/ EMA 100 / EMA

Unveiling WILD CYCLE EA: A Strategy for Dynamic Market Trends Adaptive Trading in Motion Embarking on the trading landscape from June 2021, the WILD CYCLE EA presents an evolutionary approach to market-trend following. Pioneering a relentless pursuit of profit, this EA deftly adapts to shifting market dynamics. Navigating the Core Strategy At its heart lies a fundamental approach—initiating positions in the direction of positive SWAP, such as the EURUSD SHORT. These positions are meticulously c

Vroom Vroom is a Trading Robot with no use of Classic martingale. Schedule scalping Options. it uses some Indicators as a filter to maximize Correct entries, Smarter than Hamster Pro! *StopLoss and TakeProfits are automatically updated by the EA during trading. user Not allowed to modify them! Recommendations : Lot = 0.01. ( if autolot enabled Allow (initial Lot) per (xx)USD = 100 ). Balance = 300 USD. Pair = EURUSD. TimeFrame = 5Min. Broker = Trusted Brokers
Inputs descriptions : Initial
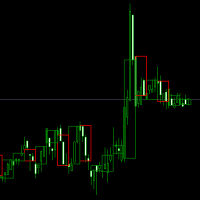
Get the bars from higher time frame on your main chart. You can be trading on M15 and watch H1 and H4 bars at the same time. Use the advantages by watching a single chart and keep track of Japanese candlesticks patterns from a higher time frame. You can no scalp on M1 or M5 without loosing sights of how much is it left for the M30 or H1 candle to close and if it bullish or bearish.

VERY RELIABLE DAY TRADING AND SCALPING INDICATOR THAT CAN MAKE EVEN A NEWBIE PRODUCE TREMENDOUS RESULTS. IT IS SIMPLE AND FAST, NO FANCY ON-CHART OBJECTS. JUST BUY AND SELL ARROWS. IT TELLS YOU WHEN TO ADD TO A POSITION AND WHEN YOU SHOULD CONSIDER EXITING. THE BEST TIME TO EXIT ALL TRADES COMPLETELY IS ON OPPOSITE SIGNALS
GREAT PRODUCT FOR ALL TRADING STYLES (swing, day trading, scalping, etc). JUST TRY IT ON ALL TIME FRAMES AND CURRENCY PAIRS AND SETTLE ON THE ONE YOU FIND COMFORTABLE. Stric

Niubility Trend Niubility Trend displays the trend direction for all time frames in real time.
You'll see at a glance at which direction the trends are running, how long they last and how powerful they are.
All this makes it an easy-to-use trend trading system for beginners, advanced and professional traders.
Features
Easy to trade Customizable colors and sizes It is non-repainting and non-backpainting It is fantastic as a trailing stop method It implements alerts of all kinds

This Scanner scans moving average(MA) line across multi-currency pairs and multi-time frames and shows all the result in the dashboard. 1. Current bar is about to cross up the MA line - designated as "Xup". 2. Current bar is about to cross down the MA line - designated as "Xdn". 3. Previous bar that has just crossed up and closed the MA line - designated as "UP". 4. Previous bar that has just crossed down and closed the MA line - designated as "DN". Input parameters can be changed: MA, dashboa
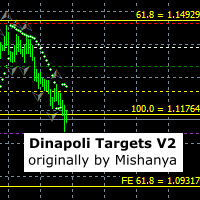
This indicator sets stop, start and target 1, 2 and 3 levels based on detected market swings on multiple timeframes. It was originally written by Mishanya and has been updated by Ramoletane to move with the price and automatically update the levels. A trade can be placed when price has crossed the white start line and stop loss placed on the red stop line. The lot size can be reduced at the green target 1 level, the yellow target 2 level and the position finally closed at target 3. Most of the t
FREE

Blockbuster
– автоматическая торговая система, разработанная для торговли на валютной паре GBPUSD. При появлении торгового сигнала робот открывает рыночный ордер и дополнительные лимитные ордера в количестве заданном в параметре OrderCount . Сетка ордеров не является торговой тактикой, но способствует значительному росту доходности. Торговля возможна и без дополнительных ордеров, для этого параметр OrderCount нужно перевести в значение 0. Торговля ведется внутри дня. Все ордера закрываются ка

これは、EAが「資本ラインとし て」の指標に基づいていることです。
ヘッジなし
最大の利益を得るために、このEAはシグナルごとに3つの取引を開くことができます。それぞれに異なる戦略を使用する。
最初のものは信号から次の信号です。 二つ目はトレーリングストップを使うことです 3つ目は固定テイクプロフィットです。
あなたが欲しい取引を有効または無効にすることができ、あるいは一方向のみを有効にすることもできます。 EAに影響を与えずに手動で取引を閉じることができます。
設定 Buy 1をアクティブにする// --------操作のためにロングトレードを有効にするには1 売り1を有効にする// --------操作のためにショートトレードを有効にするには1 Buy 2をアクティブにする// --------オペレーション2でロングトレードを有効にする 売り2を有効にする// --------操作2でショートトレードを有効にする Buy 3をアクティブにする// --------操作3でロングトレードを有効にする 売り3を有効化// --------操作3でショートトレードを有効にす

もしあなたがFX取引をしているなら、通貨の強さと通貨ペアの相関関係に関する詳細な情報を持つことは、取引パフォーマンスを飛躍的に向上させることができます。相関関係を活用すればリスクを半減でき、強さの分析を活用すれば利益を最大化することが可能です。 このインジケーターは、通貨の強さ分析と通貨ペアの相関関係を組み合わせたハイブリッドなアプローチにより、最適な通貨ペアを選択するサポートをします。
通貨の強さ分析の使い方
例えば、あなたの取引戦略でAUD/JPYの買いシグナルが出たとします。しかしKTの通貨強さ分析を使うと、JPYがAUDよりも強くなっていることがわかりました。この場合、その取引は損失に終わる可能性が高いです。このインジケーターがあれば、そのような損失を未然に防ぐことができます。
通貨ペア相関関係の使い方 例えば、NZD/USDとGBP/JPYの同時売りシグナルが出たとします。KTの通貨ペア相関ツールを使うと、これらのペアの相関率が77%であることが判明します。
これらのペアは強く相関しているため、同時に取引するとリスクが二重になります。もしNZD/USDで損失が出れば、

このスクリプトは、トレーダーが可能な利益と損失の比率が最適になる貿易取引の平均期間を決定できるように設計されています。 まず、貿易取引の最適期間を決定するための一般的なアプローチを見てみましょう。以下の変数を紹介します。 R - トランザクションの結果 T - トランザクションが開かれていた時間 W - 前のトランザクションの終了と次のトランザクションの開始の間の時間 すべてのトレーダーは、最短時間で最大の利益を得ることを目指しています。この欲求は次の簡単な表現で説明できます。 R/(T+W)→max 。 変数 T と W がトレードの合計期間と行われたトランザクションの数の両方に依存することは明らかです。トランザクションの平均期間を ATD 、トランザクションの合計数を N とします。その場合、トランザクションの平均期間は、合計の平方根に比例して増加するはずです。つまり、 ATD~√N しかし、現存する十分に根拠のある質問があります - 他の取引期間と同等の取引期間はありますか?そして、取引期間はトレーディング業務の結果にどのように影響しますか?提起された質問への回答を得るた
FREE

You do not have to set anything on this EA because it already has the best settings. Pure breakout and acts only in high news where the range goes out via a special indicator. We did a backtest of 2 years with 99.9% tickdata. The result very much on the video!
Best Timeframe: 1 min and 5 min
Only EURUSD best ECN account with as little spread as possible. With a spread of 12, the EA is still working quite well!
VPS should be very fast at least 1 - 4 ms

Description:
- D ay Pattern - an indicator that helps to identify patterns of price changes for the development of trading algorithms and strategies.
For whom this tool?
- For developers of trading strategies and algorithms.
- Medium- and long-term traders. Time frames H1-W1.
Features of the indicator:
- There is a function of exporting indicator values to a file of the csv format.
- Using the information panel, you can conduct an express analysis of trading tool.
- The indicator is sui

The cut release of Top Signals Strategy EA for less price. With default parameters EA works in Assian session and scalps market. EA opens trades by RSI indicator signals in a specified time interval. In the case of a repetition of the signal opens a unidirectional transaction. The number of transactions per day can be limited. Revolves trades on the opposite signal. Displays information on trade and its results. Also you can set virtual stop loss and take profit. Telegram channel for discation p
This utility automatically draws the trend channel on the price chart. For the time interval from the specified date to the current bar, the drawn channel is almost optimal. Placing the beginning of the channel at a more distant historical price extremum, you get a visualization of a longer-term trend. Channel slope is not a continuous value, but takes one of discrete values (in AxB format, where A is the number of price points (points), and B is the number of timeframes). This program works ONL

Scalping Monster Ultra Shock - ready-made system for trading on the scalping strategy. This indicator is a whole analytical center with analysis algorithms close to neural networks. The indicator automatically analyzes the market, examines the behavioral characteristics of the price, the impulses of market trends, the balance of trading, and based on the collected data, the indicator predicts points of reversal and further price movement.
How to trade using Scalping Monster Ultra Shock: when

Mars 3 is a Tren indicator. I s a powerful indicator of TREND for any par and any timeframe. It doesn't requires any additional indicators for the trading setup.The indicator gives clear signals about opening and closing trades.This Indicator is a unique, high quality and affordable trading tool.
Perfect For New Traders And Expert Traders Low risk entries. Never repaints signal. Never backpaints signal. Never recalculates signal. For MT4 Only Great For Scalping Great For Swing Trading Arrow

The recommended timeframe is H1!
The indicator has two kinds of signal.
This is a signal to open a position from the appearance of an arrow. The price leaves the channel In the first case, the indicator builds arrows based on the constructed channel and Bollinger Bands years.
In another case, the trader can trade if the price just went beyond the channel. If the price is higher than the channel - we sell. If the price is lower than the channel, then you can look for a place to buy.
It can al
FREE
Obiforex - Pending Orders Specialized for trading during news events and at any other time in the market, Obiforex - Pending Orders is a program designed to enhance your trading experience. By utilizing pending orders, you can seize market opportunities with precision and efficiency. Buy Stop: Place a pending purchase order at a higher price ("stop" price) than the current price. The Buy Stop order will be executed if the sale price ("Ask") quoted on the platform is equal to or higher than the o
FREE

The SuperZigZag indicator is a signal indicator that is used to form trend lines connecting the main peaks and bases on the price chart. It graphically displays the most significant reversals and kickbacks of the market. Also among the objectives of this tool - cutting off noise that interferes with the consideration of the most significant movements.
Unlike most other technical indicators, ZigZag does not predict the future behavior of prices, but only reflects their behavior in the past. But
The MACD and MA filter EA trades on the MACD indicator, uses the filter as two moving averages (fast MA is higher than slow MA - buy, sell - contrary), the Martingale is applied at the request of the User (the amount of lot multiplication for a series of losses is limited), breakeven, trailing stop, inverting the signal. In EA version 1.4. added closing an order by a reverse signal, separately by the MACD indicator (parameter Close_By_Reverse_MACD_Signal), separately by moving averages (paramete
FREE

SmartChanelFree is a universal indicator for all types of markets. This indicator should have in its arsenal every trader, since it represents a classic approach to analyzing the price of a trading instrument and is a ready-made trading strategy. The indicator forms the upper, average price movement limit. Attention !!! This version of the indicator is trial and works only on the chart with the period M1. The full version of the indicator can be found at: https://www.mql5.com/en/market/product/
FREE

Delete big amounts of orders, in just a few clicks. Drag the script to any chart to delete open and pending orders, you can delete all the orders from the account or delete a specific order groups, identifying them by magic number. You can modify the parameter MAGICN on the followay way: - Introduce the magic number that was used to place the orders you want to delete, the script will delete all pending and open orders that were placed with that magic number. - Also, introduce 0 (cero) to delete
FREE

Fully automated Expert Advisor designed for the forex market. The main properties: - The number of characters in quotes is determined automatically.
- The EA works with standard accounts, cent, micro and ECN accounts.
- Timeframe of the chart does not matter. This parameter is defined in the settings.
- The EA uses a dynamically calculated lot size or fixed.
- The spread filter does not allow the expert advisor to open orders at a high value.
- The EA always uses Take Profit and thus it is

The HORNET automated trading advisor was designed to work with the EURUSD pair, but with proper optimization it works successfully on many other currency pairs. The algorithm of work is based on several precise strategies, such as: regression channels on several timeframes, Price Action patterns, following the medium-term trend. The use of several filters, such as: control of the average daily deviation, reversible patterns on higher timeframes, determining the medium-term trend, allows you to

!!!! ВНИМАНИЕ! установите Minimum lot 0.01 Советник HourGlassEA — это безиндикаторный, мультивалютный робот, принцип работы которого является выставление сеток ордеров. Ставится ордер и в случае движения цены в противоположном направлении, выставляется серия ордеров с фиксированным расстоянием между ордерами. Советник ждёт откат цены, при котором закрывает серию ордеров с профитом, и цикл повторяется. Советник торгует сетками одновременно в двух направлениях — сетки строятся и на покупку (buy),

This dashboard is a great tool for user who trade using Stochastic and Relative Strength Index(RSI). It is an upgrading from STOCH and RSI Alert product. For details and free download please click here . It monitors multi currency pairs on multi-time frame. It fires signal to mobile phone, pop-up alert and send email. Please go through all the pictures below for detail descriptions of the inputs and parameters.

The Expert Advisor was developed to grow user account balance persistently. To achieve this, it has two modes, normal and recovery mode. The parameters for the two modes can be changed to suit user strategy. There are also auto trade button, buy button and sell button. Auto trade button can be turned ON and OFF. Buy and sell buttons is for user to manually intervene a trade. HOW IT WORKS. The Expert will trade automatically according to the input parameters. It trades in Normal mode when there
FREE

This indicator Super Channel Pro Pluss indicator.Indicator displays trend movement. Indicator calculates automatically line. Features
FiltPer - displays indicator channel period. deviation - displays indicator channel deviation. deviation2 - displays indicator channel deviation. deviation3 - displays indicator channel deviation. How to understand the status: If the arrow is up and line color Teal ;trend is up. If the arrow is down and line color Red; trend is down. If the arrow is Yellow close

Double Dollar (EURUSD H1, GBPUSD H1) This EA has been developed for EURUSD H1. It also works very well on the GBPUSD H1. So you will get 2 strategies for lower price, that means better equity curve, higher profits and lower drawdowns. Everything is tested for H1 timeframe . Strategy is based on breakout of the This Bar Open indicator. It uses Stop pending orders with ATR Stop Loss and ATR Take Profit . At 9:00 pm we are closing trading every Friday to prevent from weekly gaps. !!!Adjust th

Best EA ! ATTENTION : The Tiger Control EA can not be tested in the MT4 strategy tester !!!
TigerControl EA robot is a fully automated robot for Forex trade. TigerControl EA is a combination numerous special trend strategy ,that It provides the possibility the best entries of the trade . TigerControl EA robot is designed for medium and long term trading ,the robot will help you deal with and manage emotions ,and you don't need worry about news release any more !! The trend is the key ,

This indicator Super Channel Pro indicator.Indicator displays trend movement. Indicator calculates automatically line. Features
FiltPer - displays indicator channel period. deviation - displays indicator channel deviation. deviation2 - displays indicator channel deviation. How to understand the status: If the arrow is green, trend is up. If the arrow is red, trend is down. ///////////////////////////////////////////////////////////////////////////////////////////////////////////////////////////

Reiona is an Expert Advisor (EA) that build based on martingale and hedging method.
The main idea is place buy and sell in parallel, save the unprofitable positions with martingale, and keep the profit during trade with hedging.
The RSI, iClose, iHighest and iLowest indicators are used for entries. The highest and lowest prices are to indicate the range of new orders, where the next order, with same type must be higher than 75% of difference between this lowest and highest prices.
When the bu

Euro Forecaster (EURUSD H1) This EA has been developed for EURUSD H1. Everything is tested for H1 timeframe . Strategy is based on breakout of the THIS BAR OPEN after some time of consolidation. It uses Stop pending orders with ATR Stop Loss . For locking profits the BE and TRAILING PROFIT functions are present. At 9:00 pm we are closing trading every Friday to prevent from weekly gaps. !!!Adjust these times to your broker time. Preset values are for UTC+2 only!!! For every candle the pendi
Советник "Four_MA_trade" входит в рынок по средним скользящим следующим образом: 1. две скользящие средние с большими периодами определяют общий тренд 2. две скользящие средние с малыми периодами определяют локальный тренд. Если направление общего и локального тренда совпадает, то на пересечении "локальных" средних скользящих открывается ордер. Возможно инвертирование сигнала, если период быстрой скользящей в настройках выставить больше по значению, чем период медленной. Для каждой валютной пар
FREE
Use Forex Trading Profit Tracker to keep a record of your earnings across accounts. This indicator will show a dashboard in the Meta Trader chart to show for the profit or loss money in your account. It’s easy to see just how much money you’re making matched betting with the Forex Trading Profit Tracker. Key features: Track your profit over time Check out your stats. Track expected profits against actual profits. Export account history to Excel.
MT5 version(*): https://www.mql5.com/en/market/
FREE

Harami is a two candle pattern with recent candle formed inside the previous candle's high and low . It represents indecision in the market and is used for breakout price action trading strategy. This indi fires all signals to a dashboard on the chart including pop_up alert, push to phone notification and email. Harami has two types, bullish and bearish pattern. Enter long for bullish Harami and enter short for bearish Harami. Inputs : Currency Symbols: EURUSD,GBPJPY,USDJPY,USDCAD (default) , u
FREE
Советник "Stochastic and MA_filter" торгует по индикатору "Stochastic Oscillator", используя фильтр в качестве двух средних скользящих, по желанию Пользователя применяется мартингейл (количество умножения лота при серии убытков ограничивается), безубыток, трейлинг стоп, инвертирование сигнала, возможно настроить, как скальпирующий советник.
Для каждого валютного инструмента необходимо подбирать настройки. Настройки советника: Индикатор Stochastic Oscillator: Kperiod=5; период линии K Dpe
FREE
Советник "RSI and MACD filter" торгует по индикатору RSI, использует фильтр в качестве индикатора MACD (главная линия выше сигнальной - покупка, продажа - наоборот), по желанию Пользователя применяется мартингейл (количество умножения лота при серии убытков ограничивается), безубыток, трейлинг стоп, инвертирование сигнала. Настройки советника: Индикатор RSI: RSI_Period = 14; используемый период индикатора
RSI_Shift = 1; номер свечи выбранного графика, с которой советник берет сигнал, 0 -ориенти
FREE
Советник "RSI and MA filter" торгует по индикатору RSI, использует фильтр в качестве двух средних скользящих (быстрая MA выше медленной MA - покупка, продажа - наоборот), по желанию Пользователя применяется мартингейл (количество умножения лота при серии убытков ограничивается), безубыток, трейлинг стоп, инвертирование сигнала. Настройки советника: Индикатор RSI: RSI_Period = 14; используемый период индикатора
RSI_Shift = 1; номер свечи выбранного графика, с которой советник берет сигнал, 0 -ор
FREE
Trend Scanner looks at the Market watchlist and Checks to see if there are trending cases between three (3) timeframes selected by the user.
The analysis can assist in finding pairs to focus on for a particular session where a trader may need to have a bias in terms of direction to place trades for a particular system which requires multiple timeframe filtration of bar momentum. 3 Main indicators are involved: Moving Average, MACD and Heiken Ashi. User is able to select timeframes available on
ISR Pro is a powerful indicator that works non trending market conditions. This indicator is perfect for scalp trades as well as swing trades. Intraday is another way of saying "within the day." Intraday price movements are particularly important to short-term traders looking to make many trades over the course of a single trading session. Features This indicator does not repaint and never changes levels in the history. For all you can see in the history, the indicator will show exactly the sam
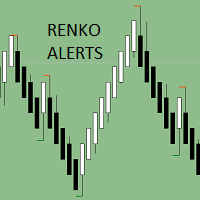
Renko Charts now have the alerts, we need. There are four alert types to choose from for notification on screen, email or phone notification. The alert types also have buffers for use with automation. This indicator can be incorporated with any system that requires renko charts. The four (4) alert types are: Three-bar Formation; Pinbar; Maubozu and Engulfing Bar The alerts may also be adjusted by settings found in the input window of the indicator.

Trend Hero is an indicator that generates trend signal. It generates trend signal with its own algorithm. These lines give buying and selling signals. Can be used in all pairs. Sends a signal to the user with the alert feature.
Trade rules Enter the signal when the buy and sell signal arrives. Processing should only be initiated when signal warnings are received. It is absolutely necessary to close the operation when an opposite signal is received. Or the user has to stop the damage and put th

This system is very simple.. It uses a martingale grid hedging style strategy by increasing lot sizes and grid levels. The open order step and volume can be both fixed and dynamic. The EA is easily customizable. The EA does not use a stop loss and all positions close when the chart move back from trend and arrive last grid level. Recommended : pairs : Side way pairs is very good for this system. Time frame : not important. Deposit

This is the first out of a series of two indicators from the magic series. This indicator is Magic Volumes , this is the Indicator at the Bottom in the screenshot. The indicator plots up to 30 instruments and visualizes events like: Time, Start, End and Duration of the events. Levels of activity in the form of Tick Volumes. Patterns. Time Cycles. What normally remains hidden between charts, will now be revealed in the blink of an eye. The need of an economic calendar becomes obsolete, simply

Jet Punch is another best expert advisor for MT4, can help you make money while you sleep by automatically entering and exiting trades. It trades by opening trades every day and closing them at the right time to ensure you always earn a profit. The software is very simple and can be used by both beginner and experienced traders. Jet Punch was tested and has successfully passed the stress test with slippage and commission approximate to the real market condition. Recommendations:
Currency pair:

Decent Trading Tools, The ones that separate the Winners from the Losers, do not have to be expensive. This is the second out of a series of two indicators from the magic series. This indicator is Magic Correlation , this is the Middle Indicator in the screenshot. The indicator plots up to 30 instruments and visualizes events like: Time, Start, End and Duration of the events. Underlying Correlation. Trend Strength. Front Runners and Laggards. Directions. Patterns. What normally remains hidden be

Fibonacci ZigArcs MT4 Indicator A Signals filter with breakout + 3 S/R levels Zigzag tops and bottoms auto draw and update
the mt4 native fibonacci arcs.
The zigzag parameter can be changed by the user.
The Arcs color can be changed by the user.
This trend map provides the view of
the 360 fibo range with levels as filters and targets
To have this map around the price in a graph,
gives a safe trade, without get lost with trends,
or be trapped by false signals from indicators

Общие сведения Для начала торговли достаточно небольшого депозита. Подходит для мульти-валютной торговли. Не зависим от качества соединения и торговых условий.
Принцип работы
Эксперт открывает ордера по встроенному индикатору. Если прибыль ордера плюсовая. Данный ордер закрывается и открывается новый в противоположном направлении объёмом Lot . Если прибыль ордера минусовая. Данный ордер закрывается и открывается новый в этом же направлении и объёмом в Martingale раз больше преведущего.
Рек

Perfect Peenachi
Perfect Peenachi is a new trend based MT4 Indicator. This indicator is perfect for scalp traders as well as swing traders. It simply show you the trend where traders can get into the beginning of the trend.
Indicator Parameters
This has only two input parameters which is easy for the users to make their own customization Main Period = This period used to calculate major trend Sub Period = This period determines the lower level trend
Notes: This indicator alone is enough

TRADING INDICATOR SHOWS AS JUDGING FROM the NAME BEGINNING AND the END of the THREE TRADING SESSIONS in the FOREX market : ASIAN(RED),EUROPEAN (GREEN), AMERICAN (PURPLE) COLOR.
This indicator applies a color marking on the chart of any currency pair, in the form of squares. Each square corresponds to the duration of the session and its height corresponds to the trading range.

Brexit Breakout (GBPUSD H1) This EA has been developed for GBPUSD H1. Everything is tested for H1 timeframe . Strategy is based on breakout of the This Bar Open indicator after some time of consolidation. It will very well works on these times, when the pound is moving. It uses Stop pending orders with FIXED Stop Loss and Take Profit . It also uses PROFIT TRAILING to catch from the moves as much as possible. At 9:00 pm we are closing trading every Friday to prevent from weekly gaps. !!!Adjust

Geppy (GBPJPY H1) This EA has been developed for GBPJPY H1. Everything is tested for H1 timeframe . Strategy is based on breakout of the HIGHEST/LOWEST channel after some time of consolidation. It will very well works on these times, when the pound is moving. It uses Stop pending orders with ATR Stop Loss and FIXED Take Profit . At 9:00 pm we are closing trading every Friday to prevent from weekly gaps. !!!Adjust these times to your broker time. Preset values are for UTC+2 only!!! For every

Эксперт для VPS. Работает по уровням magicRSi, мартингейлу и своему алгоритму. Автоматически тралит по значениям индикатора, как при открытии, так и при закрытии ордеров. Для скриншота годового отчета настойки по умолчанию. Начальный депозит - 100, конечный - за год больше 17000. slip=3; допуск
Lots=0.1; Лот на открытие первого ордера. step=50; Начальная минимальная дистанция в пунктах между первым ордерами.
Magic=123456; Числовая идентификац

Hello, this is my best expert. This expert contains two general part, first part is take position and second part is manage the position.One of the good things about this EA is that it allows you to open a order both manually and automatically and EA manage that position.(Autoposition in Expert Options)
-The automatic operation for open order is based on signal of the indicators (EMA & BB)
-Position management :
The most important part of this EA is related to the management of positions and con

Trend Power Level indicator is a special indicator designed to capture healthy signals. There are lines showing the signal of the indicator and the power of buying and selling. The signal line is yellow. The green lines are Buy lines. The ones that are brown are Sell lines. The green line must close above the yellow line to perform the operation. The brown line must close above the yellow line to sell. The important line is the first one that closes above the yellow line. If the first line is gr

FV 4005 Stage II Представляю Вашему вниманию новый автоматический советник основанный на базе индикатора Bollinger Bands. Данный эксперт принимает торговые решения основываясь на показаниях линий Боллинжера. Торговые рекомендации: Тайм Фрейм - М15; Валютная пара - EURUSD (по мере тестирования и обновления валютные пары и настройки для них будут добавляться в комментариях); Настройки: Dynamic Lot - динамический лот; Start deposit - объем Вашего начального депозита; Lot - лот в расчете на Start

Индикатор Price Bars and Chart Patterns основан на трех баровых паттернах: Double Key Reversal Bar Popgun Multiple Inside Bar Индикатор Price Bars and Chart Patterns выставляет значки на покупку - зеленый цвет, и на продажу - красный цвет. Значки выставляются согласно сформированным баровым моделям после их подтверждения. Индикатор Price Bars and Chart Patterns работает на всех тайм-фреймах.Входные параметры отсутствуют. Индикатор Price Bars and Chart Patterns самостоятельно проделывает р
MetaTraderマーケットは自動売買ロボットとテクニカル指標を販売するための最もいい場所です。
魅力的なデザインと説明を備えたMetaTraderプラットフォーム用アプリを開発するだけでいいのです。マーケットでプロダクトをパブリッシュして何百万ものMetaTraderユーザーに提供する方法をご覧ください。
取引の機会を逃しています。
- 無料取引アプリ
- 8千を超えるシグナルをコピー
- 金融ニュースで金融マーケットを探索
新規登録
ログイン