 MetaTrader 5
 エキスパート
 インディケータ
 ライブラリ
ライブラリ
 ユーティリティ
 ウィジェット
 ルール
ルール
YouTubeにあるマーケットチュートリアルビデオをご覧ください
ロボットや指標を購入する
仮想ホスティングで
EAを実行
EAを実行
ロボットや指標を購入前にテストする
マーケットで収入を得る
販売のためにプロダクトをプレゼンテーションする方法
MetaTrader 4のための新しいテクニカル指標 - 158
 以下にリストされているテクニカル指標からのシグナルは、MetaTrader4プラットフォームで取引を開始および終了する際に重要な役割を果たします。
指標の本質は、価格変動の予測を目的とした金融銘柄価格の数学的変換です。
以下にリストされているテクニカル指標からのシグナルは、MetaTrader4プラットフォームで取引を開始および終了する際に重要な役割を果たします。
指標の本質は、価格変動の予測を目的とした金融銘柄価格の数学的変換です。 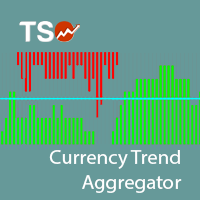
The TSO Currency Trend Aggregator is an indicator that compares a selected currency's performance in 7 different pairs. Instantly compare how a currency is performing in 7 different pairs. Easily get confirmation of a currency's strength Combine the indicator for both currencies of a pair to get the total view of how strong/weak each currency is. The trend is classified as positive (green), negative (red) or neutral (grey). Can easily be used in an EA (see below)
Currencies EUR USD GBP JPY AUD

This indicator is based on CCIs indicators and is fully automated. Line shows trendline by CCIs. This indicator calculates CCIs of All timeframes and shows current line on each timeframe. You can use it on any timeframe you wish, trendline is calculated for this timeframe. Settings are not needed. Test it on Demo account before Real Account. Trading is risky. You trade at your own risk.
Spread Monitoring is a unique product for analyzing a spread. Unlike most similar indicators, Spread Monitoring uses ticks rather than bars allowing you to detect abnormal spread expansions. Features
Works on ticks rather than bars. Simple and easy indicator configuration. Works on all timeframes. Works on any financial instrument. No repainting.
Parameters
Total - number of displayed ticks. clrSpread - indicator line color.
FREE

i-Orders is a simple indicator to monitor your own trade/analyze others' trades. I use it for a long time and do not imagine a chart without these arrows, lines and trade result numbers. The features allow you to:
disable display of opened and closed positions ( Show OPENED , Show CLOSED , Show PENDING ), change colors of arrows and lines for profitable and loss-making buy and sell positions separately ( Color for profitable/ losing BUYs/SELLs ), change style and width of the lines connect

Entry Arrow Alerts: Finds market entry opportunities then notifies you via mobile or desktop alerts The key features include: Conservative mode . One entry signal per direction. Ideal for the patient trader looking to capture longer term moves. Aggressive mode . Multiple possible entry signals per direction. Ideal for the active trader looking to capture multiple moves within the same trend. Trigger Line . Price entry line helps cut down on false signals. Display Window . Allows you to instantly

The Moving Average Slope (MAS) subtracts the moving average level n-periods ago from the current moving average level. This way, the trend of the moving average can be drawn on the moving average line.
Features Observe uptrends and downtrends at a glance. The indicator is non-repainting. Returns buffer values for the trend of the moving average to be used as part of an EA. (see below)
Inputs Moving Average Period : The period of the moving average (MA). Slope Period : Number of periods between
FREE
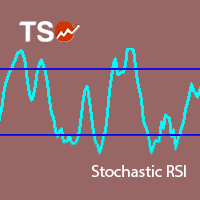
Stochastic RSI makes a stochastic calculation on the RSI indicator. The Relative Strength Index (RSI) is a well known momentum oscillator that measures the speed and change of price movements, developed by J. Welles Wilder.
Features Find overbought and oversold situations. Sound alert when overbought/oversold level is reached. Get email and/or push notification alerts when a signal is detected. The indicator is non-repainting. Returns buffer values for %K and %D to be used as part of an EA . (s
FREE
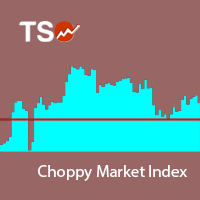
The Choppy Market Index (CMI) is an indicator of market volatility. The smaller the value of the indicator, the more unstable the market. It calculates the difference between the closing of the last bar and a bar n periods ago and then divides that value by the difference between the highest high and lowest low of these bars.
Features Easily separate trends from the market noise The indicator is non-repainting. Returns CMI values through buffer. (see below)
Inputs Period: The number of periods
FREE
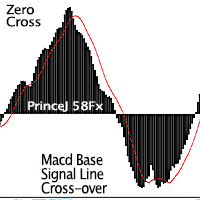
Purpose : Used as a tool for Traders and Investors This product is a Macd alert Indicator, which gives two (2) sets of Alerts: Main line and Macd Signal line cross over for early indications of retracements or trend change above or below. While the zero cross is the flipping over effect of the histogram to the opposite side of the zero line, which can be seen on the standard Macd Oscillator. Regular Arrows: Up and down arrows shows the cross over Of the Signal Line and Main Line from above for
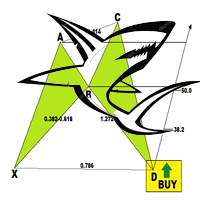
The Shark Pattern is dependent upon the powerful 88.6% retracement and the 113% Reciprocal Ratio, works extremely well retesting prior support/resistance points (0.886/1.13) as a strong counter-trend reaction. Represents a temporary extreme structure that seeks to capitalize on the extended nature of the Extreme Harmonic Impulse Wave. The indicator demands immediate change in price action character following pattern completion. Extreme Harmonic Impulse Wave utilized depends upon location of 88.6
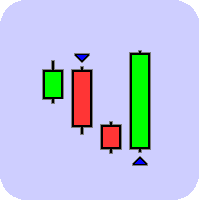
This indicator was created to spot potential reversals in the market. It will help you find the edge while trading which is required to be profitable. The indicator does what its good at, processing data objectively and presents you with the results once a new setup has been formed. It can send you a notification or email and such, so you are not required to follow the market every move. This, coupled with the edge it gives, give you the time and rest to take the appropriate action. The Engulfi
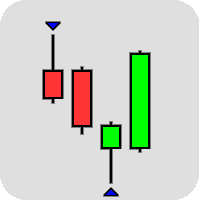
This indicator was created to spot potential reversals in the market. The Pinbar, or Pinnochio Bar, pattern is a a great candlestick pattern which can yield good trading results if traded properly. The idea behind this pattern is that price tries to trick us into thinking the wrong direction. When a Bullish Pinbar for example has formed, it tries to convince us price is going higher but in reality price is going down at the end of the bar. These patterns can be powerful reversal signals when use
Fractalicious shows Fractals of any length, higher or lower highs and lower of higher lows, the fractal channel and the breakout of the channel. Fractals are an important trend and price action pattern. Fractalicious can be used on any timeframe and symbol.
Settings Fractalicious default settings are good enough most of the time. Feel free to fine tune them to your needs. Show last fractal - Set to true to show fractals from the last completed bar. (This could move the fractal if the current ba
This is a pack which contains both the Engulfing Scanner as well as the Pinbar Scanner . The indicator comes with several sorts of alerts which makes it easy for a trader to wait for a pattern to be formed, have it signaled and then check the chart to see what the bigger story tells you.
Pinbar Scanner The Pinbar, or Pinnochio bar, pattern is a a great candlestick pattern which can yield good trading results if traded properly. The idea behind this pattern is that the price tries to trick us in
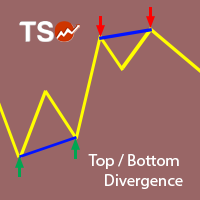
This indicator combines double bottom and double top reversal chart patterns together with RSI divergence detection.
Features Easily detect strong reversal signals Allows to use double top/bottom and RSI divergence signals combined or independently. Get email and/or push notification alerts when a signal is detected. Custom colors can be used The indicator is not repainting Can easily be used in an EA (see below)
Inputs ENABLE Double Top - Bottom: Enable the double top - bottom indicator ENABL
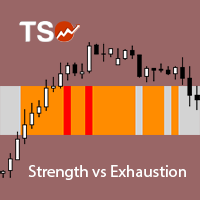
A visually-simplified version of the RSI. The Relative Strength Index (RSI) is a well known momentum oscillator that measures the speed and change of price movements, developed by J. Welles Wilder. Color-coded bars are used to quickly read the RSI value and history.
Features Find overbought and oversold situations at a glance. The indicator is non-repainting. The indicator can be easily used as part of an EA. (see below)
Basic Strategy Look for shorts when the indicator is overbought. Look for
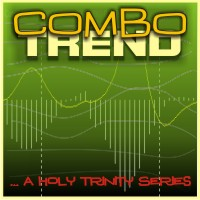
This Is An Oscillatory Indicator Which Has OnlyTwo Lines: Main Line - The calculation for this value is based upon the open, high, low and close prices of chosen input parameters (within the set periods.) Signal Line - The Calculation for the signal line is based on the addition (& multiplication) of several moving averages of the Father, Son & Holy Spirit Periods (all applied to the main line's value).
Input Parameters Please Note that by way of combination, each input parameter plays several

MA Crossover Arrows is a simple indicator that draws arrows and alerts when two moving averages crossover.
Supported types of moving averages Simple Exponential Smoothed Linear Weighted
Supported Price types Close Open High Low Median Price (HL/2) Typical (HLC/3) Weighted Close (HLCC/4) When the fast moving average crosses above the slow moving average, a green up arrow will appear on the chart. When the fast moving average crosses below the slow moving average, a red down arrow will appear on
FREE
または(BD%)は、ポイントではなくパーセントでボラティリティを測定するボラティリティ指数です。 BD%の考え方は、0から100パーセントの間で移動するClassic Standard Deviation(CSD)に応じてインデックスを作成することです。
BD%を使用して、異なる期間または異なる時間枠での同じ証券のボラティリティを比較できます。さらに、BD%を使用して、ポイントではなくパーセントで、さまざまな市場のさまざまな証券間のボラティリティを比較できます。
「BD%」の使い方
BD%が90%未満で、このレベルを上向きに超えた場合、これは価格がさまざまな領域で変動する可能性があることを示しています。 BD%が90%を上回り、その後このレベルを下向きに超え、価格がすでに単純移動平均を上回っている場合、これは新しい上昇トレンドの始まりの兆候です。 BD%がマイナス面に深くなるにつれて、ボラティリティとトレンドの強さが増しています。 BD%が0%の場合、これはボラティリティが最大値にあることを意味します。 BD%が90%を上回り、その後このレベルを下向きに超え、価格がすでに単純
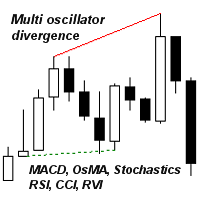
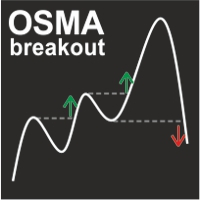
OSMA Breakout indicator displays signals formed at the time of overcoming the previous extremum of OSMA while simultaneously forming the extremum point on the price chart. If the extremum of the previous wave is punched, but the price remains in flat (in a narrow range), the signal is not displayed. This approach allows you to reduce the number of false signals in a long trend and the divergence of the indicator. The indicator works on any trading instrument and timeframe.
Parameters Fast EMA P
MACD Swing Low Multi Time Frame Indicator is one of the most advanced indicators based on both Swing Low and MACD trading strategies. It supports multiple timeframes, i.e. by attaching the indicator on a single chart, one can see the MACD Swing Low values for all the other timeframes on a single chart. One would just have to select the timeframes, for which he wants to see the calculated values.
Features On the chart, one can set the option to view the MACD Swing Low calculated values and the M

The indciator helps you find a broker with the best spread. This is a tool for monitoring a spread continuously on the chart. The tool records the spread value on each bar and re-draws the chart line in the bottom window. The best feature of the tool is that it recalculates the percentage and re-draws the bar chart of each spread value to identify the spread values that appear most during the monitoring period. In addition, the tool saves the diary into the csv file. Please watch the instruction

The indicator plays sound alerts when the price reaches certain levels, specified by trader. You only need to draw a trendline and then press the alert button in the panel. The texts of the notification you determine. Notification via a smartphone or email address is possible. Note for "Free Demo" : MetaTrader 4 does not support displaying an alert window or playing sounds in the strategy tester, only in live or demo accounts.
How it works Draw a trendline Click the "Alert" button (Trendline m

This indicator will show Buy (color Aqua) or Sell (color Magenta) arrow at the moment when a Long or a Short local trend (local to the current TimeFrame) is expected. The huge advantage is that the indicator does not have any input parameters. So, you will not waste your time and will not struggle to change them for different TimeFrames and currency pairs. This indicator is universal, but it will work better on H1 and lower TFs.
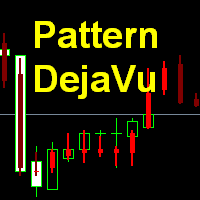
This indicator predicts the nearest candles of the chart based on the search of up to three best coincided patterns (a sequence of candles of a given length) in the history of the current instrument of the current timeframe. The found patterns are aligned with the current pattern at the opening price of the current (last) candle . The predicted candles are candles following immediately for patterns found in history. Pattern search is performed once every time a new candle of the current tim
ADR ST patterns is a modification of the classical ADR indicator. This simple indicator corresponds to the parameters specified in the ST patterns Strategy ( https://stpatterns.com/ ). Structural Target patterns are the market itself, which is consistently divided into components. For the formation of ST patterns , no trend lines, geometric proportions of the model itself, trading volume, or open market interest are needed. They are easily recognized and built only on the basis of breaking thr
FREE

Fractals ST Patterns is a modification of Bill Williams' Fractals indicator. Unlike a standard Fractals indicator, Fractals ST Patterns allows setting any number of bars to find a fractal. This simple indicator corresponds to the parameters specified in the ST Patterns Strategy ( https://stpatterns.com/ ) . Structural Target patterns are the market itself, which is consistently divided into components. For the formation of ST Patterns , no trend lines, geometric proportions of the model itself,
FREE
This indicator works on the binary options It uses stochastic strategy to indicate the upcoming trend of the market This indicator helps traders to place a trade with the prediction involved on the stochastic strategy. This indicator makes use of the symbols to indicate the prediction regarding the order.
Symbols The upward symbol predicts the trend going up, so that traders can place trades accordingly. The downward symbol predicts the trend going down, so that the trader can place trades acc

This indicator displays the ZigZag Pointer Fibonacci Expansion Triangle movements timeframes only M1-W1.
Parameters InDepth: Displays the Depth movements. InDeviation: Displays the Deviation movements. InBackstep: Displays the Backstep movements. Fibonacci Expansion: Displays the Fibonacci Expansion movements. Fibonacci Expansion true.(false) Triangle: Displays the Triangle movements. Triangle true.(false) How to understand the status: If the Triangle is green, trend is up. If the Triangle is r

MACD BBands is a trading system based on MACD and Bollinger Bands placed in a single window. The indicator shows moving average slope angle (trend) change, compares their ratio (convergence/divergence) and allows sorting out signals using Bollinger Bands. The indicators are calibrated in such a way that the middle Bollinger Bands line is the zero level of the MACD indicator.
Parameters
Period - Bollinger Bands period; Deviations - number of standard deviations; Shift - shift relative to price;

The indicator shows the levels of the past week and day. In addition, it draws a level in percentage. This level is specified relative to the difference between the High and Low of the past month and week. For the daily levels of the past day, the Close levels are additionally displayed. All you need to do is configure the display parameters of the levels to your liking.
Parameters Over the past months installations - settings for the last months;
PasteMonthsLines - the level display mode is on

This indicator displays in a separate window the difference between the number of points which increased the price, and the number of points that decreased the price during the time interval specified in the settings. The time interval for calculation is expressed as the number of bars of the chart the indicator is attached to. This approach allows you to evaluate the movement direction (growth or fall) of the instrument's price, the strength of the movement and the size of the movement in point

THE ONLY CURRENCY STRENGTH INDICATOR BUILT ON PRICE ACTION
Most currency strength meters average an oscillator, or measure how far price has travelled. But these are not accurate measures of trend, Currency Strength Matrix measures trend strength, not just if a currency price has gone up or down. Currency Strength Matrix reads market structure . For each of the 28 major pairs it finds the confirmed cycle highs and lows, and decides whether that pair is in an uptrend, a downtrend, or neither. A

Shark Surfer is a new generation indicator applying a well-established trend-following trading. The product is good both for scalping, as well as medium- and long-term trading. Shark Surfer analyzes a selected symbol and shows the recommended market entry, take profit and stop loss levels. Shark Surfer trades on all symbols and timeframes. It also features email and push notifications concerning the new trading signals. The indicator searches for suitable market entry points on an already formed

This is professional fractals indicator able to work "on several screens" while on a single chart. The product has been developed for scalpers and those relying on "accurate" entries. The indicator shows fractals from six timeframes and displays the distance between the price and a new emerging fractal on lower timeframes showing the price behavior more clearly and making its analysis more accurate on reversal points. The indicator displays fractals from the D1, H4, H1, M15, M5 and M1 timeframes
Pivots Points are significant levels traders can use to determine directional movement, support and resistance. Pivot Points use the prior period's high, low and close to formulate future support and resistance. In this regard, Pivot Points are predictive and leading indicators. Pivot Points were originally used by floor traders to set key levels. Floor traders are the original day traders. They deal in a very fast moving environment with a short-term focus. At the beginning of the trading day,

Market Statistic Dashboard is an interesting tool for statistic analysis. This indicator scans the market and returns very accurate statistical analysis. The analysis is based on historical data. For example: it analyzes monthly chart and compares all the monthly charts in the past. The statistical analysis is run also on other TFs: weekly and daily ones. It is necessary to wait for the confluence of all timeframes to have a higher statistical certainty for the trading signal. Note: refresh your

The Super Cross Trend indicator is designed for trend and signal trading. This indicator generates trend signals. It uses many algorithms and indicators to generate this signal. It tries to generate a signal from the points with the highest trend potential. This indicator is a complete trading product. This indicator does not need any additional indicators. You can only trade with this indicator. The generated signals are displayed on the graphical screen. Thanks to the alert features you can ge

The OHLC indicator shows the current and historical values of High, Low, Open, Close and Mid for a specific time period. It can plot the current values or the values from the previous session. The indicator's range can be calculated from a daily, weekly, monthly, or user-specified session.
Levels High of the current or previous session. Low of the current or previous session. Open of current or previous session. Close of the current or previous session. Midpoint of the current or prev
FREE

The I Return Signal indicator is a product designed for signal trading. This indicator works by using a number of factors such as a set of indicators, recent history data, bar combinations, price movements, custom filtering system and various algorithms. It uses all of these factors at the same time and generates turn signals. The signals are generated by calculating from the highest possible points of the signal. This indicator is easy to use and understandable. Thanks to the warning features,

Features It is a demo version of All inOne indicator It works only on EURUSD, but the full version works on all currency pairs. All in One indicator is a simple indicator, it makes you know about 8 indicators in all timeframes simultaneously at a single glance. Stochastic RSI Moving Average (MA) Parabolic SAR ADX MACD CCI Last Candle (Candle) In all timeframes (M1, M5, M15, M30, H1, H4, D1, MN) at the same time.
Parameters Stochastic: PercentK : Period of the %K line. PercentD : Period of the %
FREE

Every indicator has its advantages and disadvantages. Trending ones show good signals during a trend, but lag during a flat. Flat ones thrive in the flat, but die off as soon as a trend comes. All this would not be a problem, if it was easy to predict when a flat changes to a trend and when a trend changes to a flat, but in practice it is an extremely serious task. What if you develop such an algorithm, which could eliminate an indicator's flaws and enhance its strengths? What if such an algori
This powerful indicator intercepts 21 patterns simultaneously on 28 Pairs and on all timeframes. Just put the indicator on a single chart to see all patterns that appear on all pairs in all timeframes The patterns found are: For Bearish: Bearish Abandoned Baby; Bearish Engulfing; Bearish Harami; Bear Kicker; Dark Cloud Cover; Evening Doji Star; Evening Star; Shooting Star; Three Black Crows; Three Inside Down; Three Outside Down; For Bullish: Bullish Abandoned Baby; Bullish Engulfing; Bullish Ha
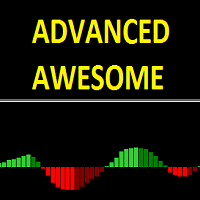
Advanced awesome indicator is a modified and advanced version of the standard awesome oscillator. With this indicator you can now make adjustments that you can not do on the awesome indicator. You can change and edit this indicator to suit your strategy. You can easily use it to recognize large and small trends.
Features The period can be set to define larger and smaller trends with the fast and period slow feature. You can change the input mode with the price mode. You can use Simple, Exponent

Front running is a high frequency trading method of placing orders before large orders available in market book. This increases your chances to hit small take profit and eliminate stop loss behind the large order. This technique is highly profitable in comparison to most others, and is often considered to be illegal, if used by agents to make a profit at the expense of the client. Unfortunately, Forex does not provide the order 0book. Nevertheless, large orders influence price action in a simila
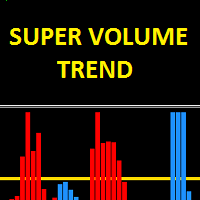
The Super Volume Trend indicator uses a set of algorithms and indicators. The purpose of this indicator is to find healthy trends with specific volume movements. It uses some filtering systems to find these trends. The indicator is easy to use, simple and understandable. This is a standalone trend indicator which does not need additional indicators. Users can apply it together with other indicators that are appropriate to their strategy.
Suggestions and working style The period settings have be

Buy Market Scanner is a ready-made trading system, which shows the moments when it is necessary to open or close deals. Buy arrows appear on the zero bar without delay and redrawing. The same applies to signals for closing orders. They appear on the zero bar and are not redrawn. The number of profit or loss in points for a certain time period is displayed in the top right corner of the indicator. The indicator works best on the EURUSD currency pair with the H1 timeframe.
Operation Principles In
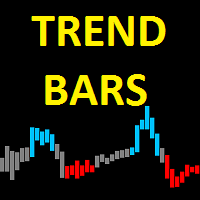
Trend Bars indicator is a trend indicator working with a set of algorithms and a set of indicators. Trend finds trends by using many factors while you are there. This indicator has 4 mode features. Mode 1 represents short-term trends. Mode 2 represents medium to short term trends. Mode 3 represents medium to long term trends. Mode 4 represents long term trends. Easy to use and simple indicator. The user can easily understand the trends. This indicator has 3 trend features. Up trend, down trend a
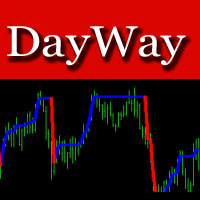
The DayWay indicator shows the current trend direction on the chart as a colored line. The best timeframes for operation are M5 and higher. Works on all currency pairs. Suitable for any scalping strategies. Quite easy to use.
Recommendations on usage When a blue line appears, wait for a candle to close and open a buy order. When a red line appears, wait for the current candle to close and open a sell order.
Parameters Periods - period of the indicator.
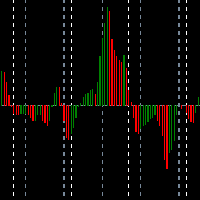
This indicator displays in a separate window the difference between the number of ticks which increased the price, and the number of ticks that decreased the price. This approach allows you to evaluate the movement direction (growth or fall) of the instrument's price and the strength of the movement. Set the time interval for calculation, expressed in the number of bars. The in real time uses only the ticks that arrive in real time, the history data are not analyzed.
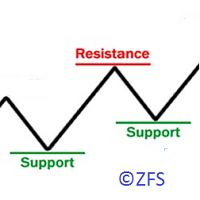
The indicator displays the resistance/support levels based on the history data of price action. It requires a depth of history to calculate the levels. The tool has been developed using an original proprietary technique. The resistance and support levels indicate the accumulations of orders.
Indicator Parameters Start Data/Time - initial date/time of the history data for calculation of levels Width of Lines Resistance/Support in Points - thickness (density) of lines in points, it is recommended
This StrongCurrency is a complete trading system based on a variety of technical indicators, moving averages and pivots. Each of those elements can be assessed in defined rules and coefficients (depending on the indicator) providing limitless optimization scenarios for the StrongCurrency. In order to work the StrongCurrency creates a trend strength and entry point signal list display by evaluating these data, that takes data from all symbols. It extrapolates all the information in order to get t
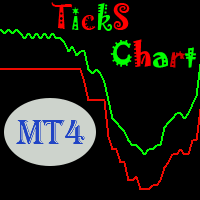
Ticks Line Chart is a professional indicator for the MetaTrader 4 platform. This indicator allows displaying a tick chart in a separate window, so that you can see price changes inside bars. Note that the Strategy Tester of the MetaTrader 4 trading platform only shows the static spread, that is why in in the tester the distance between the ASK and Bid prices will always be the same.
Indicator Benefits Perfect for scalping. A unique indicator, there are no free analogues. Using the flexible indi

This indicator is constantly calculating the probability of a trend. The result of those calculations is shown in the upper left corner of the chart. It is shown in a green color text if the trend is expecting to go Up, in a red text if the trend is expending to go Down, and in a white text if "no trend" is calculated. It can show cross lines in color of your choice or you can delete those cross lines by setting Cross color to "None". This indicator can show a radar vector in color of your choic
The WWCS Trade Information Indicator is designed to assist you with money management and provide you with important information about a currency pair both before taking a trade and after your trade is in progress. The trade information (such as recommended lot size for a desired percentage of your account equity, the amount of money at risk, etc.) takes quite a bit of time and knowledge to calculate and, because of the speed at which prices change, is out of date as soon as you've calculated it.

This simple indicator takes information from Ichimoku Kinko Hyo to establish strong and weak currencies to pair together for ideal trending situations. It also generates buy or sell signals based on the standard deviation of returns together with currency strength. A currency is said to be strong or weak depending on where the price is in relation to two factors: if the price is above the daily kumo and above the 26 day Kijun-sen, it is said to be strong. Likewise, when trading below the daily k
FREE

The Retracement indicator shows the current and historical high, low and mid values. Optionally, it can also display major retracement levels. All these levels together form the significant levels of support and resistance. Therefore, it is essential to know them for every kind of trader.
Levels High Low Midpoint 76,4 % 61,8 % 38,2 % 23,6 %
Main features The indicator shows the actual levels of High, Low, Mid and selected retracements. Four optional retracement levels. Alert notifications
FREE

MASi Three Screens is based on the trading strategy by Dr. Alexander Elder. This indicator is a collection of algorithms. Algorithms are based on the analysis of charts of several timeframes. You can apply any of the provided algorithms.
List of versions of algorithms:
ThreeScreens v1.0 - A simple implementation, with analysis of the MACD line; ThreeScreens v1.1 - A simple implementation, with analysis of the MACD histogram; ThreeScreens v1.2 - Combines the first two algorithms in
FREE

This indicator lets you easily mark the daily open levels on a chart with several possibilities of customization. For many trading strategies, the daily open level is an important level to base trading decisions on. That is why I chose to create this indicator that is designed to assist you with trading these strategies, as well as further optimizing them and getting a general understanding of the markets movements. With this tools help, you can easily take a look at the previous price action ar
FREE

Adaptive MA is a simple modification of the moving averages (MAs) that allows displaying an average value line based on multiple MAs on the chart. The parameters allow you to set any number of MA periods. The number of parameters is equal to the number of moving averages applied in calculation.
At first, it may seem that nothing new has been invented and there is no sense in this approach. However, this impression is deceptive. As we know, the trends have different duration. Have you ever tried
FREE

This indicator studies the price action as a combination of micro-trends. All micro-trends are analyzed and averaged. Price movement is filtered based on this averaging. IP_High and IP_Low (blue and red dashed lines) show the instantaneous price movement. They display the forecast only for the current price values, taking into account only the number of bars defined by the 'Filter level' parameter. SP_High and SP_Low (blue and red solid lines) smooth the price movements with respect to history.
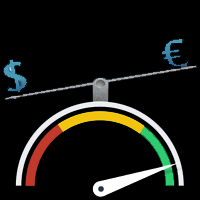
Strongest and Weakest Currency Analysis This product shows the strength of the main currencies in FOREX based on average pip gain/loss in different time-frames! Depending on the strength of the currency, the indicator colors changes from blue to red also the orders may also be changed, allowing you to find the strongest and weakest currency at a glance!
Advantages Whatever your trading method and strategy are, it is always important to choose the correct pairs, so this indicator will help you a

The Tick Vision indicator is a convenient tool for manual scalping. The indicator plots a tick chart in real time in a separate window. It is also possible to plot 2 additional ЕМА's of the price. Period for the ЕМА is the number of ticks. The indicator does not overload the system. You set the number of ticks to be displayed by the indicator. For even greater visual control, a grid with adjustable step is set, similar to the main chart. There are also period separators (1 minute) to control the
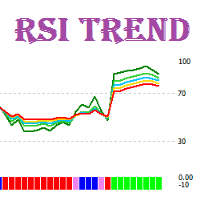
RSI Trend is a trend indicator that interprets the current market situation based on multiple RSI indicators with different periods.
Indicator Benefits Displays zones of an evident trend movement, overbought/oversold zones, as well as transition zones; Can be used in scalping strategies, as well as medium-term and long-term strategies; Has a minimum of settings; The standard line colors and selected for a comfortable operation with the black and white styles of the chart; Can be used in Expert
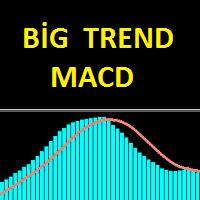
The Big Trend MACD indicator is an advanced model of the standard MACD indicator. It is very easy and simple to use. The main purpose of the indicator is to find great trends. With this indicator you can easily detect in small trends. This indicator can be used as two different trend finding tools for big trends and small trends. Try to use the big trends suggested, or with other suitable chart-appropriate indications.
Features and Trends This indicator has period, signal, period color, signal

The indicator is designed for binary options. It produces a sound alert, after which you should instantly enter the market. The indicator operates based on signals form RSI and CCI, as well as support and resistance levels. When the chart is in overbought and oversold zones, the indicator finds a level in this zone and notifies you using a sound and a message.
Indicator Parameters dist - the number of points to generate a signal. Suitable values are from 21 to 50. Filtr_SMA - the filter, used

The RSI.MACD Warden is a powerful indicator for MetaTrader 4 that uses a versatile algorithm to identify RSI, MACD, and Stochastic divergences. This indicator is designed to look back at a set number of bars and draw lines when a normal or hidden divergence is identified. The smaller the lookback period, the faster the indicator will be. The indicator can identify both normal and hidden divergences and is more accurate in identifying normal divergences. We've conducted a great number of tests t
このマルチシンボルおよびマルチタイムフレームインジケーターは、次のローソク足パターンをスキャンします(パターンの説明についてはスクリーンショットを参照してください)。 3人の白人兵士(逆転>継続パターン) 3つの黒いカラス(反転>継続パターン) 強気と弱気のスリーラインストライク(反転パターン) インジケーター設定の厳密なオプションが有効になっている場合、パターンはより高い時間枠ではあまり頻繁に表示されません。しかし、そうする場合、それは非常に確率の高い設定です。 Thomas Bulkowski(国際的に有名な作家であり、ローソク足パターンの第一人者)によると、3ラインストライクはローソク足パターンの中で最高の全体的なパフォーマンスランクを持っています。このインジケーターを独自のルールや手法と組み合わせると、独自の強力なシステムを作成(または強化)できます。 特徴 マーケットウォッチウィンドウに表示されているすべてのシンボルを同時に監視できます。インジケーターを1つのチャートに適用し、市場全体を即座に監視します。 M1からMNまでのすべての時間枠を監視でき、パターンが識別されたときに
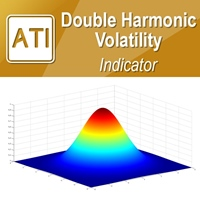
Introduction to Double Harmonic Volatility Indicator Use of the Fibonacci analysis for financial trading can nearly go back to 85 years from today since the birth of Elliott Wave Theory by R. N. Elliott. Until now, traders use the Fibonacci analysis to identify the patterns in the price series. Yet, we could not find any one attempted to use Fibonacci analysis for the Volatility. Harmonic Volatility Indicator was the first technical analysis applying the Fibonacci analysis to the financial Volat
MetaTraderマーケットは、履歴データを使ったテストと最適化のための無料のデモ自動売買ロボットをダウンロードできる唯一のストアです。
アプリ概要と他のカスタマーからのレビューをご覧になり、ターミナルにダウンロードし、購入する前に自動売買ロボットをテストしてください。完全に無料でアプリをテストできるのはMetaTraderマーケットだけです。

取引の機会を逃しています。
- 無料取引アプリ
- 8千を超えるシグナルをコピー
- 金融ニュースで金融マーケットを探索