SecondsOfMinute
- Indicatori
- Versione: 1.0

E' il più semplice indicatore esistente.
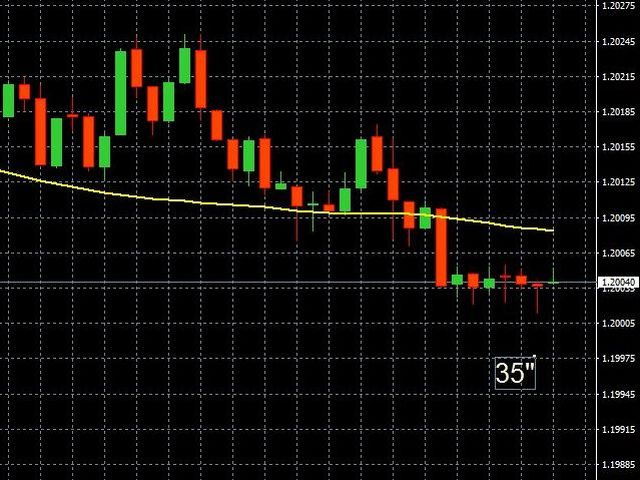
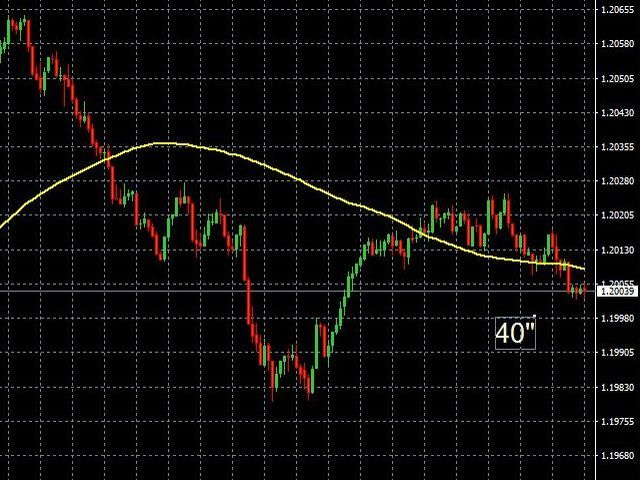
Ha un'unica funzione: segnalare i secondi trascorsi dall'ultimo minuto in modo molto comodo, con un'etichetta spostabile nel grafico, in modo da evitare al trader di allontanare l'occhio dalla candela in formazione.
Si usa su M1, ma anche su intervalli maggiori, per chi è interessato ad aprire/chiudere posiz nel momento migliore.
Talvolta un movimento intenso negli ultimi 10" del minuto dà indicazioni sull'andamento futuro, ed è utilizzabile per scalping.
Spesso il movimento che si verifica nei primi 15" non ha nessun valore predittivo. Con questa etichetta possiamo evitare di essere ingannati da questo comportamento.
Consigliato agli scalper, ma utile anche per chi vuole cogliere il momento migliore per agire.