Infinity Indicator
- Indicatori
- Versione: 3.3
- Aggiornato: 29 agosto 2023
- Attivazioni: 20

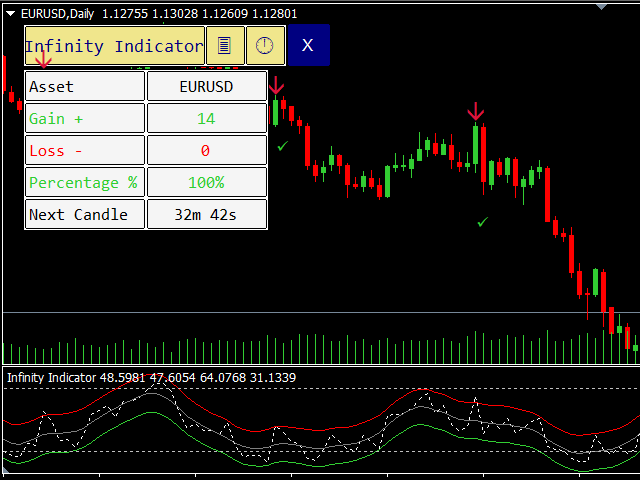
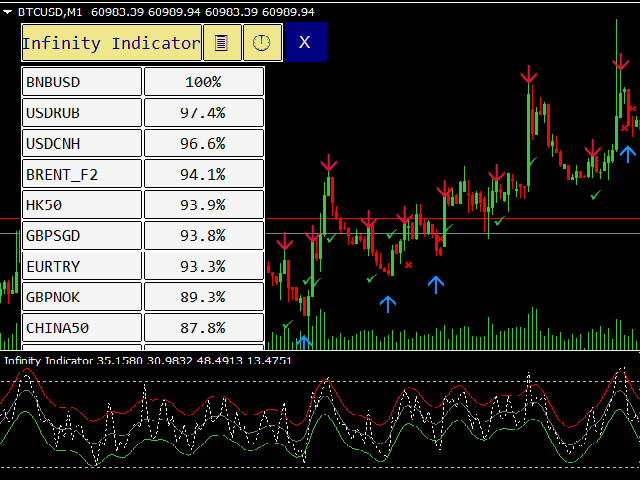
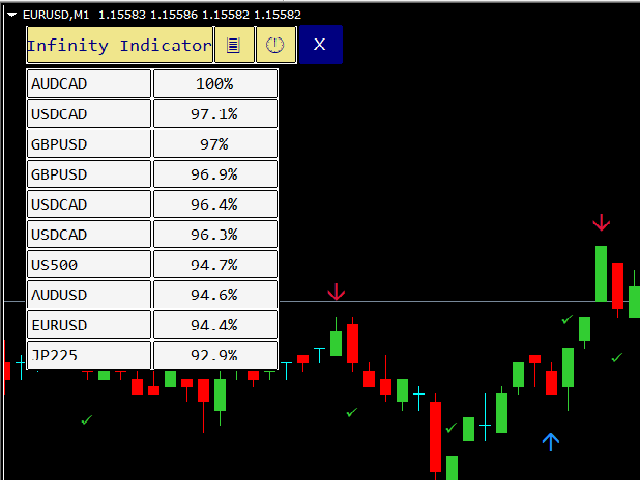
Infinity Indicator MT4 3.3
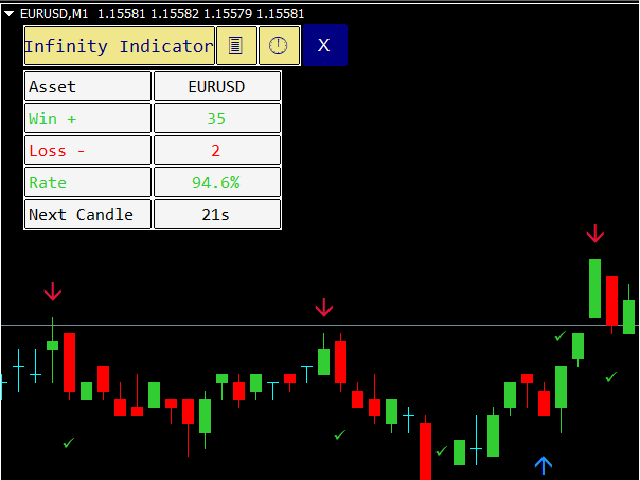
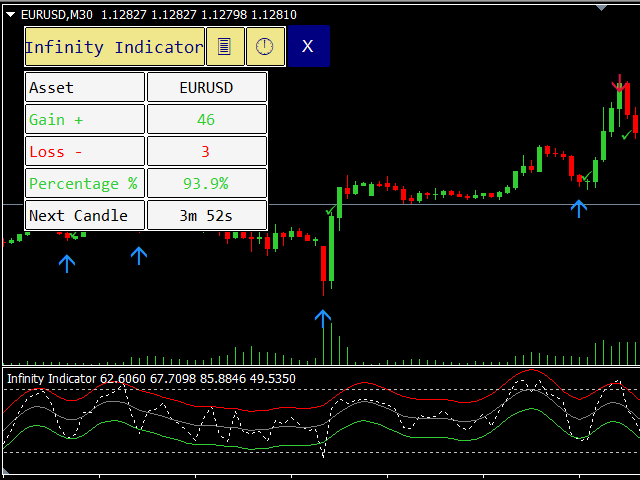
- Panel Win Rate based on CandleMT4
- Exit Button
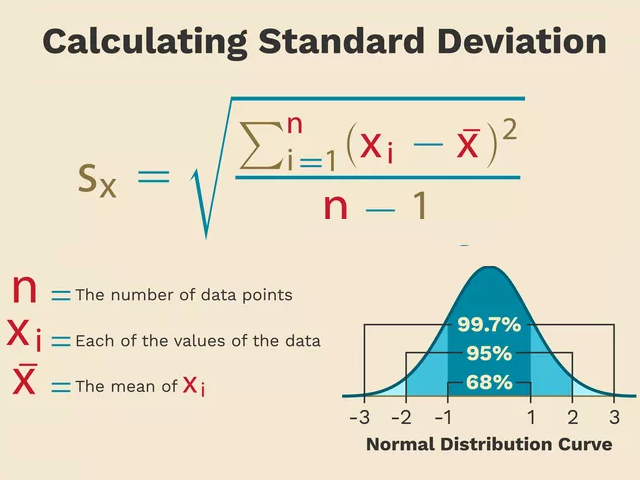
- Calculates the StdDev standard deviation indicator on the RSI data, stored in the matrix similar to the keltner.
- input int HourCalculate = 12;
- RsiLength = 5;
- RsiPrice = PRICE_CLOSE;
- HalfLength = 4;
- DevPeriod = 100;
- Deviations = 0.9;
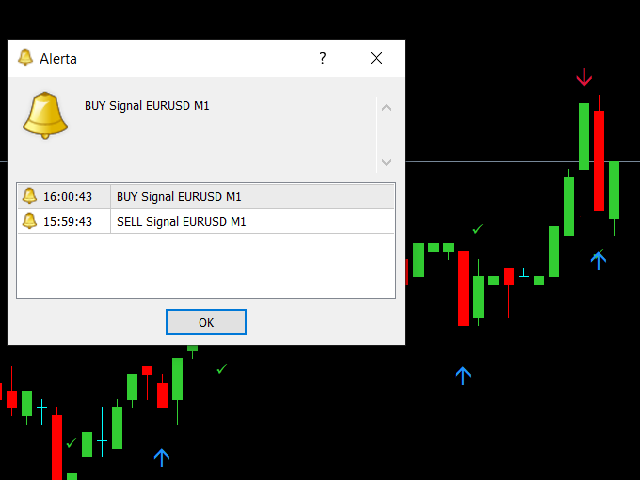
- UseAlert = true;
- DrawArrows = true;
- TimerWork=300;
- LevelUp = 80;
- LevelDown = 20;
- MoreSignals = true;