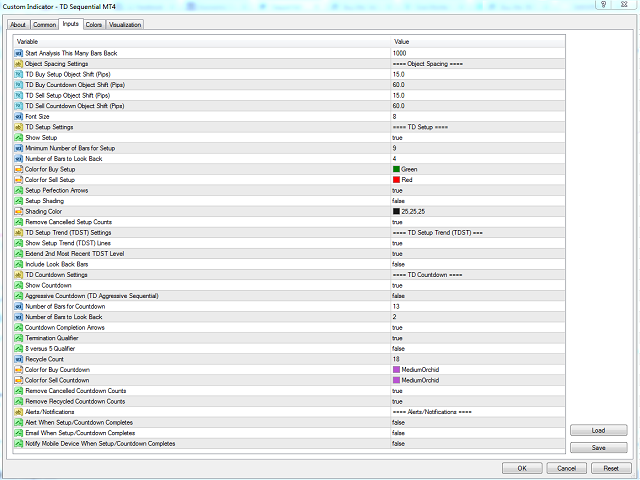
TD Sequential Metatrader 5
- Indicatori
- Versione: 1.2
- Attivazioni: 20

TD Sequential indicator consist of two components. TD Setup is the first one and it is a prerequisite for the TD Countdown – the second component.
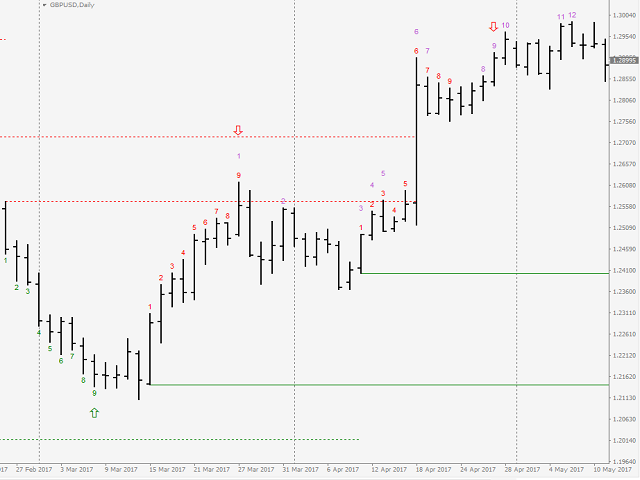
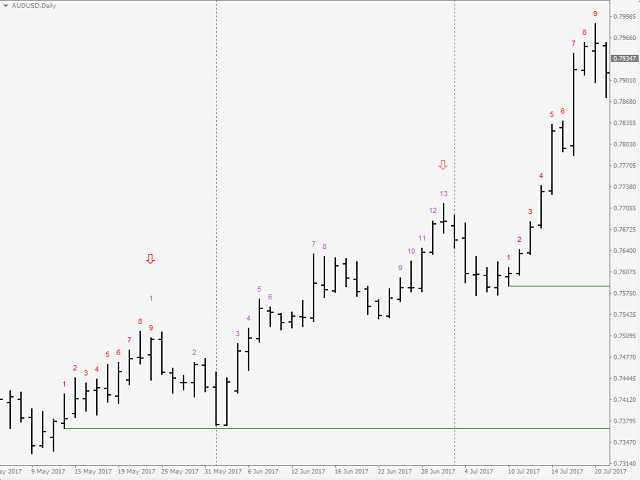
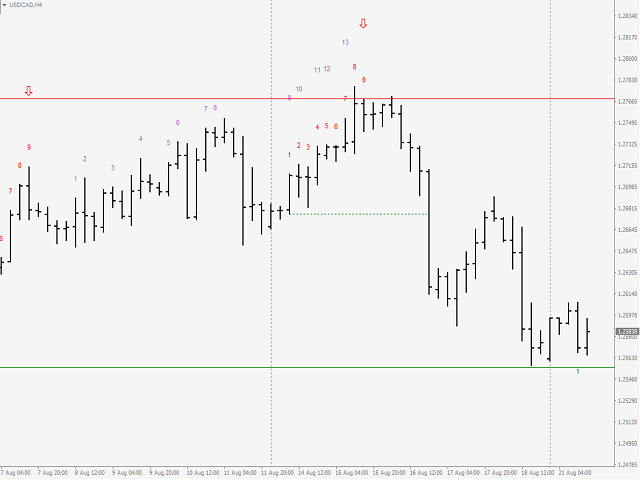
TD Setup
TD Setup compares the current close with the corresponding close four bars earlier. There must be nine consecutive closes higher/lower than the close four bars earlier.
1- TD Buy Setup
- Prerequisite is a bearish price flip, which indicates a switch from positive to negative momentum.
– After a bearish price flip, there must be nine consecutive closes, each one less than the corresponding close four bars earlier.
– Cancellation - If at any point a bar closes higher than the close four bars earlier the setup is canceled and we are waiting for another price flip
- Setup perfection – the low of bars 8 or 9 should be lower than the low of bar 6 and bar 7 (if not satisfied expect new low/retest of the low).
**TD Sell setup is the opposite of the above.
TD Countdown
After a setup is finished the countdown can begin from bar 9 of the setup.TD Countdown compares the current close with the low/high two bars earlier and you count 13 bars. Unlike the Setup, the Countdown doesn’t have to be a sequence of 13 consecutive price bars. If it is interrupted you just do not count the bars and when it resumes you continue counting further.
1- TD Buy Countdown
Starts after the finish of a buy setup. The close of bar 9 should be less than the low two bars earlier. If satisfied bar 9 of the setup becomes bar 1 of the countdown. If the condition is not met than bar 1 of the countdown is postponed until the conditions is satisfied and you continue to count until there are a total of thirteen closes, each one less than, or equal to, the low two bars earlier.
- Countdown qualifier
- The low of Countdown bar thirteen must be less than, or equal to, the close of Countdown bar eight.
- Countdown cancellation
- A sell Setup appears. The price has rallied in the opposite direction and the market dynamic has changed.
- Close above the highest high for the current buy Setup (break of TDST for the current Setup)
- Recycle occurs ( new Setup in the same direction and recycle activated
**TD Sell Countdown is the opposite of the above.
For TD Combo MT5 ; please visit ► https://www.mql5.com/en/market/product/59017
For My Other Products; please visit ► https://www.mql5.com/en/users/samil34/seller