ReboltP
- Indicatori
- Versione: 1.0
- Attivazioni: 7
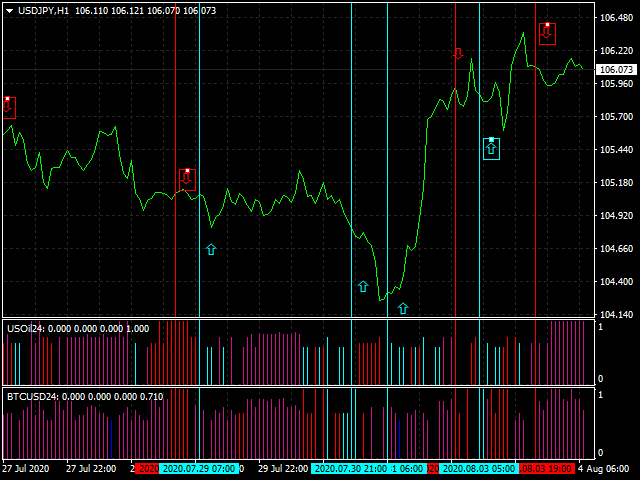
Rebalance Overlay Technology (Rebolt) enables the trader to visualize the flow of money from one chart to another chart.
Rebolt Probability indicates the probability that money has flowed from one chart to another chart for a specified length of time over a number of intervals specified by the user.
When Rebolt reads Cyan or Blue these are buying signs good for the length of time specified by the user or until a conflicting signal arises.
When Rebolt reads Violet or Red there are selling signs good for the length of time specified by the user or until a conflicting signal arises.
Rebolt is also published as an estimate of price change (Rebolt Delta), an estimated dollar value per expected price change(Rebolt Delta$) and as an overlay where the expected change is added or subtracted to the chart to express the future expected price (Rebolt Overlay).