UstechIndexSniper
- Experts
-
Pravin Awari
 # About Algotraders24 AI
## Transforming Trading Through Artificial Intelligence - Versione: 1.3
- Attivazioni: 5
USTECH Index Sniper trades trend continuation on the US Tech 100 index with ONE precise pending order at a time.
HOW IT WORKS
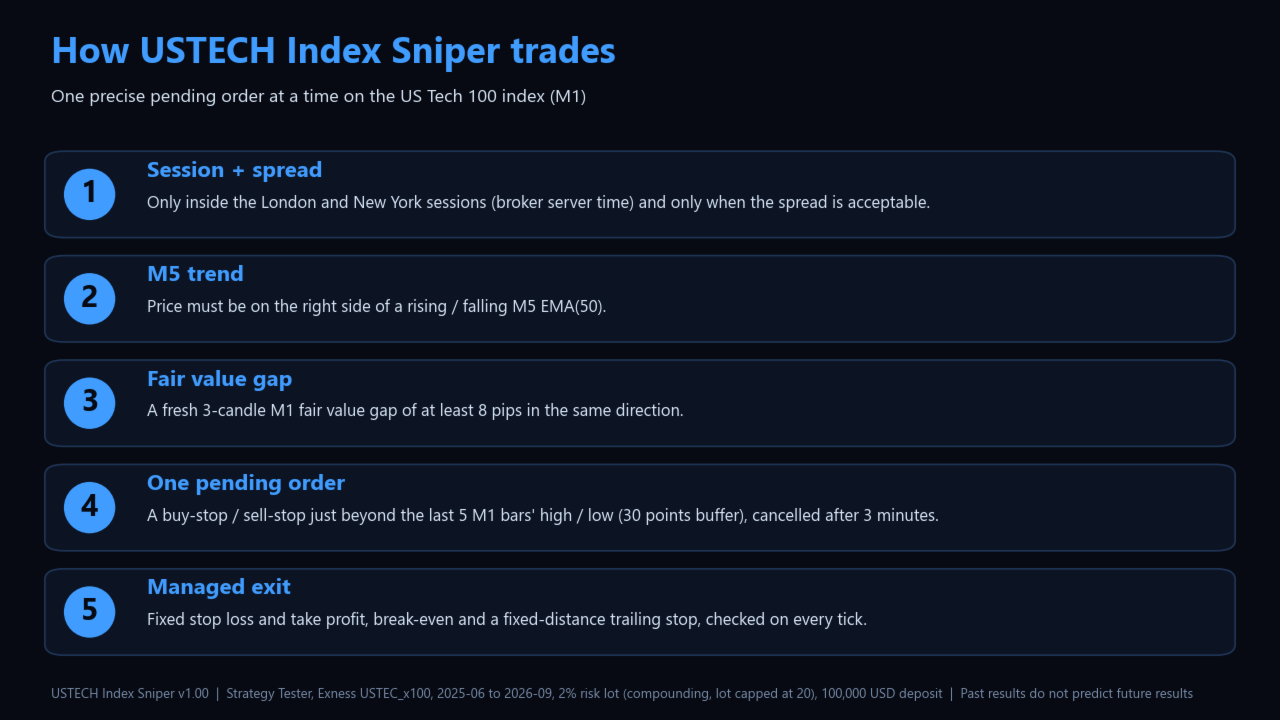
After every closed M1 bar the EA looks for two things at once: an M5 EMA(50) trend (price on the right side of a rising or falling EMA) and a fresh 3-candle fair value gap of at least 8 pips in the same direction. When both agree it places a single buy-stop or sell-stop just beyond the high/low of the last 5 M1 bars (30 points buffer), with a fixed stop loss and take profit, and cancels the order if it is not triggered within 3 minutes. There is never more than one position or pending order, with a 30-second cooldown between orders. Open trades are managed on every tick: once a trade is 100 points (1.00 index point) in profit the stop moves to break-even + 20 points and a fixed trailing stop 10 pips (0.10 index point) behind the price follows it, so most trades close within a few minutes. It only trades inside the London and New York sessions and only when the spread is acceptable. Optional filters (CVD pressure proxy, entropy/volatility regime, tick order-flow) are included and switched OFF by default, exactly as in the tested run.
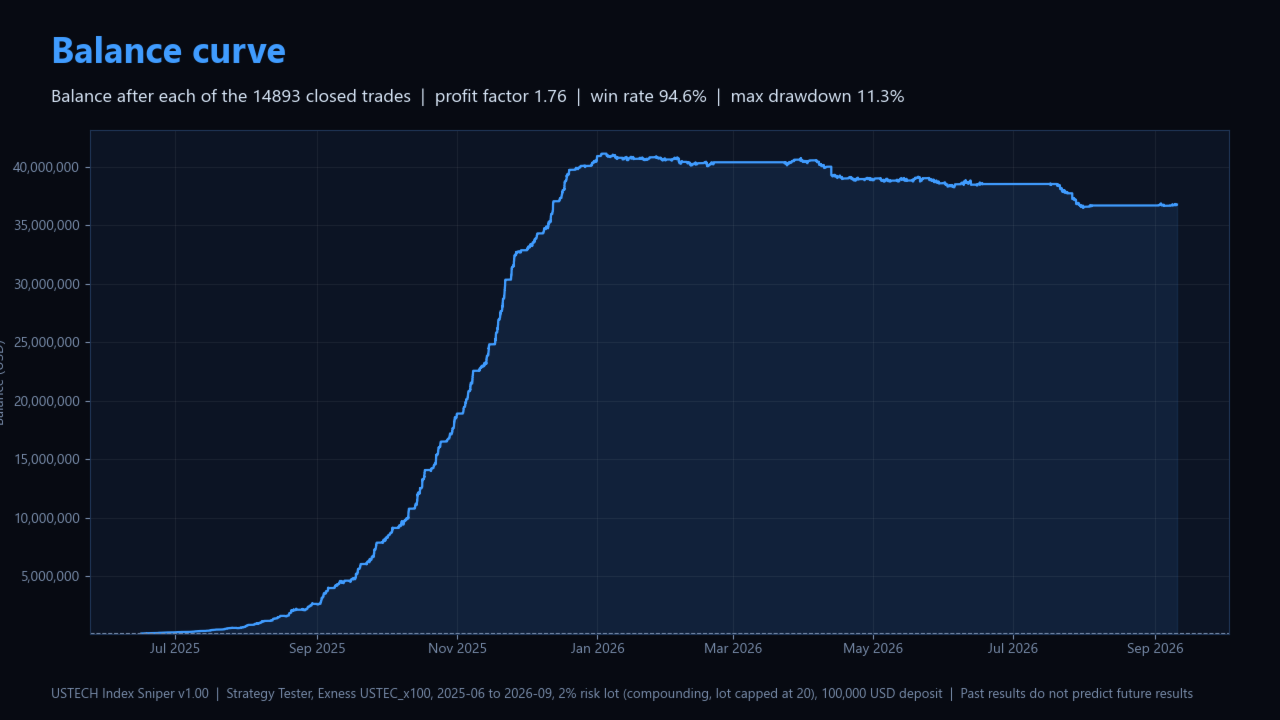
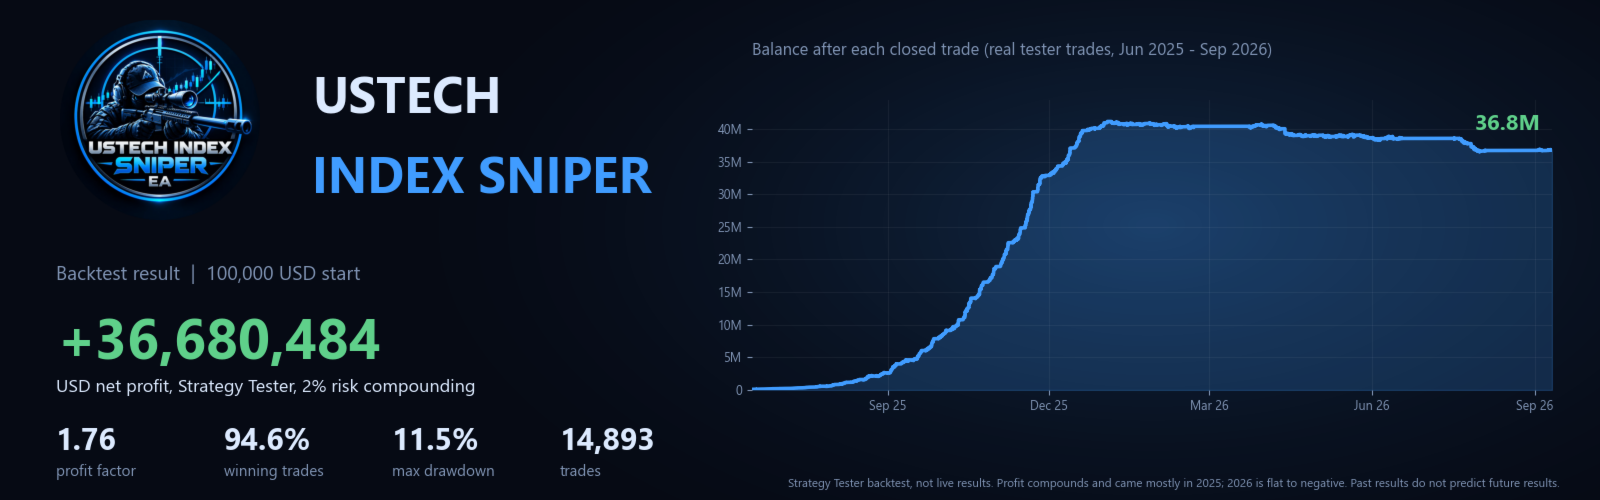
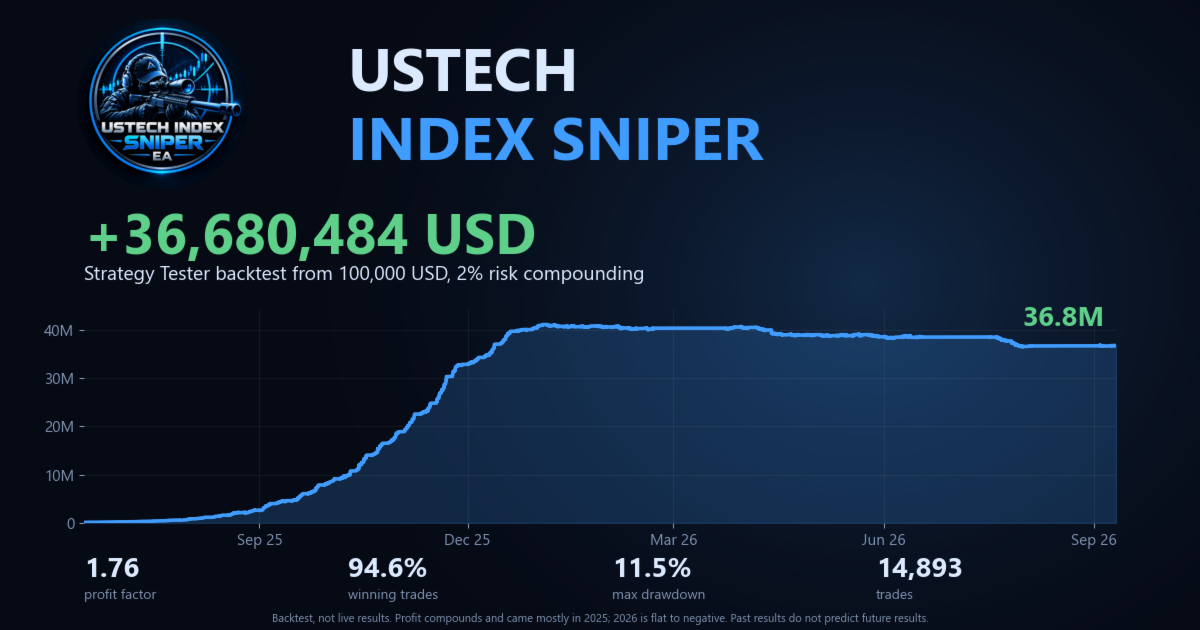
BACKTEST RESULTS (Strategy Tester, Exness symbol USTEC_x100, M1, first trade 2025-06-16, last trade 2026-09-10, 14,893 trades, 100,000 USD deposit, risk-based lot 2% per trade)
- Net profit 36,680,484: the lot grows with the balance, so profit compounds (the lot grew from 0.4 to the symbol's 20-lot maximum). Profit factor 1.76, win rate 94.6% of trades net winners (97.4% before commission), average trade +2,463.
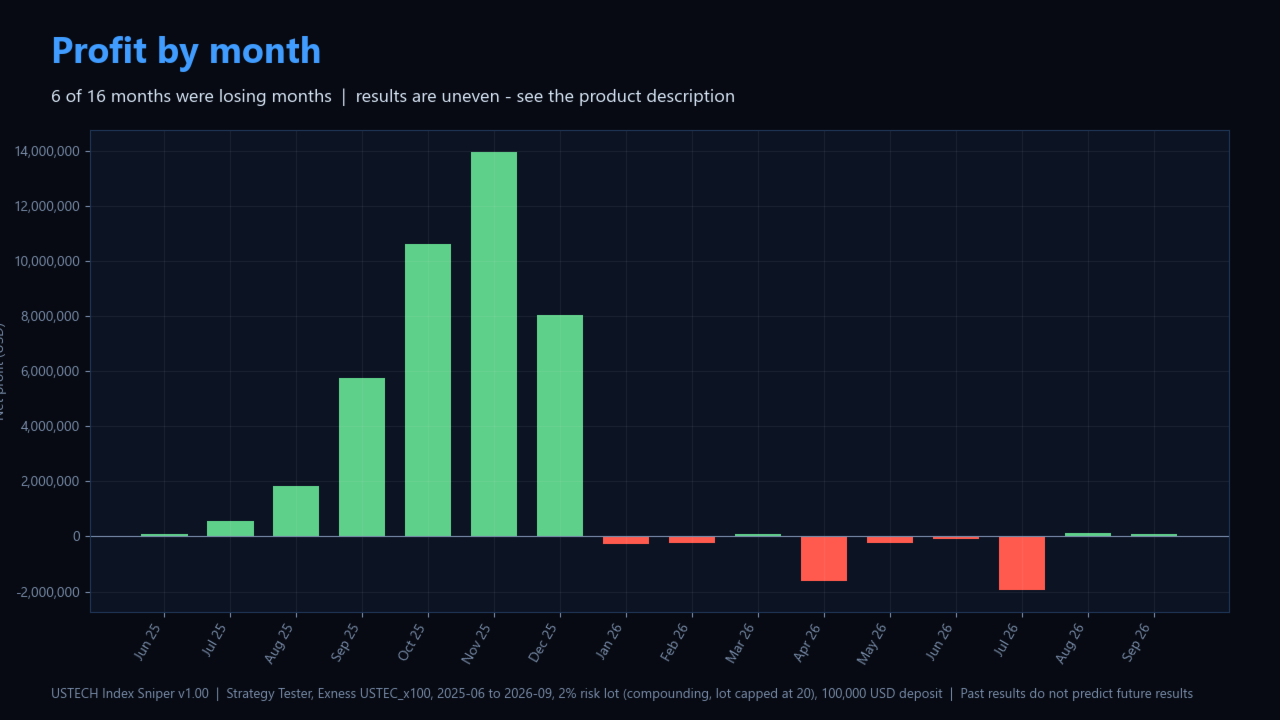
- The profit came in June-December 2025 (+40.8 million). January-September 2026 was NEGATIVE (-4.1 million) with 6 losing months out of 9. Recent behaviour of the tested settings is weaker than the headline.
- Loss shape: the average losing trade (about -41,275) was about 8 times the average winner (+4,969); the largest single loss was about 731,000. The longest winning streak was 200 trades and the longest losing streak 3.
- Maximum drawdown 11.28% on closed trades and 11.46% on a rebuilt intraday equity curve (real 15-minute candles); the longest drawdown lasted about 250 days and equity has not recovered its late-2025 peak. The tester report also prints a 100% equity drawdown which could not be reproduced or explained. A 15-minute curve cannot see swings inside a trade shorter than one bar, so real intratrade drawdown can be larger.
- Only 43% of the test ticks were real ticks; commission is visible in the deals, the spread model is unknown. This is a backtest, not live trading: no live results are claimed.
READ BEFORE USING
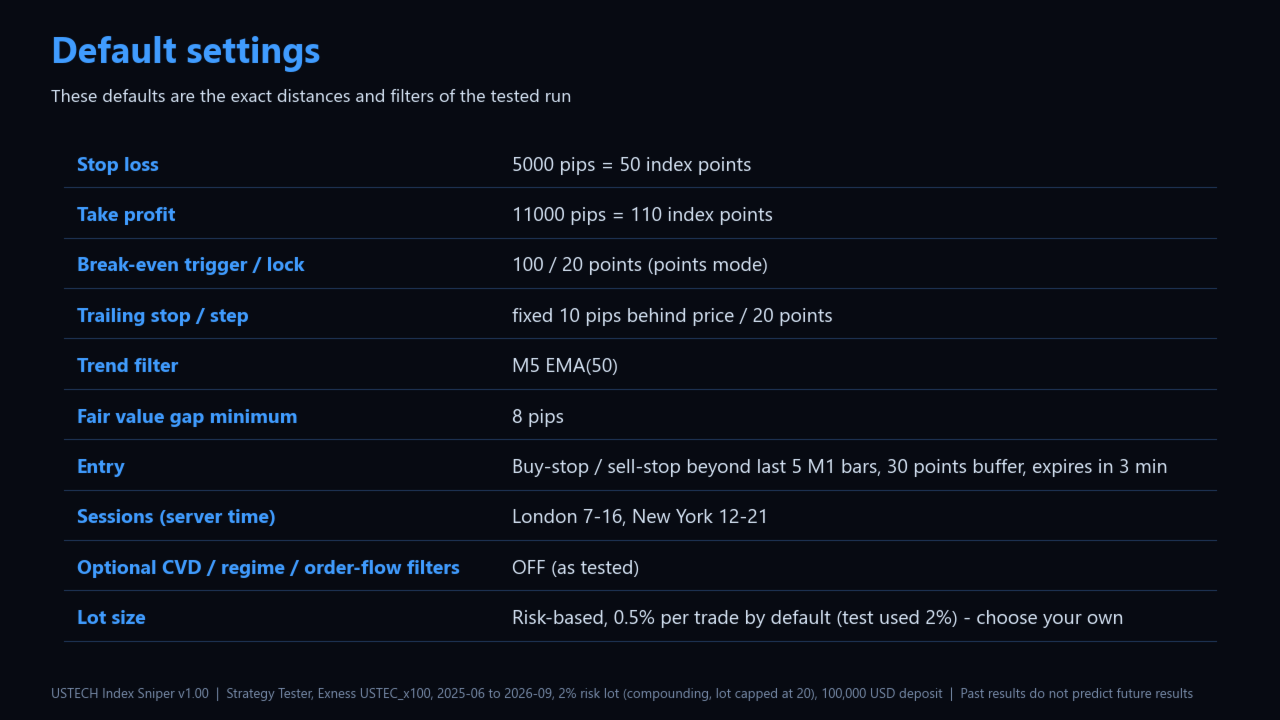
- The default inputs reproduce the tested distances and exits: stop loss 5000 pips, take profit 11000 pips, break-even / trailing in POINTS (UsePipsForTrailing = false). "Pips" in this EA are 0.01 price units, so 5000 pips = a 50-point move and 11000 pips = 110 points on the index. The points inputs depend on your broker's digits: tested on a 2-digit index quote (1 point = 0.01); on a 1-digit quote the distances are different and behaviour will differ.
- The test ran on an Exness index symbol with a contract size of 100 (one lot = 100 USD per index point, 20-lot maximum). Lot sizes, profits and drawdown amounts therefore do NOT transfer to other brokers, whose index contracts are usually much smaller; only the risk-based sizing (a percentage of equity per trade) carries over.
- RISK: the test used 2% risk per trade with compounding. By default this build uses 0.5% risk. That is still a high-risk scalper: a few losing trades can erase many small wins. Results and drawdown scale with risk. Choose a size that is right for YOUR account, and start on a demo account.
- A scalper with trades of a few minutes is very sensitive to spread, slippage, execution speed, commission and the broker's stop level. Live results can be very different from the backtest.
- Designed and tested on a US Tech 100 index only. On other symbols the input AutoAdaptSymbol (default true) scales every distance by price / 21700 so the EA can run at all; those symbols are NOT backtested - leave it on the index for the tested behaviour, or set AutoAdaptSymbol = false to use the raw index distances.
- Session hours (London 7-16, New York 12-21) are BROKER SERVER time, tested on Exness. Check your broker's server-time offset. Index symbols are named differently by brokers (USTEC, NAS100, US100 ...): check digits and PipSize (default 0.01).
- Past performance is not a guarantee of future results. Trading leveraged products is risky; this is not financial advice.
SETUP
1. Attach the EA to a chart of the US Tech 100 index and allow Algo Trading.
2. Leave the defaults for the tested behaviour, or set your own risk (RiskPercent) / fixed lot (UseRiskLot = false, FixedLot).
3. Check the session hours against your broker's server time.