Smart TrendFlow Pro
- Indicatori
-
Shipra Gupta
 Sono Shipra Gupta, trader e sviluppatrice di strategie quantitative con una solida formazione in matematica, economia e sistemi di trading algoritmico. Nel corso degli anni ho lavorato ampiamente nei mercati forex, oro, indici, materie prime e criptovalute, concentrandomi sulla costruzione di
 - Versione: 1.0
Smart Trend Flow Pro – Channel Breakout and Volatility Heatmap
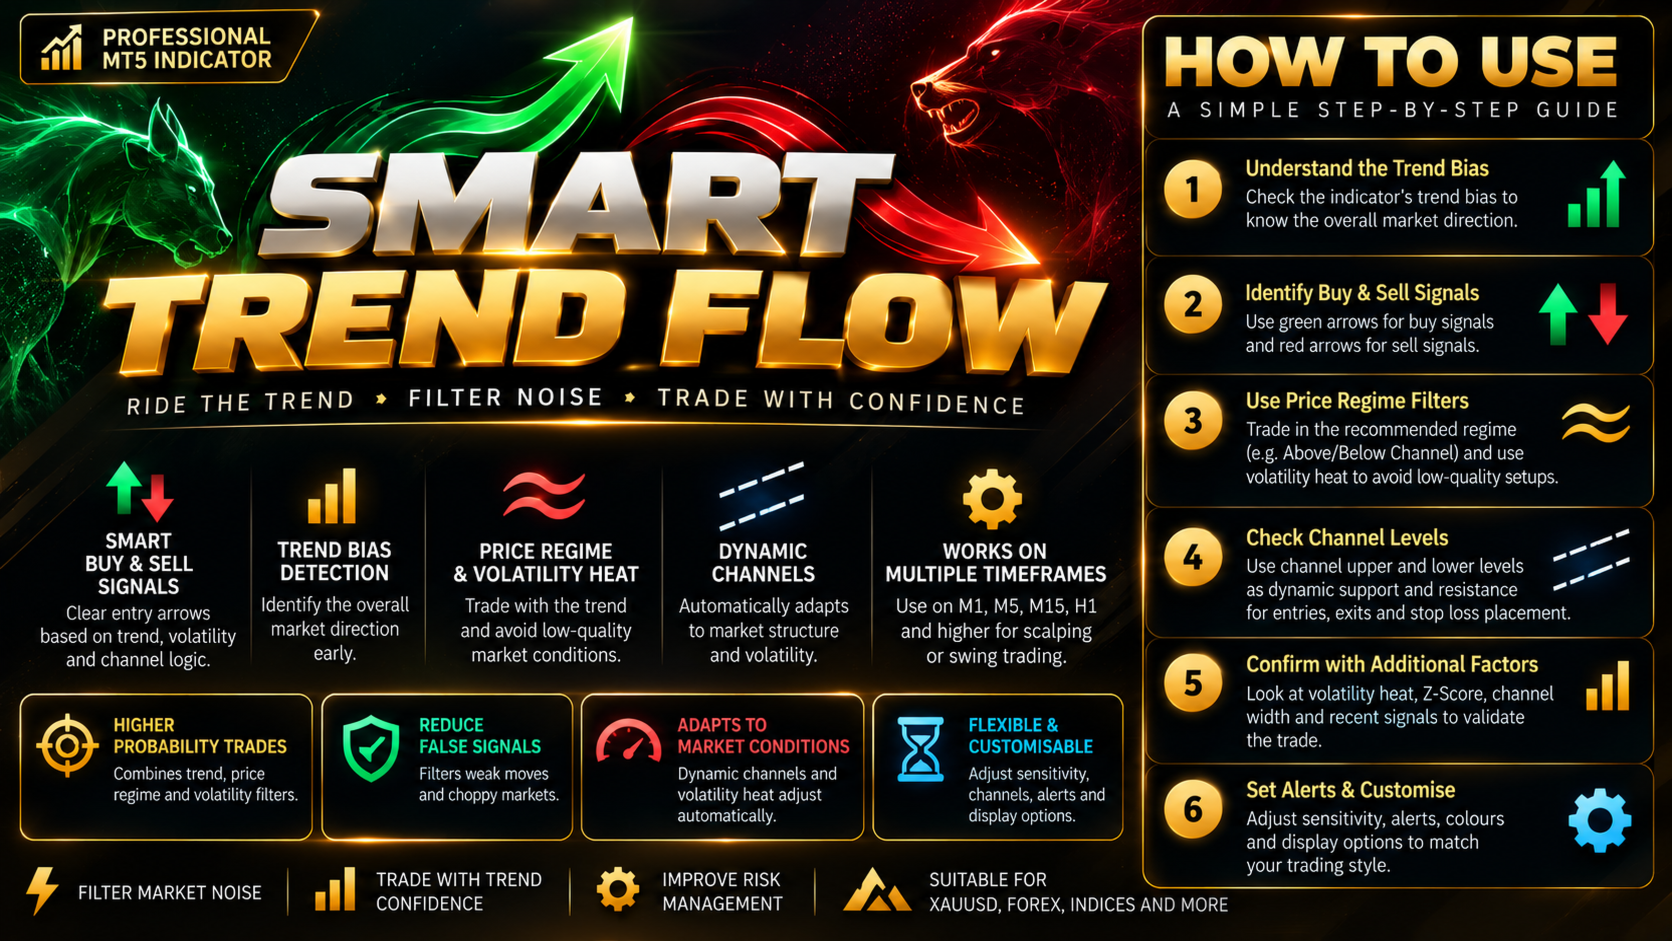
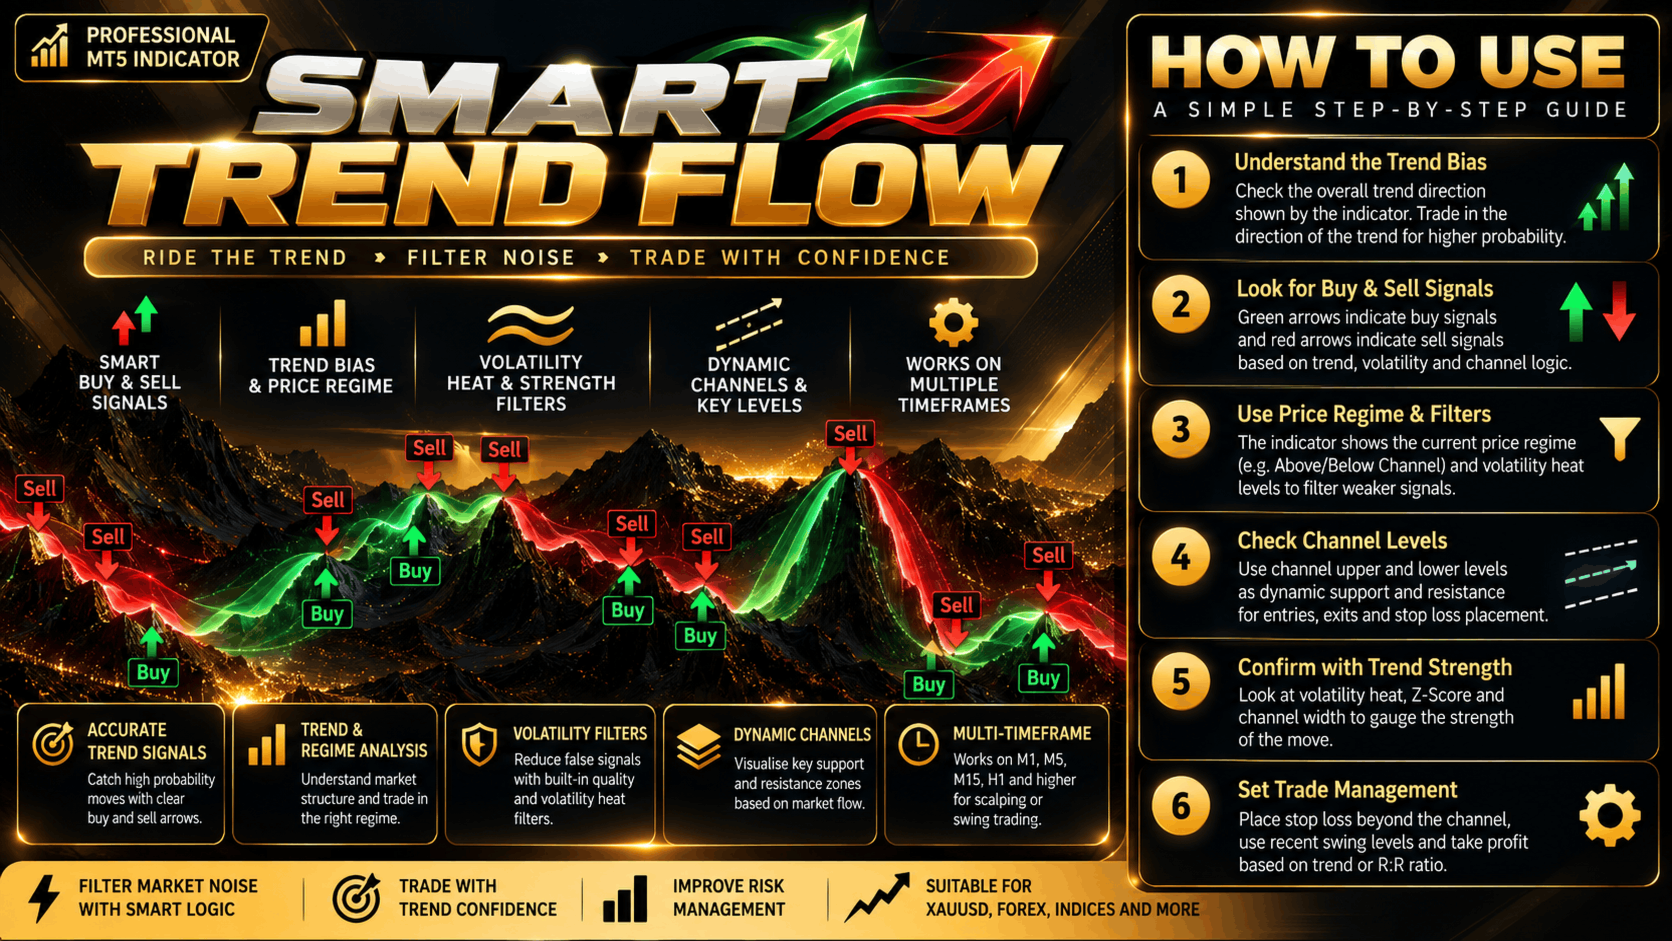
Smart Trend Flow Pro is a MetaTrader 5 (MT5) trend analysis, channel breakout, and volatility visualisation indicator designed to help traders identify directional market conditions, potential price-channel breaks, and changes in trend strength directly on the chart. It combines configurable channel calculations with trend-state logic and optional colour-coded candle analysis, giving traders a visual framework for examining bullish and bearish conditions, breakout behaviour, and periods of changing volatility. With selectable channel calculation methods, including conventional and advanced moving-average approaches, Smart Trend Flow Pro can be adapted to different chart-analysis preferences and trading styles. Its trend-flip signals, optional heatmap presentation, volatility analysis, and chart dashboard are intended to help traders evaluate potential breakout setups, trend continuation, consolidation, and shifts between quieter and more active market conditions. The indicator may be incorporated into technical analysis workflows for forex, gold (XAUUSD), indices, and other CFDs, alongside price action, support and resistance, and market structure analysis. For traders looking for a channel breakout indicator for MT5, trend detection indicator, volatility heatmap, colour-changing candle indicator, or configurable trend analysis tool, Smart Trend Flow Pro provides multiple visual methods for interpreting price behaviour. Breakouts and trend signals can fail, particularly in sideways or rapidly changing markets, so confirmation and risk management remain important.
MT5 Expert Advisor Collection
Explore automated systems built for Gold & Bitcoin, covering breakout, scalping, momentum and multi-horizon strategies.
Gold: Range Striker | Gold Flash | Vortex Pro | Neural Scalper | Titan Forge | Quantum Pulse | GoldGridBreakout | Gold Micro Account | Gold Cortex AI
Bitcoin: BTC Strike | Alpha Vault | Edge Pilot
Nasdaq: Nasdaq Sniper Open
Channel-Based Trend Detection
The indicator builds its trend state around a high-low channel. You can choose how the channel is calculated:
-
Raw high-low channel.
-
Exponential Moving Average (EMA).
-
Double Exponential Moving Average (DEMA).
-
Triple Exponential Moving Average (TEMA).
-
Hull Moving Average (HMA).
The default configuration uses a 20-period channel with the Hull Moving Average method.
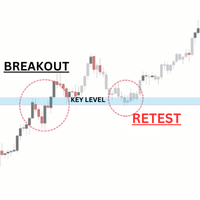
Channel breakouts and changes in the trend state form the basis of the indicator's Buy and Sell flip signals. These signals can help identify potential directional changes, but a channel breakout does not guarantee continued movement.
Volatility Heatmap Candles
Smart Trend Flow Pro includes an optional candle-coloring feature designed to combine directional state with volatility conditions.
When enabled, the heatmap uses separate bullish, bearish and neutral color schemes. The bullish and bearish schemes each support different colors for lower- and higher-volatility conditions, allowing you to distinguish the direction of the trend state from its volatility intensity.
The heatmap can be switched off if you prefer to retain standard price candles and focus on signal arrows and the dashboard.
Buy and Sell Signals
The indicator can display Buy and Sell arrows and labels when its trend state changes. Signal visibility can be configured independently, so you can use arrows, labels or both according to your charting preference.
Popup, push, email and sound alerts are also available as configurable options for signal notifications.
Volatility Analysis and Dashboard
A configurable analytics lookback period is provided for the indicator's squeeze and Z-score calculations. This setting allows you to adjust the analysis window used by its volatility-related logic.
The on-chart dashboard can be enabled or disabled, and its background and text colors can be customized to match your chart theme.
Customization
Key settings include:
-
Channel length and calculation method.
-
Analytics lookback length.
-
Optional heatmap candles.
-
Bullish, bearish and neutral colors.
-
Buy and Sell label and arrow visibility.
-
Dashboard visibility and colors.
-
Historical bars to plot.
-
Popup, push, email and sound alerts.
Suggested Use
Use the channel and signal markers to study potential trend transitions and breakouts. Review the volatility heatmap to add context to the current directional state, then evaluate signals alongside price structure, support and resistance and your preferred risk-management rules.
The indicator is a visual analysis tool and should not be treated as a standalone trading strategy.
Important Information
Smart Trend Flow Pro does not automatically execute trades or manage positions. Trend and breakout signals may be unreliable in ranging markets or during sudden changes in volatility. Historical signals are not a guarantee of future performance. Test the indicator on your intended instruments and timeframes before using it in live trading.