LM Portfolio Analytics MT5
- Indicatori
-
Luca Macinagrossa
 Hello everyone, I’m Luca, an Italian algorithmic-trading developer based in London. My interest in trading and financial markets began during my university studies, where my first economics modules sparked a lasting curiosity about how markets behave.
 - Versione: 1.10
- Attivazioni: 5
LM Portfolio Analytics MT5
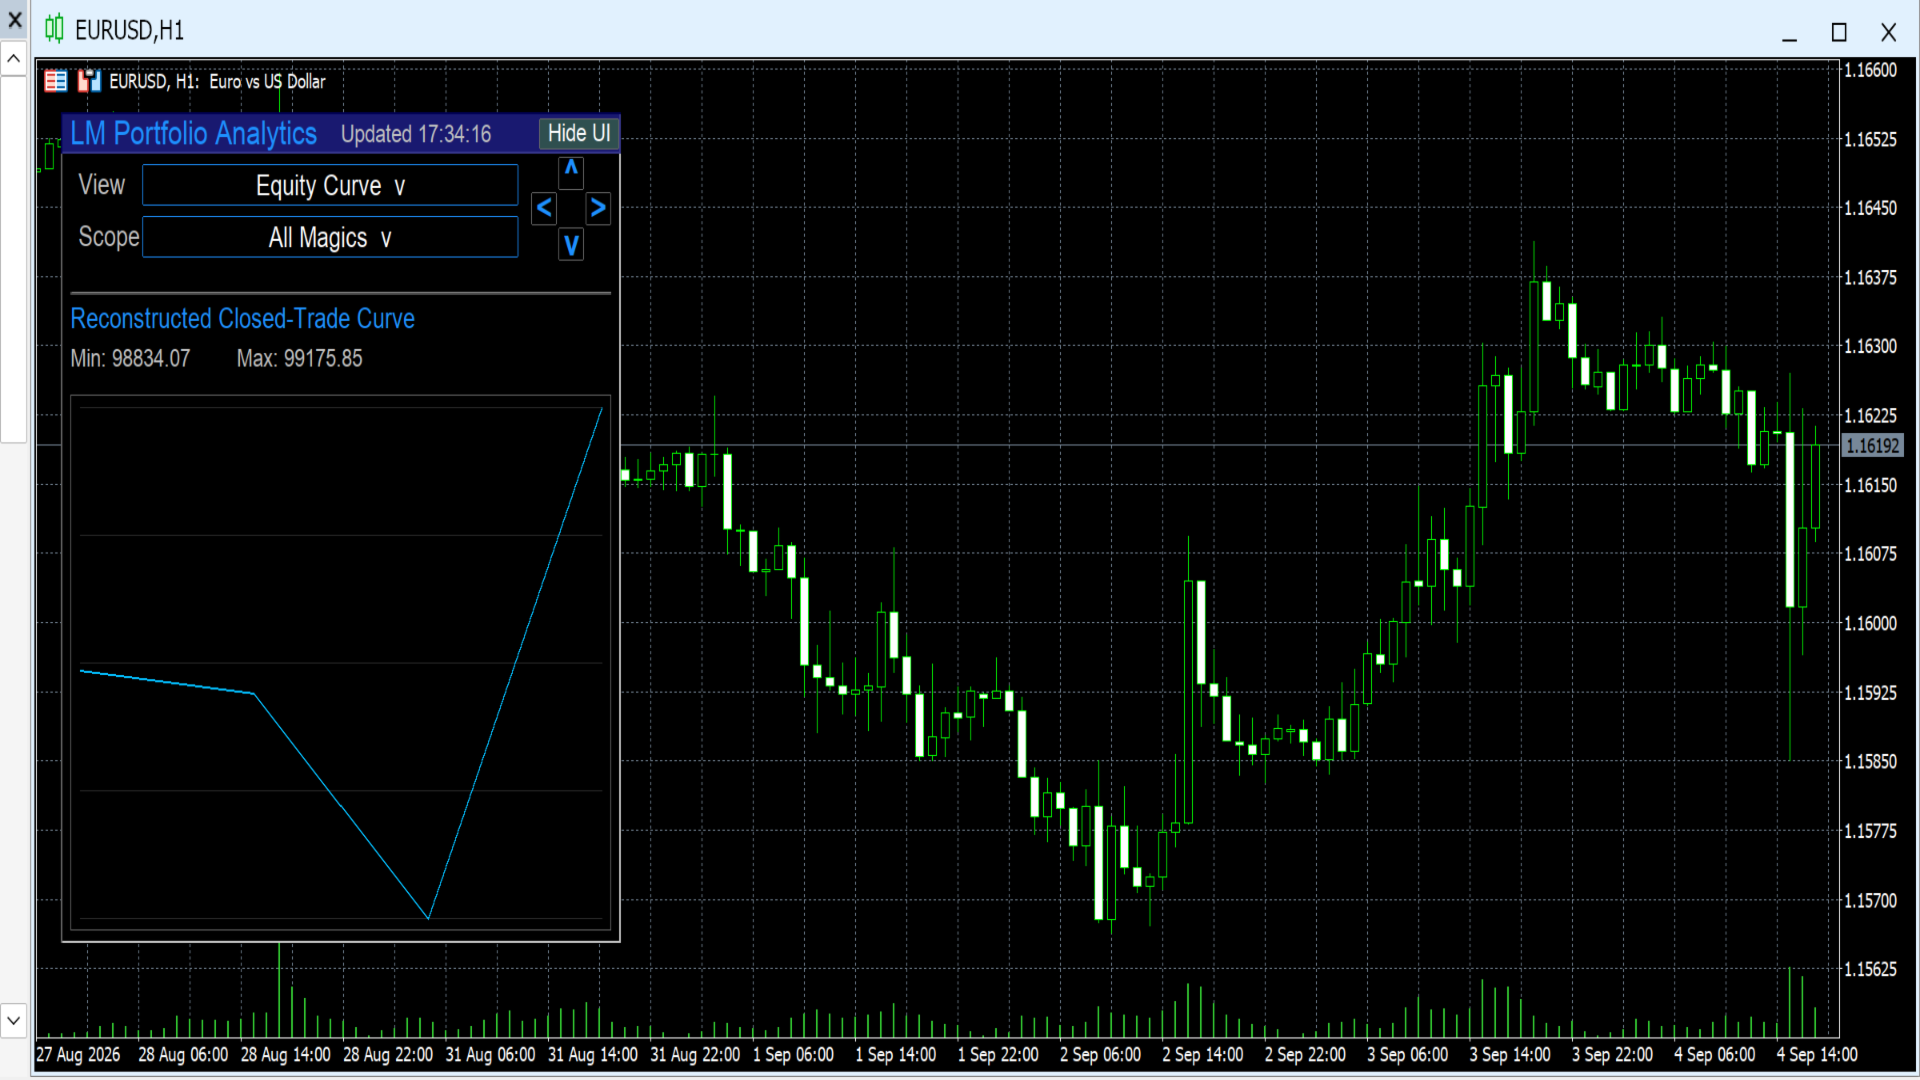
LM Portfolio Analytics MT5 displays closed-trade performance statistics and an equity curve directly on the MetaTrader 5 chart.
The indicator reads the account’s available closed-deal history and organises the results into a compact on-chart dashboard. It can analyse a selected magic number, all available magic numbers, or configured EA groups.
Two dashboard views are available:
-
Statistics
-
Equity Curve
Three analysis scopes are available:
-
Single Magic
-
All Magics
-
EA Group
LM Portfolio Analytics MT5 is an analytical tool. It does not open, modify, or close trades. It does not provide investment advice and does not guarantee trading results.
Features
-
On-chart portfolio analytics dashboard.
-
Statistics view for reviewing closed-trade performance.
-
Equity Curve view for visualising the progression of selected closed-trade results.
-
Single Magic scope for analysing one magic number at a time.
-
All Magics scope for reviewing combined closed-trade results.
-
EA Group scope for reviewing configured groups of trading systems.
-
Dropdown controls for View, Scope, and EA Group selection.
-
Keyboard navigation using < and > to cycle available magic numbers in Single Magic mode.
-
Configurable EA group names.
-
Compact panel layout designed for direct chart use.
-
Panel redraw behaviour designed to keep dropdown menus visible above underlying controls.
-
Works on any chart symbol and timeframe.
-
Uses closed trade history available in the MetaTrader 5 terminal.
-
No DLLs, external files, or third-party dependencies.
-
Does not send trading commands.
Parameters
Panel Settings
Show panel
Shows or hides the Portfolio Analytics dashboard.
Panel corner
Selects the chart corner where the panel is displayed.
Panel width
Sets the width of the dashboard panel.
Panel padding
Sets the internal spacing between panel content and borders.
Row height
Sets the height of dashboard rows and dropdown controls.
Font size
Sets the text size used by the dashboard.
Panel font
Selects the font used for panel text.
Display Settings
Default view
Selects the dashboard view shown when the indicator is attached.
-
Statistics: displays the closed-trade metrics dashboard.
-
Equity Curve: displays the equity curve for the selected scope.
Default scope
Selects the initial trade-history filter.
-
Single Magic: analyses one selected magic number.
-
All Magics: combines closed-trade results across available magic numbers.
-
EA Group: analyses the configured EA group selection.
Control width
Sets the width of the View, Scope, and Group dropdown controls.
EA Group Settings
EA Group 1 name
Sets the name shown for the first EA group.
EA Group 2 name
Sets the name shown for the second EA group.
EA Group 3 name
Sets the name shown for the third EA group.
EA Group 4 name
Sets the name shown for the fourth EA group.
EA Group 5 name
Sets the name shown for the fifth EA group.
EA Group names are used to organise and identify configured strategy groups inside the dashboard.
Statistics View
The Statistics view displays closed-trade information for the currently selected scope.
Depending on the available account history and the indicator configuration, the dashboard can display performance information such as:
-
Total closed trades.
-
Winning trades.
-
Losing trades.
-
Win rate.
-
Gross profit.
-
Gross loss.
-
Net closed-trade result.
-
Average winning trade.
-
Average losing trade.
-
Average closed-trade result.
-
Profit factor.
-
Drawdown-related values.
-
Expectancy-related values.
-
Other closed-trade metrics calculated by the indicator.
The displayed results are based on the currently selected scope: Single Magic, All Magics, or EA Group.
Equity Curve View
The Equity Curve view displays the progression of the selected closed-trade results.
Use this view to review how cumulative closed-trade performance changed through the available history.
The curve is informational. It is based on historical closed deals selected by the active filter and should not be treated as a prediction of future account performance.
Scope Settings
Single Magic
Single Magic analyses closed trades associated with one selected magic number.
Use the Scope dropdown to select Single Magic. The dashboard displays the active magic number and the available navigation hint.
Use the < and > keys to cycle through available magic numbers.
All Magics
All Magics combines the available closed-trade results across magic numbers included in the indicator’s trade-history calculation.
Use this scope to review overall closed-trade performance from multiple strategies or trading systems.
EA Group
EA Group provides a selection of configured strategy-group names.
Use the Group dropdown to select an available EA group. Configure the displayed group names in the indicator input parameters.
How to use
-
Install LM Portfolio Analytics MT5 from the MetaTrader 5 Market.
-
Open any chart symbol and timeframe.
-
Attach the indicator to the chart.
-
Open the indicator Parameters tab if you want to configure panel settings or EA group names.
-
Use the View dropdown to select Statistics or Equity Curve.
-
Use the Scope dropdown to select Single Magic, All Magics, or EA Group.
-
In Single Magic mode, use the dropdown controls or < and > keyboard navigation to cycle through available magic numbers.
-
In EA Group mode, select the required group from the Group dropdown.
-
Review the on-chart statistics or equity curve for the selected scope.
-
Adjust the panel position, font, colours, and group names through the indicator input settings if required.
Important notes
The indicator uses closed-deal and account-history information supplied by the connected MetaTrader 5 terminal and broker.
Displayed statistics depend on the history currently available in the terminal. If account history is incomplete, restricted, or unavailable, the dashboard may show incomplete results or no data.
Different brokers can record deal and commission information differently. Consequently, results may vary between brokers, account types, trading conditions, or history-import settings.
Magic numbers are identifiers commonly used by Expert Advisors. Manual trades may have a magic number of zero or another value depending on how they were created or modified.
EA Group names are organisational labels configured by the user. They are not trading signals, portfolio recommendations, or performance guarantees.
The Equity Curve and all statistical values are based on historical closed-trade information. Historical results do not guarantee future performance.
LM Portfolio Analytics MT5 does not place trades, manage positions, change orders, provide investment advice, or guarantee profitability.
Trading financial markets involves risk. Use the indicator as part of your own analysis and risk-management process.