PulseColor
- Indicatori
-
Ivan Simonika
 List of the best products: https://www.mql5.com/ru/users/dragonivan/seller
e-mail: dragon.ivan.sym@gmail.com - Versione: 1.21
- Attivazioni: 5
Overview
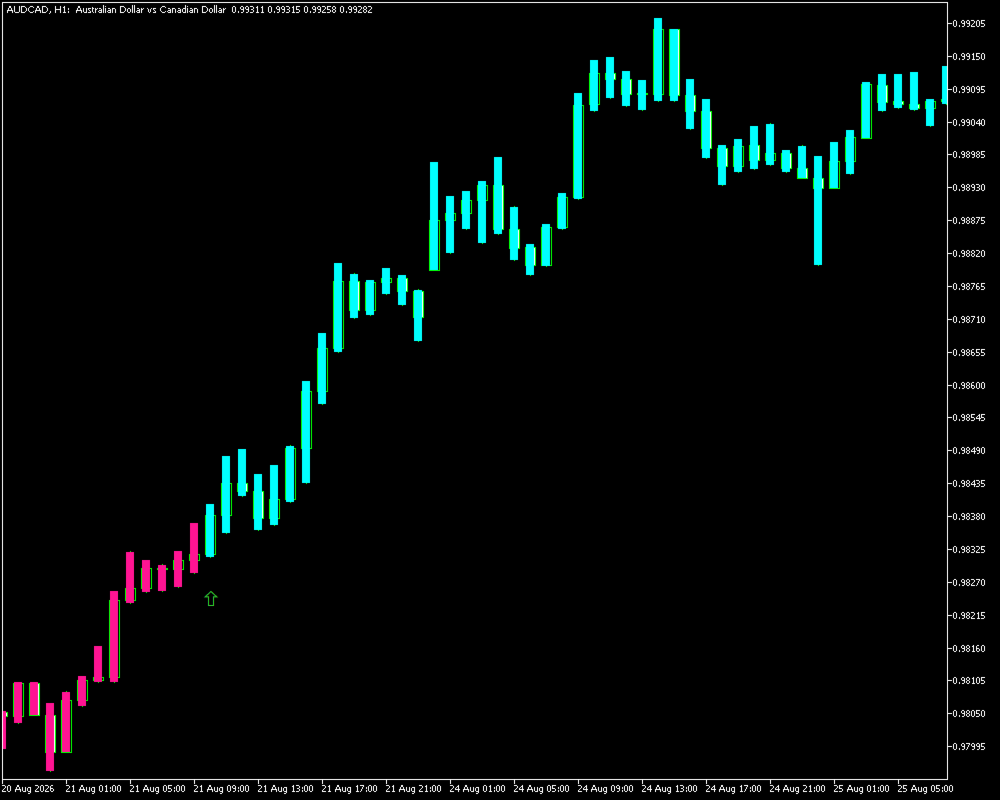
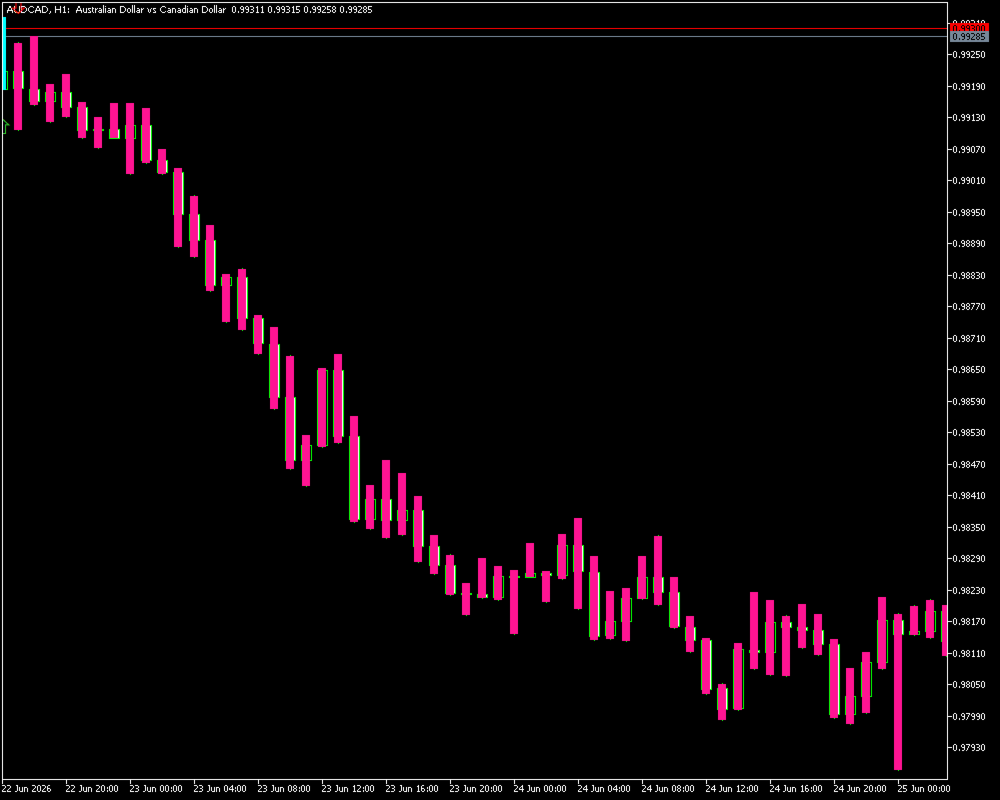
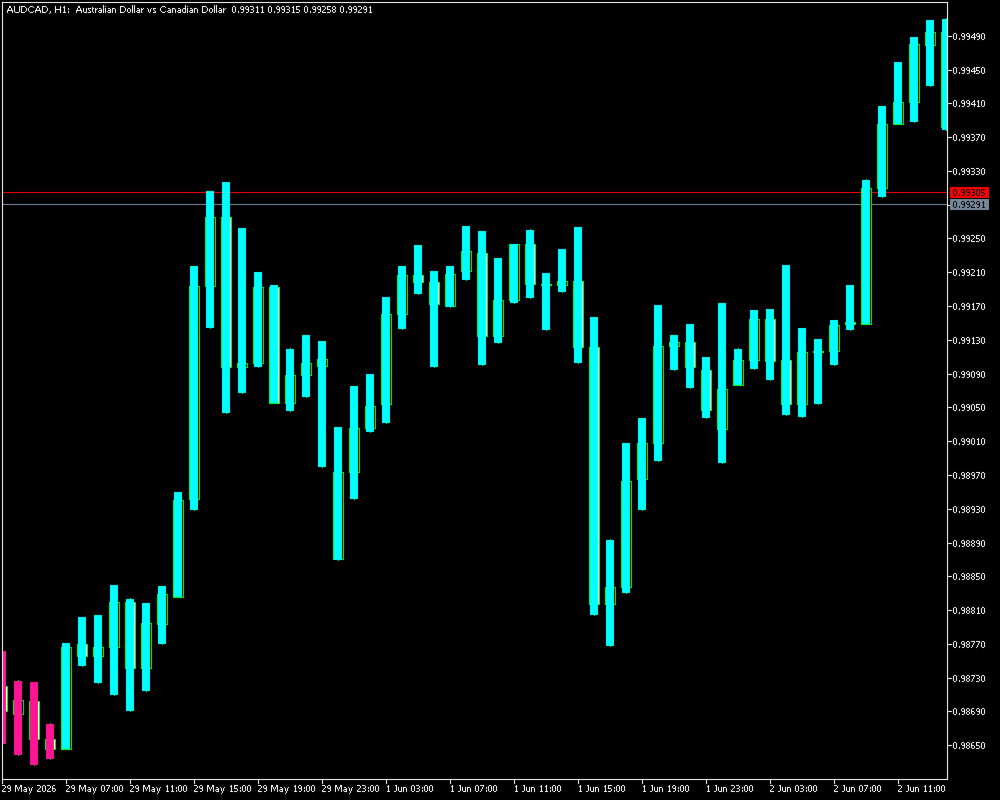
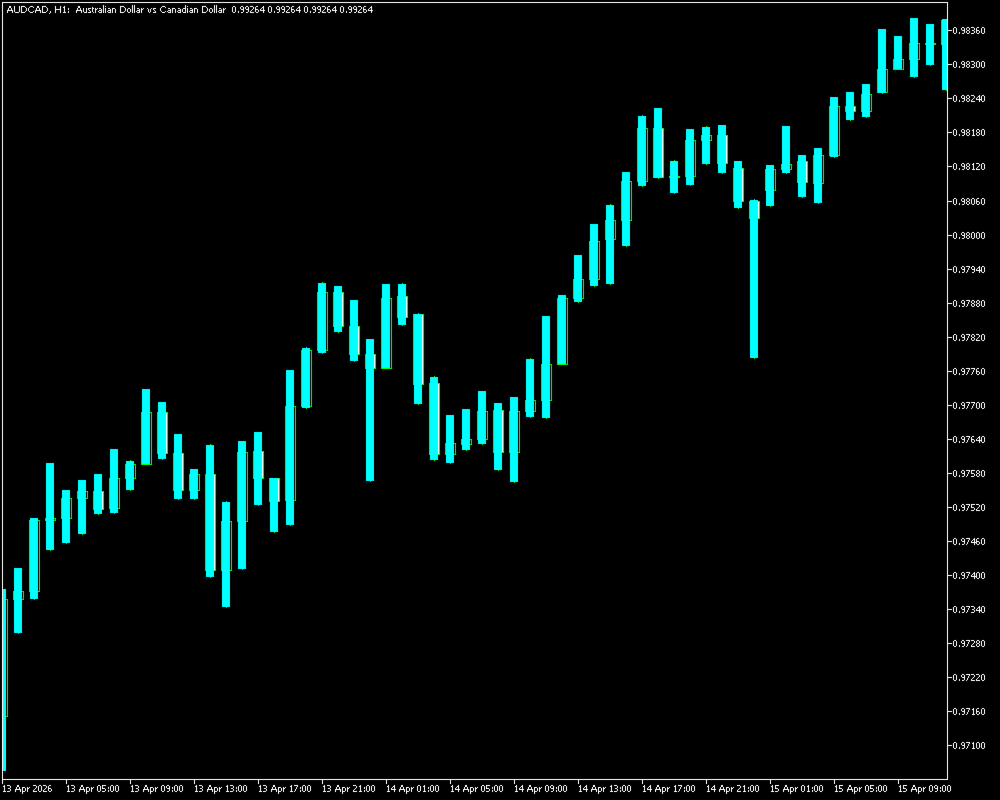
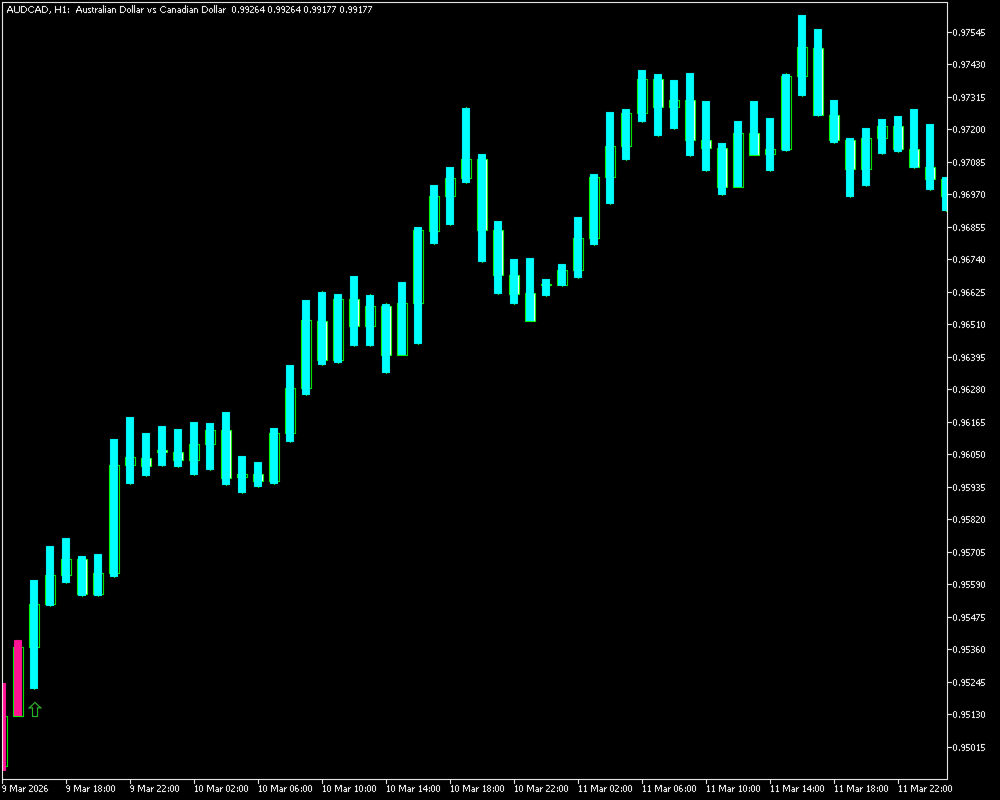
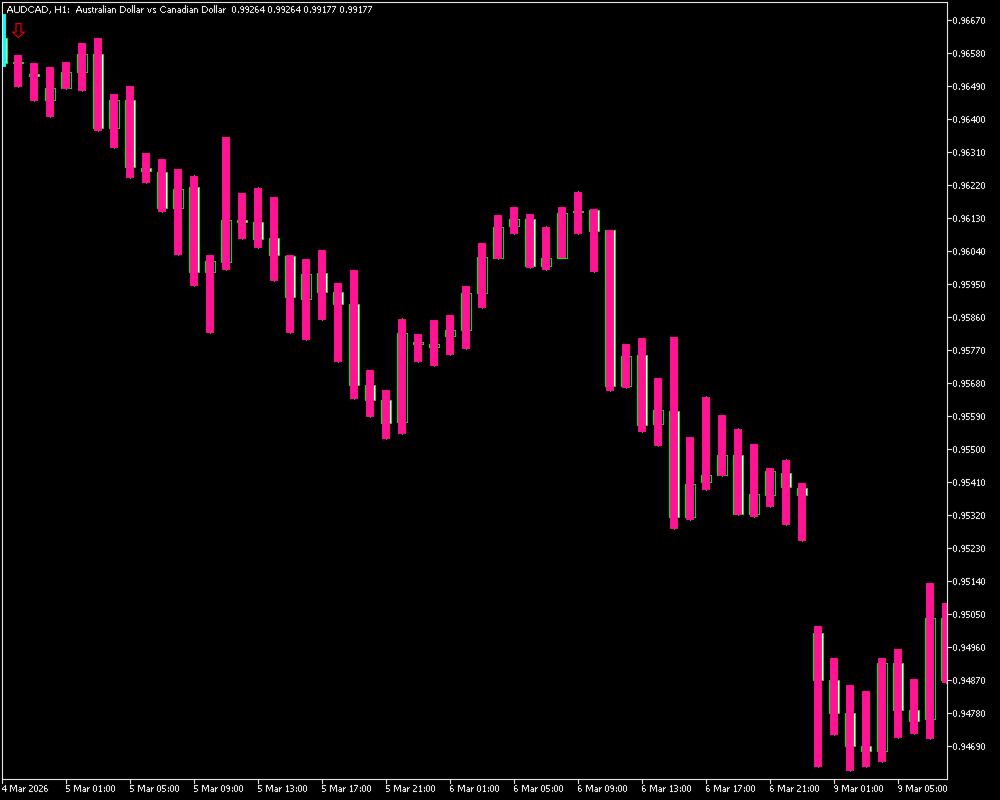
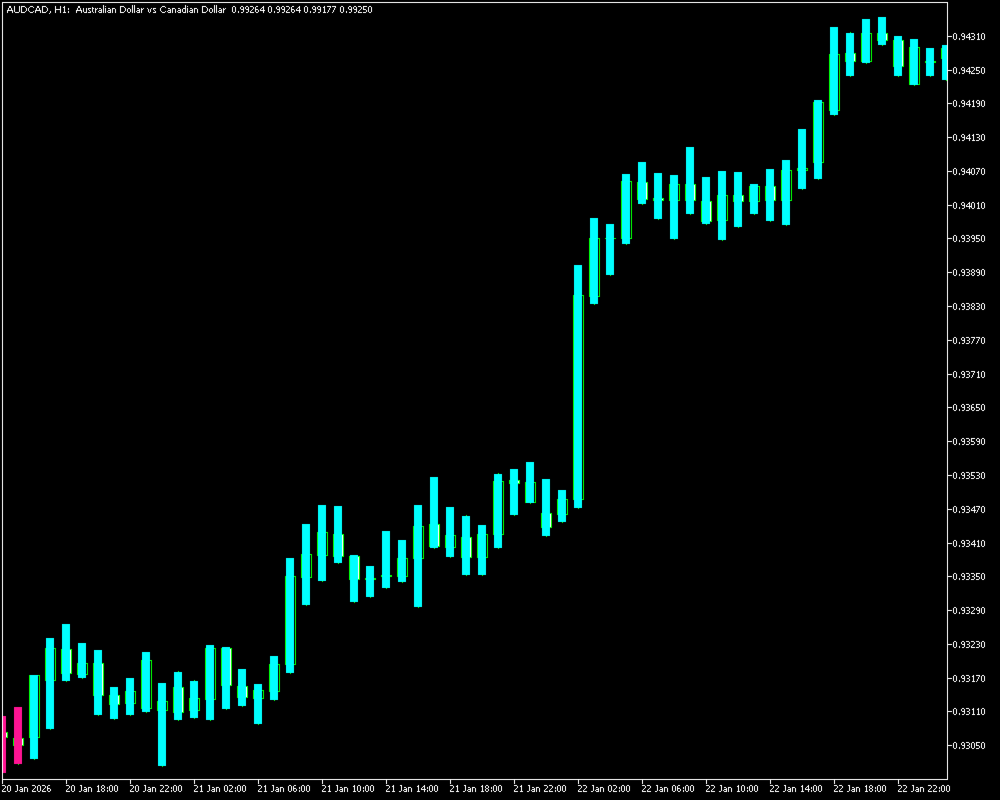
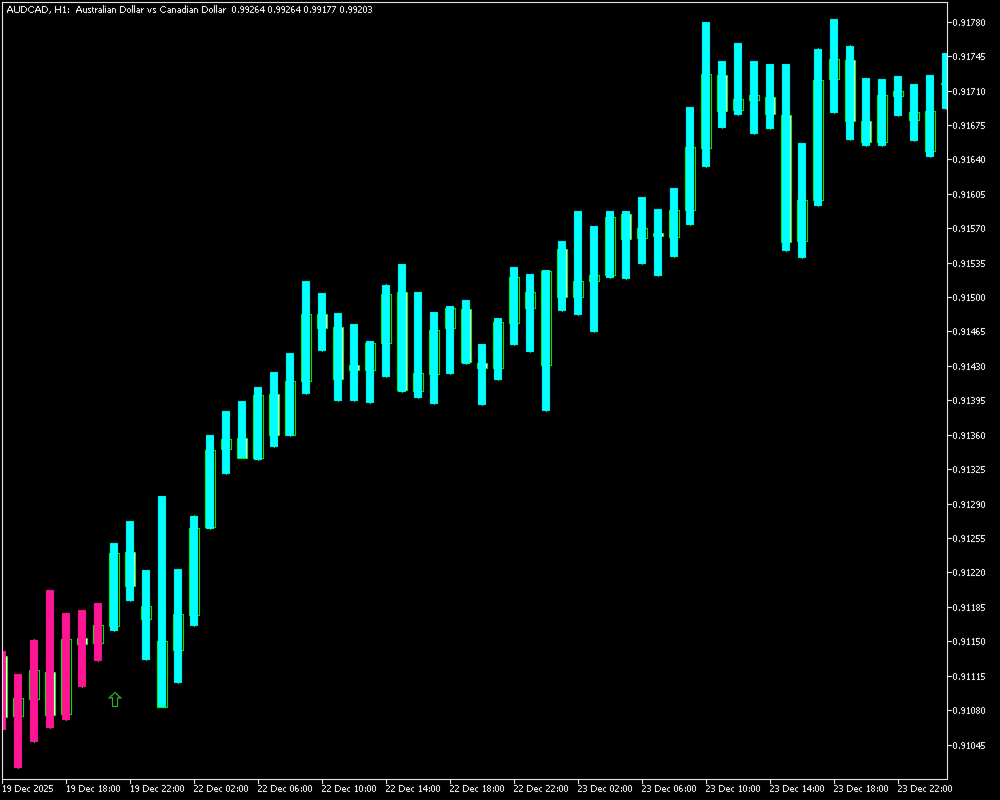
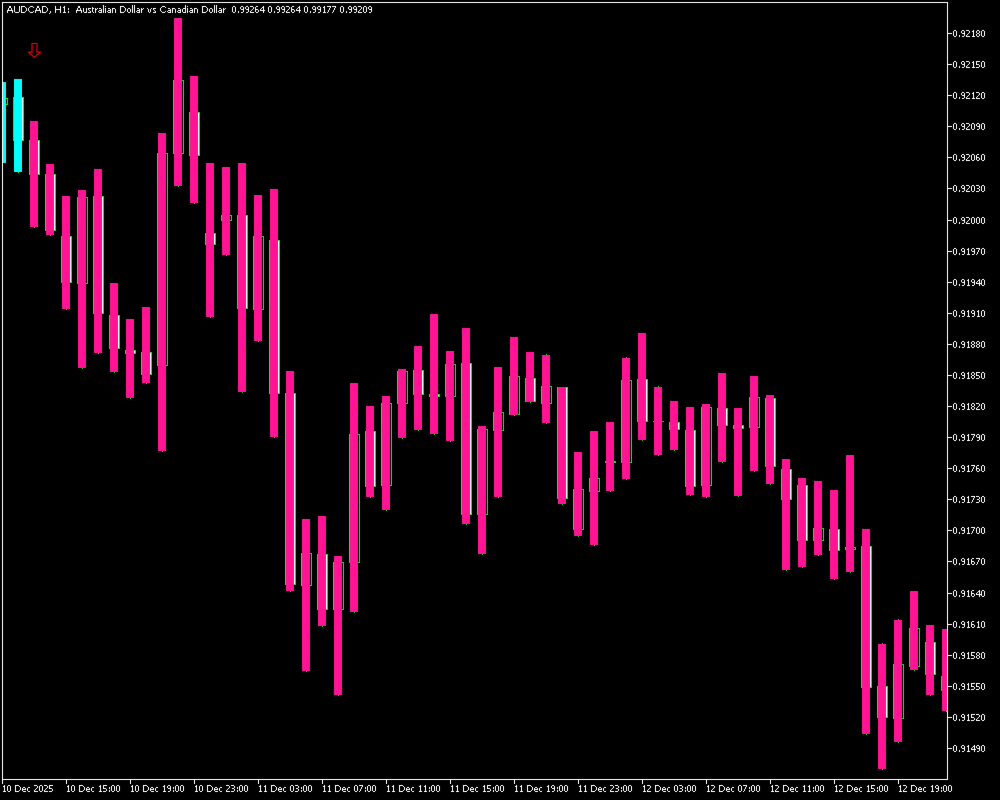
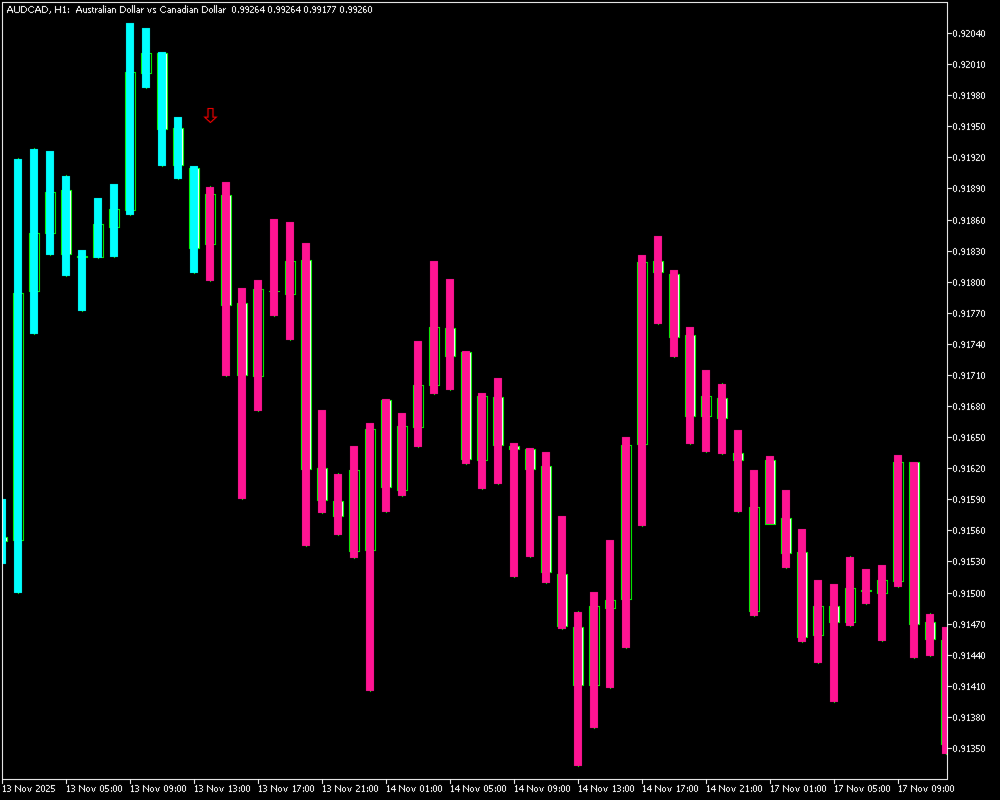
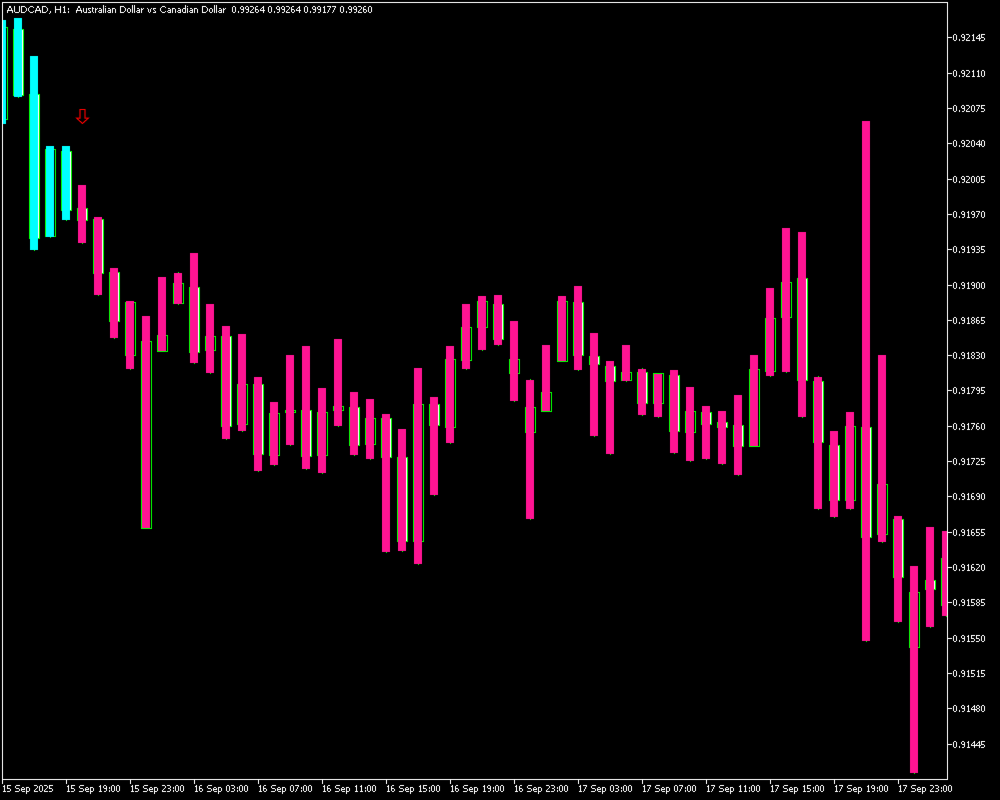
PulseColor is an indicator for MetaTrader 5 that visualizes the current dominance of the positive or negative directional indicator (+DI or -DI) by coloring the High–Low range of each bar directly on the price chart.
The indicator works in the main chart window and does not open an additional subwindow.
PulseColor uses the classic Average Directional Movement Index (ADX) calculation. For each bar, the indicator compares the values of +DI and -DI. The stronger component determines the color of the High–Low range of that bar.
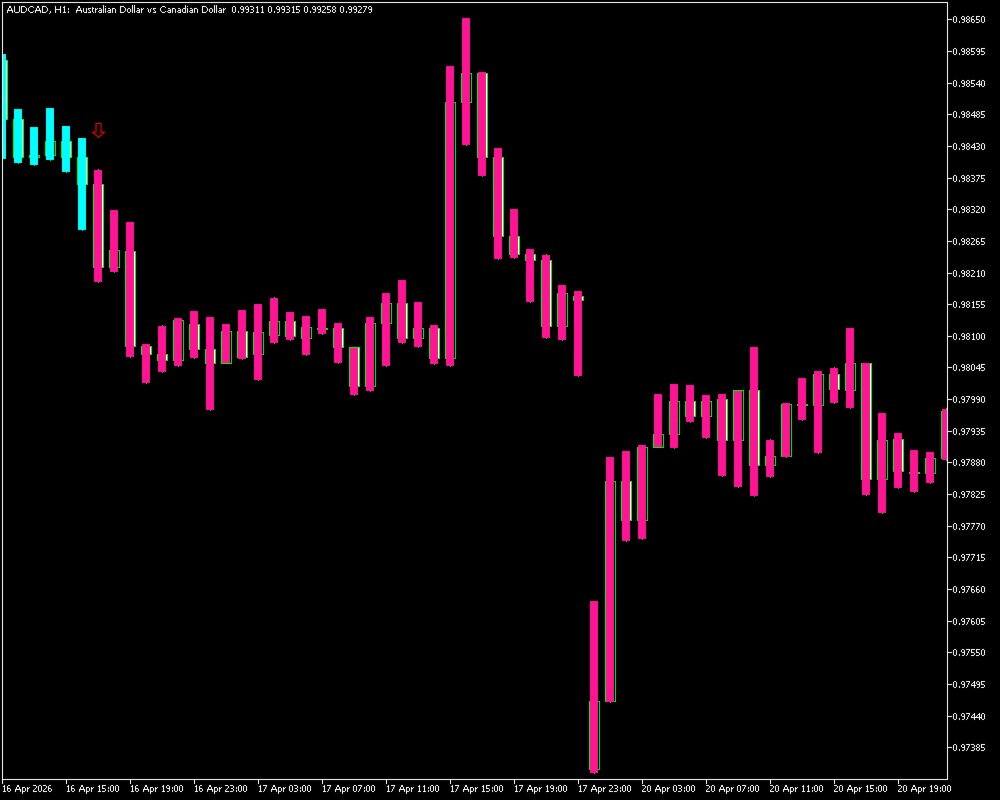
Optional arrows can mark the bars where the dominant direction changes compared with the previous period.
This visual presentation keeps the trader's attention on the price chart while still providing information about the current directional movement of the market.
How the Indicator Works
The indicator obtains the +DI and -DI values using the standard iADX function of the MetaTrader 5 terminal.
The following logic is applied to each bar:
-
When +DI > -DI, the High–Low range of the bar is displayed in the bullish color.
-
When -DI > +DI, the High–Low range of the bar is displayed in the bearish color.
-
When directional dominance changes compared with the previous bar, an arrow can be displayed above or below the current bar according to the selected vertical offset.
The colored segments are drawn using the DRAW_HISTOGRAM2 style. This ensures that each segment is displayed strictly between the High and Low values of the corresponding bar and does not extend toward the zero line.
Empty values are assigned to the opposite color buffers, ensuring that only one color is visible on each bar.
Input Parameters
ADX Smoothing Period
The averaging period used in the calculation of the directional indicators.
The default value is 21.
Increasing the period reduces the number of directional changes and produces longer sequences of bars with the same color.
Decreasing the period makes the indicator more responsive to short-term changes in directional movement.
Arrow Vertical Shift
The distance in points between the High or Low of the bar and the corresponding arrow symbol.
Adjust this value if the arrows appear too close to the price or too far away from it.
Display Signal Arrows
Enables or disables the display of signal arrows.
When disabled, only the colored High–Low segments remain visible on the chart.
Bullish Color
The color used for the High–Low range when +DI is the stronger component.
Bearish Color
The color used for the High–Low range when -DI is the stronger component.
Usage
PulseColor can be applied to any symbol and any timeframe supported by MetaTrader 5.
Closed bars do not change their color or arrow status. Only the currently forming bar is updated as new ticks arrive.
PulseColor does not generate buy or sell signals, place trades, or contain money-management rules.
The indicator provides a visual representation of the relationship between +DI and -DI and can be used as an additional technical analysis tool.
It can be combined with your own methods for identifying:
-
support and resistance levels;
-
market structure;
-
trend direction;
-
additional technical filters;
-
custom trading strategies.
Continuous coloring of the bar ranges makes periods of sustained directional dominance easy to identify at a glance.
Optional arrows highlight the exact bars where the balance between the two directional components changes.
Technical Details
-
Platform: MetaTrader 5
-
Window: Main chart window
-
Range drawing style: DRAW_HISTOGRAM2
-
Signal drawing style: DRAW_ARROW
-
Buffers: 8
-
Data buffers: 4 for the two histogram pairs
-
Arrow buffers: 2
-
Calculation buffers: 2
-
Calculation: Standard terminal iADX handle
-
External Libraries: Not used
-
DLL Calls: Not used
-
Network Requests: Not used
Installation
Copy the compiled indicator file into the Indicators folder of the MetaTrader 5 data directory.
After installation, the indicator will appear in the Navigator window and can be attached to any chart.
PulseColor does not require external libraries, DLL calls, or an internet connection to perform its calculations.