AutoPivotMT5
- Indicatori
-
Xin You Lin
 Golden Wings
 - Versione: 2.88
- Attivazioni: 5
AutoPivot FXAIEA — see the day's support and resistance at a glance
In intraday trading, the hardest part is not spotting a pattern. It is answering the most basic question of all: where will price meet resistance today, where will it find support, and which level actually matters.
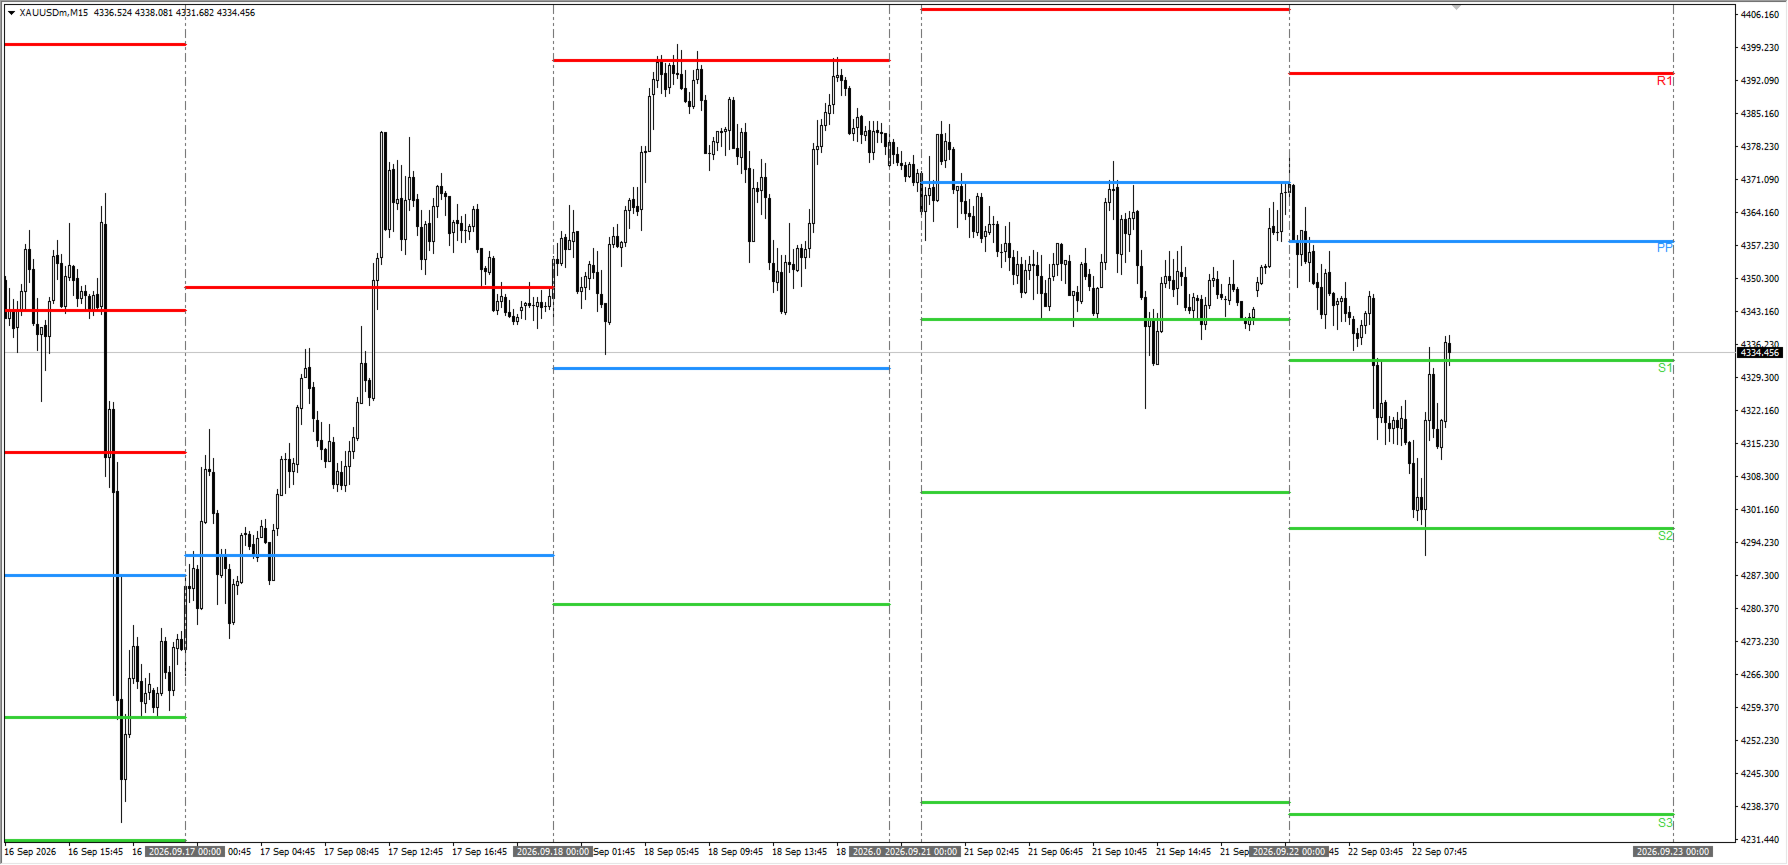
AutoPivot FXAIEA turns that into something you can simply read off the chart. Every trading day it draws the central pivot P with up to four resistance levels R1–R4 and four support levels S1–S4. Which level price is testing, and how much room is left to the next one, is visible the moment you look.
What it gives you while you trade
Instantly know where price stands.
The central pivot P is the day's bull/bear dividing line. Above P, buyers are in control, and a pullback that holds above it is a long setup. Below P, sellers have taken over, and a rally that fails at it is a short setup. No more digging through yesterday's high, low and close to work it out yourself.
Know the next target before price gets there.
Break R1 and the next objective is R2, then R3. The levels are spaced evenly, so the rhythm of the move is obvious. On a breakout trade you can decide where to take profit and how much room is left — before you enter, not while you watch.
Support and resistance become concrete entry and exit rules.
A pullback that holds at S1 is a long; lose S1 and you look at S2. A rally stalling at R1 is a place to trim; a firm break above R1 opens the way to R2. Every level has a job, and stops sit on the other side of the level you are trading from, so risk is visible at a glance.
Read range or trend from how the levels behave.
In a tight range, price oscillates between R1 and S1 — trade the edges. When price breaks through an outer level and holds, the day usually turns into a trend, and you switch from fading the range to following the move. Same lines, different playbook, almost no thinking cost.
Clean slate every day.
At the start of each trading day, yesterday's levels retire and only today's framework remains. No clutter, no reading the wrong line by mistake. Want to compare against previous days? Raise the number of periods; every past day's levels are drawn just as clearly.
Four methods to match the instrument.
Classic is the reliable all-rounder. Camarilla sits tighter to intraday reversals. Woodie weights the close and reacts better to gaps. Fibonacci spaces levels by retracement ratios and suits trending days. For gold, forex or indices, one of them will feel right.
Higher-timeframe levels on your execution chart.
Run daily or even weekly pivots on an M5 or M15 chart. Plan entries on the short term while keeping the bigger key levels in sight — no switching timeframes back and forth.
Why it beats the usual pivot indicators
- Levels land where they should. The day boundary follows your broker's real trading day. GMT offset and daylight saving are handled automatically, so nothing needs configuring and the lines always match the candles.
- Weekends and holidays do not corrupt your levels. Periods with no trading produce no meaningless flat levels, and Monday's levels come from the last real session instead of an empty bar.
- Lines run all the way to the day's end. No level stops halfway across the screen; price can be compared against today's levels right up to the close.
- Never repaints. Every level comes from a closed period and stays where it was drawn. Signals stay trustworthy and backtesting holds up.
- Exactly as many days as you ask for. Set five and you get five — weekends never eat into the count.
- Looks the way you want. Colours, styles, thickness, how many levels, whether to show labels, all adjustable; automatic colour scheme for dark or light charts.
Ready in 30 seconds
Attach it → pick a method (Classic by default) → pick the calculation period (daily by default) → set how many levels and how many days. The levels appear exactly where they belong.
- Price above P: buy pullbacks that hold, targets R1 then R2
- Price below P: sell rallies that fail, targets S1 then S2
- Stops: on the far side of the level you are trading from
- Ranging: fade between R1 and S1; break and hold beyond them: switch to following the trend
Drop it on a chart and the day's support and resistance are right there — where to enter, where to take profit, how far the move can run, all answered at a glance.