Alpine Volume Profile
- Indicatori
- Versione: 1.1
- Aggiornato: 3 agosto 2026

Alpine Volume Profile
See where the real volume traded — not just where price moved.
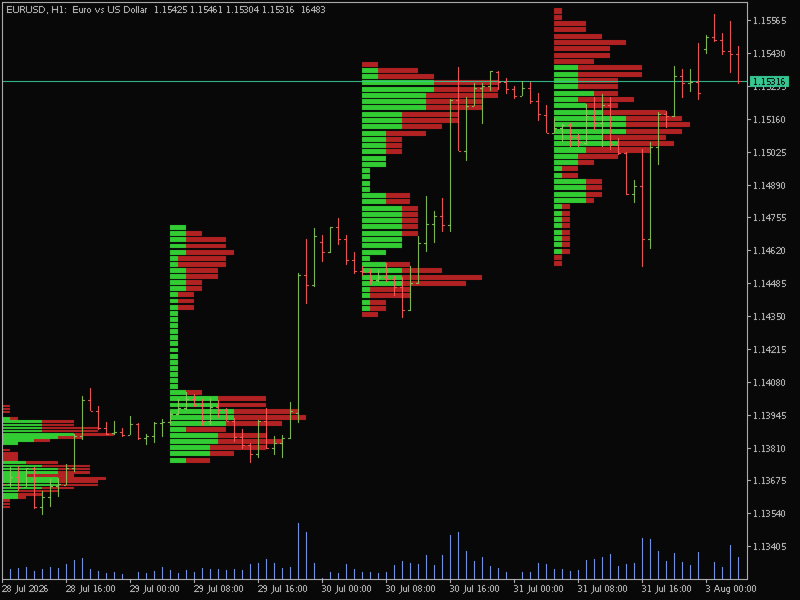
Alpine Volume Profile is an MQL5 indicator that transforms raw tick or exchange volume into a clean, readable horizontal histogram directly on your chart. Instead of a single volume bar at the bottom of the screen, you get a full breakdown of which price levels attracted the most trading activity, session by session.
What It Does
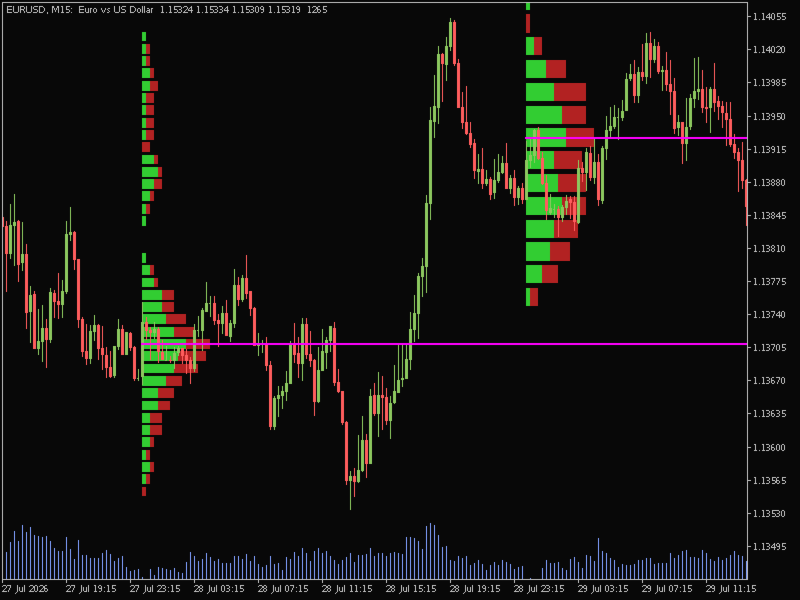
For every day, week, or fixed block of bars you choose, Alpine Volume Profile builds an independent volume histogram anchored to that period. Each row represents a price level, and its length shows how much volume traded there. Rows are split into two colors — one for volume on up-closing bars, one for down-closing bars — so you can see buying and selling pressure at a glance, not just total activity.
The result is an at-a-glance map of high-interest and low-interest price zones: thick clusters mark areas where the market spent time and volume (potential support/resistance), while thin or empty rows mark zones price moved through quickly with little participation.
Key Features
- Flexible period grouping — build a fresh profile every day, every week, or every fixed number of bars, so profiles line up naturally with your trading session or strategy.
- Up/down volume split — every row shows both buying and selling volume side by side, giving you directional context, not just raw size.
- Point of Control (POC) — automatically marks the single price level with the most traded volume in each period, with an optional line that can extend across the whole chart as a reference level going forward.
- Value Area (VAH/VAL) — optionally highlight the price range containing a configurable percentage (default 70%) of a period's total volume, a widely used way to frame "fair value" for a session.
- Fully customizable appearance — control row height, row spacing, bar width, colors, border thickness, and how many profiles are shown at once.
- Lightweight by design — profiles are only rebuilt when a new bar forms, not on every tick, so it stays fast even on active symbols.
Who It's For
Traders who care about where volume happened, not just how much. Whether you're identifying value areas, spotting high-volume support and resistance, or building a read on accumulation and distribution zones, Alpine Volume Profile gives you a clear, configurable view of market structure that price action alone doesn't show.
Settings At a Glance
| Category | What You Control |
|---|---|
| Period | Grouping mode (Daily / Weekly / Custom Bars), bars per profile, max profiles shown |
| Volume | Tick or real volume, row height (auto or fixed) |
| Appearance | Max row width, row fill %, up/down colors, border width |
| POC | Show/hide, color, width, line style, extend to chart edge |
| Value Area | Show/hide, value area %, line colors and style |
Drop it on any chart, pick your period, and let it draw.