
Channel Studio
- Experts
- Versione: 1.3
- Aggiornato: 3 settembre 2026
- Attivazioni: 5

Channel Studio — you draw it, the EA trades it
Two tools in one: a full vector markup editor that lives on the chart, and a semi-automatic expert advisor that trades what you have drawn.
You do not tune parameters and you do not hand your account to a black box. You mark up the chart exactly the way you already do it by eye, and the EA takes over only the execution: it waits for the touch, opens the trade, trails the stop along your curve and reverses according to a rule you described in advance.
Everything is rendered on a canvas rather than with terminal objects: lines are anti-aliased, nothing blinks and nothing slows the chart down, even with hundreds of elements on it.
A Swiss Army knife for technical analysis. Not because it does everything under the sun, but because everything you actually need sits on one panel, opens in a single click and never gets in the way of the rest.
Please note: the price grows as the product matures
It is 50 USD now. Every 10 purchases the price goes up by 10 USD, up to 90 USD, and stops there.
The reason is simple. Whoever buys a brand new product buys it without a single review and essentially takes the author at his word. That is a risk, and the early price is what pays for it. As the product collects reviews and updates, the risk goes away and the price moves up to a normal one.
What you can draw
- Line — two points, extended to the right.
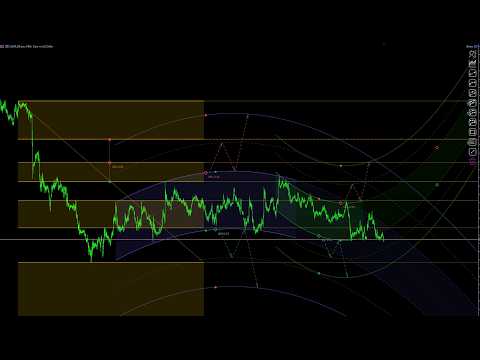
- Parabola — three points. The main instrument here: real trends are almost never straight.
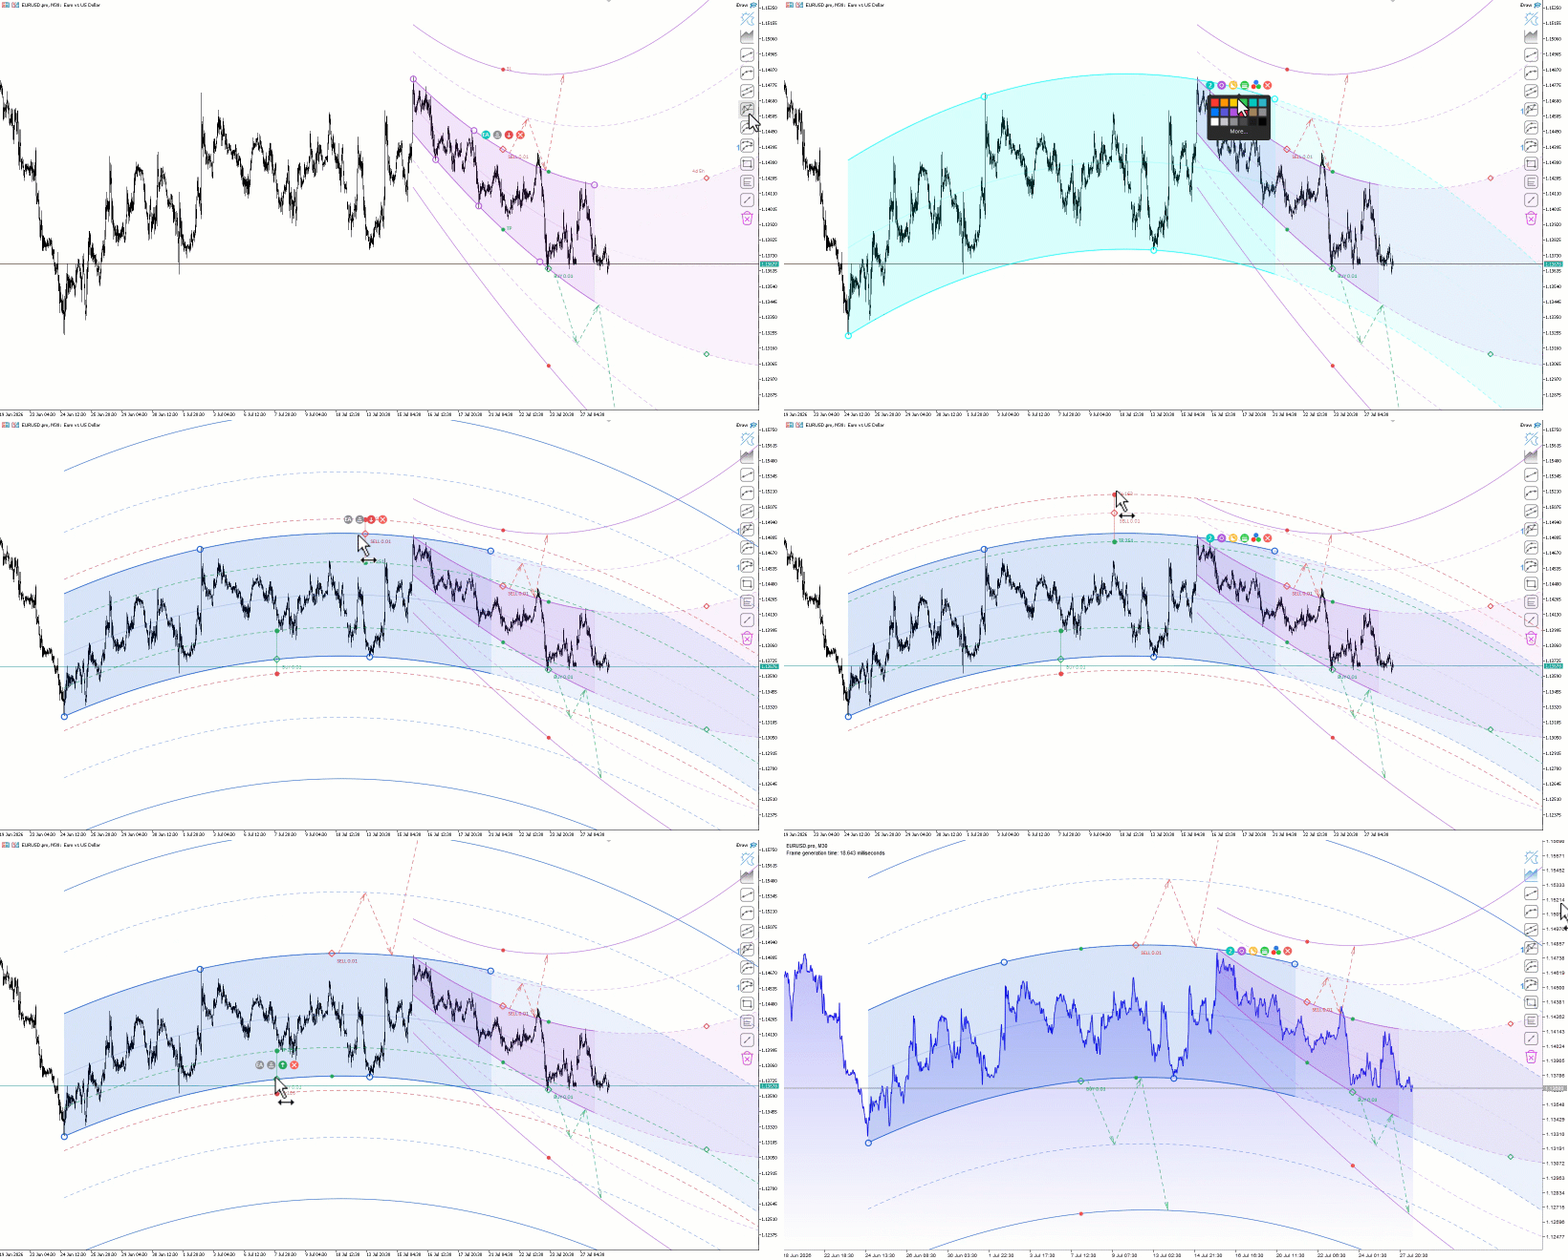
- Linear channel — two points set the direction, the third one sets the width.
- Parabolic channel 2+2, 3+1, 3+3 — see below.
- Rectangle — a zone, a consolidation area.
- Fibonacci levels — nine levels, with a separate family of projections.
- Fibonacci fan — the classic one, on two points.
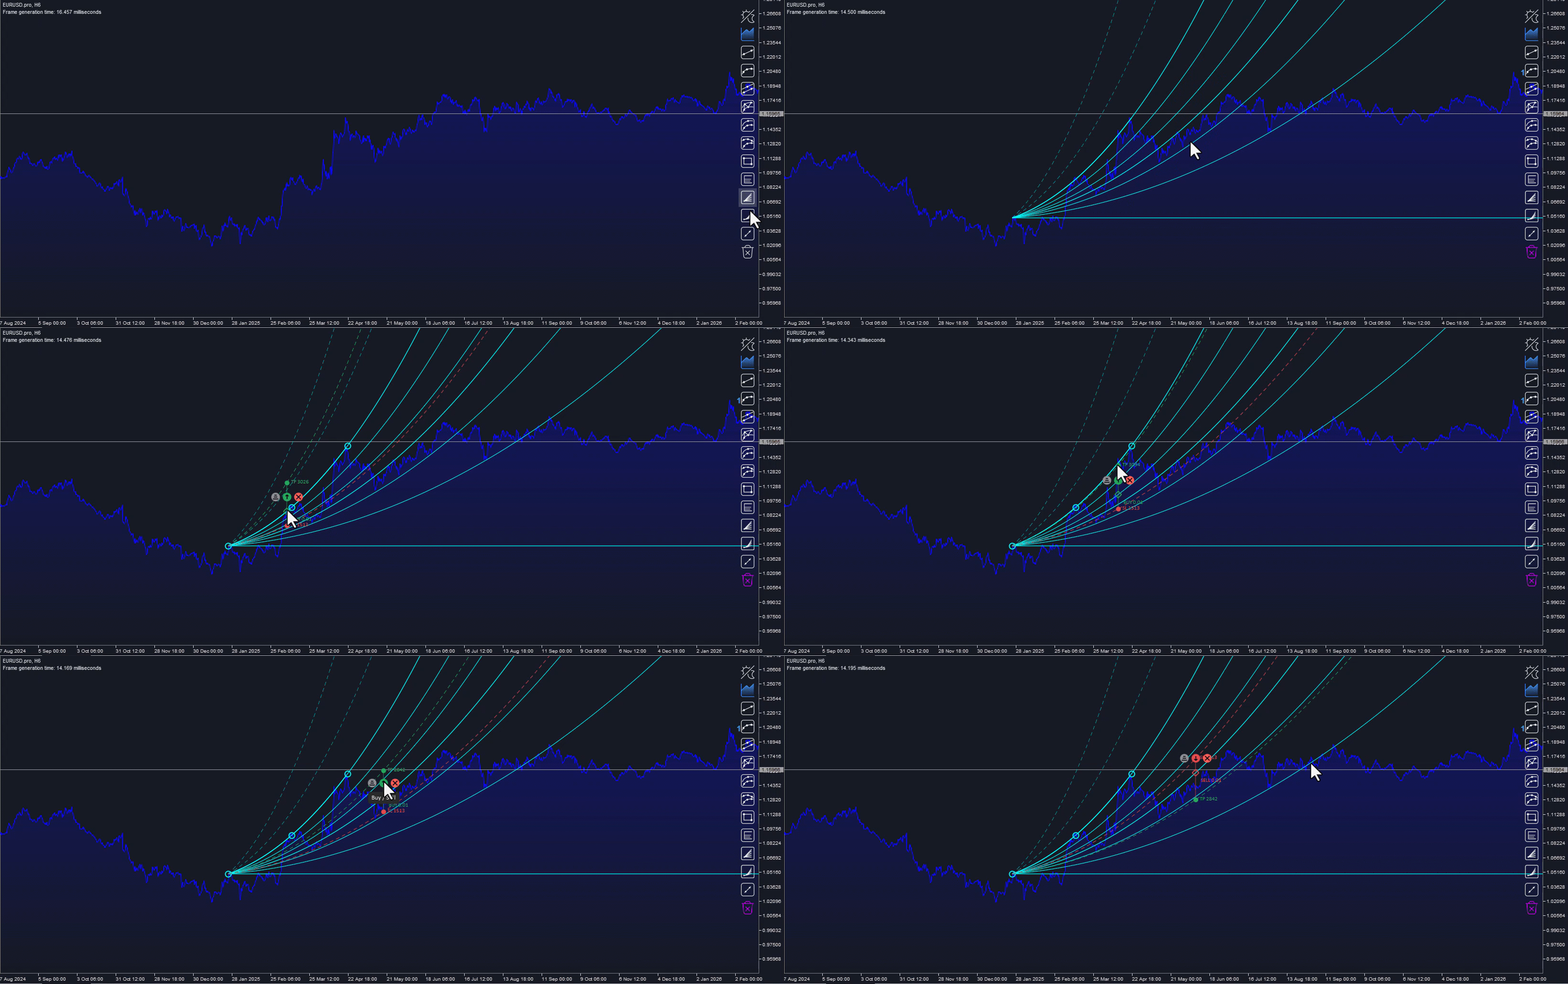
- Parabolic fan — on three points. You will not find this construction anywhere else.
- Measure tool — price, percent, bar count and time between two points.
Plus a chart of its own drawn on the canvas, light and dark themes, a colour and thickness palette for every element, and a collapse button for the element panel — the markup stays, the panel goes away.
Three kinds of parabolic channel
The difference is how much freedom you give each boundary.
2+2 — four points: the first and the third sit on one boundary, the second and the fourth on the other. Both boundaries stay strictly parallel, they share the same curvature, and the solution is fitted to all four points at once. Use it when both boundaries are clearly visible but neither of them runs through three obvious extremes.
3+1 — the first three points define one boundary rigidly, the fourth simply pushes the parallel one away from it. Use it when one side of the channel is confirmed by three touches while the opposite side is only guessed from a single one.
3+3 — six points and two independent parabolas. The boundaries are not parallel: the channel may widen or converge. The most flexible one and the most demanding about markup. Keep in mind that a converging channel has a point where its boundaries cross, and trading near it is not an option — the EA has a width guard for exactly that case.
Channel projections
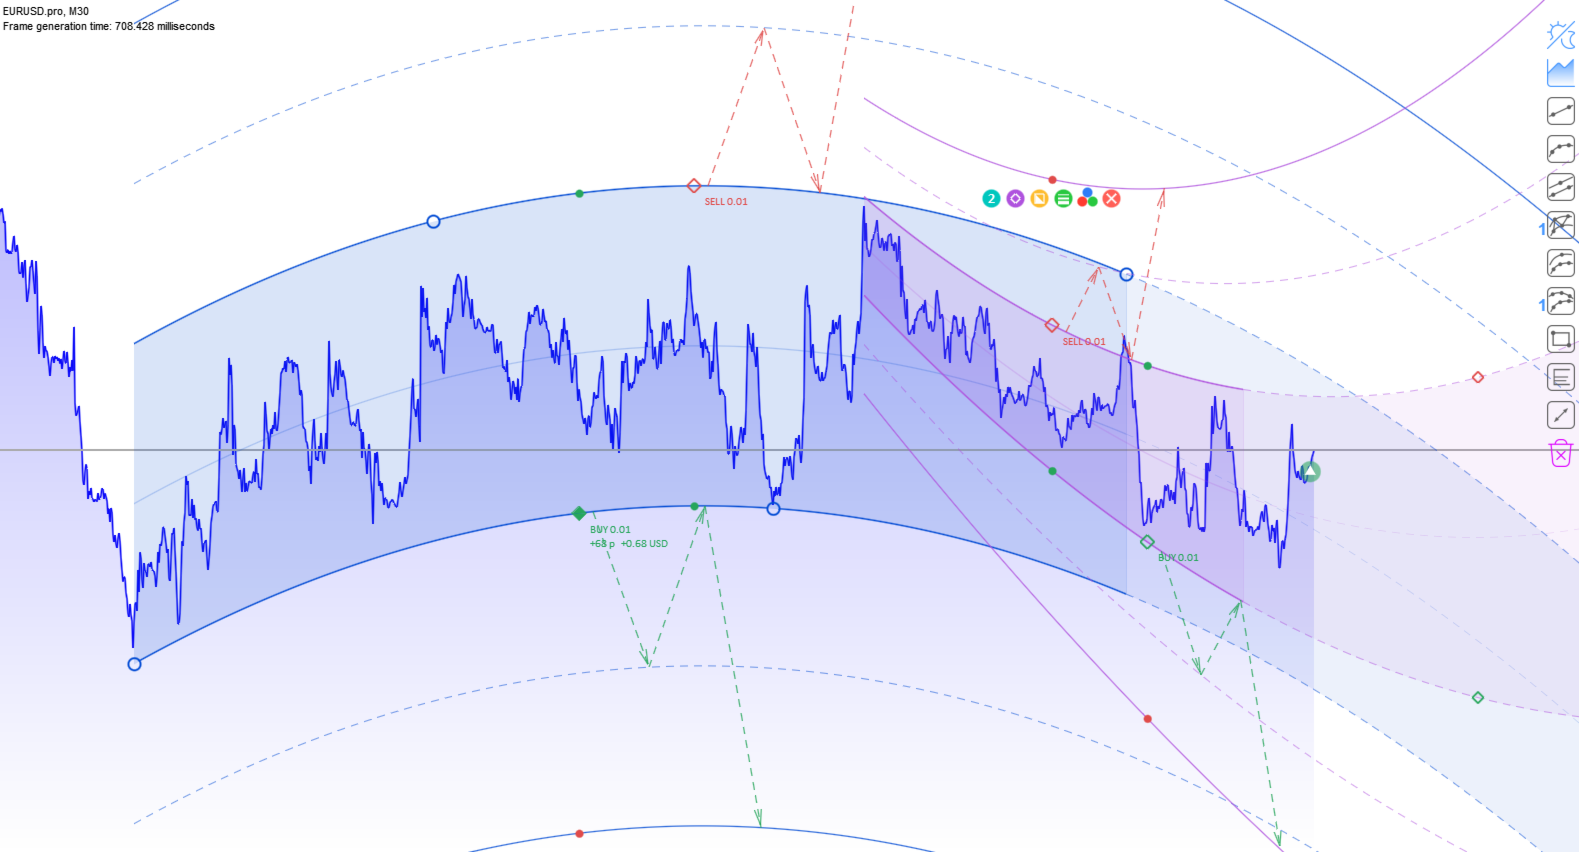
The 2 button in the channel submenu adds four lines outside it. Count them like this: the centre of the channel is level 0, the boundaries are 1 and −1. Then levels 2 and −2 are added as dashes, and levels 3 and −3 as solid lines.
Level 3 stands exactly one channel width away from the boundary — it is a copy of the channel placed outside it, and level 2 is the middle of that copy. Here is the observation the whole thing was built for: after breaking out of a channel, price often reaches level 2, comes back to boundary 1, and only then goes for level 3.
Fibonacci fan and parabolic fan
Both tools build a diverging pencil of rays using the same nine ratios as the retracement grid: 0.236, 0.382, 0.5, 0.618, 0.786, 1, 1.618 and 2.618. There is no second scale to keep in mind — these are two representations of one and the same partition.
The Fibonacci fan is the classic construction on two points. The rays leave the start of the impulse, and on the vertical of the second point the ray of ratio k arrives at exactly ratio k of its height.
The parabolic fan is the same thing built on a parabola through three points instead of a line through two.
Price rarely moves in a straight line: an impulse accelerates, a retracement slows down. A straight fan ignores that by construction — it only knows one slope. A parabolic fan inherits the curvature of the move itself: the three points you place define it, and every ray repeats it.
The geometry here is exact rather than eyeballed. The ray of ratio k is the base parabola compressed vertically toward the anchor point:
y(k, x) = y₀ + k · ( P(x) − y₀ )

    P(x) — the parabola through the three points you placed
    y₀   — the price at the anchor, that is, at the first of them
Three properties follow from that:
- every ray leaves the anchor;
- at k = 1 the ray passes exactly through the third point;
- at zero curvature the expression degenerates into an ordinary Fibonacci fan. The classic fan is a special case of this one. Put the middle point on the straight line between the outer two and you get the familiar construction precisely.
And one property a straight fan does not have at all. The rays of a parabolic fan converge twice: at the anchor, and once more at
x = 2 · x_vertex − x_anchor
that is, at the mirror image of the anchor about the vertex of the parabola. This point lies in the future and is fully determined by the three points you placed: you cannot move it without moving them. What it means for your particular market is yours to decide — the tool simply shows it honestly.
Trade marker
Select a line, a parabola, a channel, a Fibonacci grid or a fan and press the purple diamond button. On a channel the markers appear on both boundaries at once, each with a trade of its own.
- diamond — the entry price. It slides along the curve; with Shift held it moves across, setting the entry offset from the boundary (on a channel, no further than half its width);
- green handle — take profit, red one — stop loss. The side the green one is on defines the direction: drag it across the line and the trade flips;
- hollow diamond on the right — the expiry. The levels break off at it: up to that point the trade waits for price, beyond it does not. Drag it to the right edge and the trade never expires;
- in the marker submenu: delete, BUY/SELL, volume slider.
The key difference from the terminal's own pending orders: take profit and stop loss are not horizontals, they are parallels of your curve. On a parabola that gives you a trailing stop following its bend without a single setting to configure.
On a fan the rule is different, and it could not be otherwise. A parallel to a ray would cut across the neighbouring rays, and instead of markup you would get a grid. So here the target and the stop become rays of the same fan: they diverge from the anchor together with the rest and never cross them anywhere. The price of that is this: the distance between the levels grows as you move away from the anchor — linearly on a straight fan and quadratically on a parabolic one. It is not a side effect but the geometry of a fan: there simply are no other non-crossing curves in this family.
An open position is labelled right at the marker: the result in points and in the account currency, and at the actual entry point there is a semi-transparent ball with an arrow, so the gap between the intent and the execution is visible.
Keyboard
Shift is the only modifier in the whole tool. Without it the diamond moves along the curve, with it across: on a channel that is the entry offset from the boundary, on Fibonacci levels and on a fan it is a jump from one level to the next.
Digits 0…8 pick the instrument: line, parabola, linear channel, channels 2+2, 3+1, 3+3, rectangle, Fibonacci levels, measure tool. The N key starts a new element of the selected type — the same as clicking the icon in the menu, only without taking your hand off the keyboard.
Marker on Fibonacci levels
Here the role of the boundary is played by a level: the diamond sits on one of the nine and snaps to them when dragged with Shift — there are no positions in between, the levels themselves are what you trade. The default is 0.618.
The direction is not asked for: the impulse is defined by the order of the points, from the first to the second, and a retracement is traded in the direction of the impulse. The target and the stop stay ordinary handles; there is no built-in logic on Fibonacci — the markup is yours to trade.
A selected marker tells you where price stands on the ladder right now, for example now 0.552. A Fibonacci grid is drawn once the retracement has already begun, and that number shows whether it is still going deeper or has already turned.
On a fan everything works the same way, except the steps are rays instead of horizontals. On a parabolic fan the marker sits on ray 1 by default — that is, on the very curve you built through your three points.
EA mode
The EA button appears in the marker submenu once the channel has its projections turned on — without levels 2 and 3 the logic has nothing to lean on.
In this mode the marker stops being a single order and becomes a small trading system. The entry is always at the channel boundary, and the direction is defined by where price came from:
- came from inside the channel (from level 0) — we work inward: target at the opposite boundary, stop at level 3;
- came back from outside (from level 2) — we work outward: target at level 3, stop at the opposite boundary.
The target and the stop always stand exactly one channel width away from the boundary, in opposite directions. The "breakout — pullback — reversal" pattern then falls out on its own: once price has gone outside the channel and come back, the direction changes and the EA flips the trade.
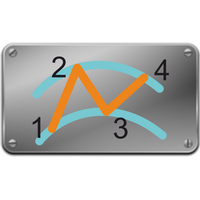
The logic is drawn on the chart: three dashed arrows in a zigzag show the path 1 → 2 → 1 → 3.
One channel holds no more than one position at any moment. An opposite one is closed, a same-direction one is not opened at all.
Input parameters
| Parameter | What it does |
|---|---|
| Fill 0..1 | Fill transparency. Zero turns the fill off completely. |
| Max lot | The ceiling of the volume slider. Also a safety catch: the marker will never place more than this. |
| TP/SL mode | Virtual — the EA keeps the stops itself and the server knows nothing about them. Real — they sit on the server and protect the position even with the terminal closed, but they have to be pulled along constantly as price moves along the curve. |
| Magic number | The EA's trade tag. |
| Slippage | Allowed slippage, in points. |
| Level tolerance | The tolerance for hitting a level, in fractions of the channel half-width. An exact touch may never happen. |
| Min channel width | Trading is blocked in a channel narrower than the given number of spreads. Zero disables the check. |
Recommendations
Start on a demo account with the minimum lot. The EA executes your markup literally; a mistake in the markup becomes a mistake in money.
Draw the channel on the timeframe you intend to trade. The marker remembers it and counts in the bars of that timeframe, so you may look at the chart from any other one — but whether the markup makes sense is up to you.
Do not lower Min channel width without a reason. Three spreads is already not much.
Several channels of different scale on the same symbol work together and do not interfere with each other: each of them has its own position.
A hedging account is preferable. On a netting account the positions of different markers merge into one and the tracking falls apart — the EA will warn you about that in the log.
Closing a position by hand does not switch the marker off — it will keep waiting for the next touch. To stop it, remove the marker or turn EA mode off.
There is a guard against trading in EA mode when the channel is too narrow or the spread has widened badly — that is, when the width is below three spreads. In that case no trade is opened.
When placing a marker on a fan, do not crowd the anchor. The rays converge there, so the distances to the target and to the stop come close to zero. The further right of the anchor you go, the more room the trade has.
About the strategy tester
The drawing side cannot be evaluated in the tester. The event model there is cut down: the mouse and the chart events are not available to an expert, so you can neither draw a channel nor place a marker in the tester. All of that works on a live chart only.
To pass the Market's automatic check, which requires an expert to perform trading operations, the EA builds a markup itself when it runs in the tester: a horizontal linear channel over the range of the recent bars and two markers in EA mode. This is not the product's strategy — it is a primitive stub for the sake of validation. The value of the tool is in your markup, not in it.





































L'utente non ha lasciato alcun commento sulla valutazione.