Currency Strength Indicator with Action Dashboard

Sistema Professionale RSI MTF Dashboard per la Forza delle Valute (MT4)

1. Motore della Forza delle Valute

Una singola valuta non può essere negoziata in modo indipendente; viene sempre scambiata attraverso una coppia valutaria.

Per questo motivo, il sistema calcola la forza assoluta di ogni valuta analizzando le 28 principali coppie formate dalle 8 valute principali:

USD - Dollaro statunitense
EUR - Euro
GBP - Sterlina britannica
JPY - Yen giapponese
AUD - Dollaro australiano
CAD - Dollaro canadese
CHF - Franco svizzero
NZD - Dollaro neozelandese

L'indicatore utilizza l'RSI (Relative Strength Index) come base del calcolo perché è naturalmente normalizzato tra 0 e 100, permettendo un confronto corretto tra coppie con scale di prezzo differenti.

Formula di Calcolo della Forza

Quando la valuta è la valuta base:

Esempio:

EUR/USD

Calcolo:

Strength = RSI(EUR/USD)

Quando la valuta è la valuta quotata:

Esempio:

USD nella coppia EUR/USD

Calcolo:

Strength = 100 - RSI(EUR/USD)

La forza finale della valuta:

Currency Strength =

La media della forza di tutte le 7 coppie in cui la valuta è presente.

Risultato:

0 - 100

Classificazione della Forza

Oltre 70:

Estremamente forte (forte momentum rialzista)

60 - 70:

Moderatamente forte

40 - 60:

Neutrale

30 - 40:

Moderatamente debole

Sotto 30:

Estremamente debole (forte momentum ribassista)

2. Analisi Multi-TimeFrame (MTF)

Il sistema calcola la forza di ogni valuta indipendentemente sui seguenti timeframe:

M1

M5

M15

M30

H1

H4

D1

W1

MN

Dai calcoli MTF vengono ottenuti:

Average Strength (Forza Media)

La media della forza della valuta su tutti i timeframe analizzati.

Momentum

Misura la velocità di variazione della forza:

Momentum =

Forza media attuale - Forza media precedente

Acceleration (Accelerazione)

Misura il cambiamento del momentum:

Acceleration =

Momentum attuale - Momentum precedente

Direzione del Trend

UP (Trend rialzista)

Condizione:

Momentum > +0.5

DOWN (Trend ribassista)

Condizione:

Momentum < -0.5

FLAT (Mercato laterale)

Condizione:

-0.5 ≤ Momentum ≤ +0.5

3. Dashboard Professionale in Tempo Reale

La Dashboard viene visualizzata direttamente sul grafico principale.

Le valute vengono ordinate automaticamente:

Dalla più forte → alla più debole

Colonne della Dashboard:

Rank (Classifica)

Currency (Valuta)

M1

M5

M15

M30

H1

H4

D1

W1

MN

Average Strength

Momentum

Acceleration

Trend

Best Pair

Spread

Signal

Interpretazione della Forza

Forza ≥65:

Valuta forte

Forza ≤35:

Valuta debole

Segnali:

BUY (Acquista)

SELL (Vendi)

WAIT (Attendere)

Funzione Best Pair

Trova automaticamente la migliore coppia valutaria basata sulla maggiore differenza di forza tra due valute.

4. Motori di Analisi Tecnica sul Grafico

Tutti gli elementi tecnici vengono visualizzati direttamente sul grafico principale per evitare finestre aggiuntive.

Moving Average Engine

Disegna automaticamente:

EMA 20

EMA 50

EMA 100

EMA 200

Caratteristiche:

  • Colori personalizzabili

  • Nome di ogni EMA visualizzato sul lato destro del grafico

Fibonacci Engine

Rileva automaticamente:

Swing High (massimo significativo)

Swing Low (minimo significativo)

Disegna i livelli Fibonacci:

23.6%

38.2%

50%

61.8%

78.6%

100%

161.8%

261.8%

I livelli vengono aggiornati automaticamente quando vengono creati nuovi massimi e minimi importanti.

Support & Resistance Engine

Analizza automaticamente:

  • Frattali

  • Massimi e minimi giornalieri

  • Massimi e minimi settimanali

  • Massimi e minimi mensili

  • Pivot Points

I livelli vicini vengono raggruppati creando:

Zone di Confluenza

Classificazione della forza delle zone:

★★★☆☆

★★★★☆

★★★★★

Più fattori tecnici coincidono, maggiore sarà l'importanza della zona.

5. Motore Intelligente dei Segnali

Il sistema non utilizza solamente la forza delle valute per generare segnali.

Un segnale viene creato solo quando più condizioni sono confermate contemporaneamente.

Condizioni BUY

1. Conferma della Forza Valutaria

La valuta base deve essere forte:

Base Currency Strong

La valuta quotata deve essere debole:

Quote Currency Weak

Condizione:

Strength Spread > Threshold

2. Conferma del Trend

Prezzo:

Price > EMA50

Price > EMA200

Indica un trend rialzista.

3. Conferma delle Medie Mobili

EMA20 > EMA50

Conferma il momentum rialzista.

4. Conferma del Supporto

Il prezzo deve essere vicino o reagire da una zona di supporto con alta confluenza.

5. Conferma Fibonacci

Reazione del prezzo dai livelli:

38.2%

50%

61.8%

Il sistema calcola:

Confidence Score

Valore:

0% - 100%

In base al numero di condizioni soddisfatte.

Sistema di Alert

Supporta:

  • Avvisi popup

  • Avvisi sonori

  • Notifiche Push sul cellulare

  • Email

6. Ottimizzazione delle Prestazioni

Per garantire un funzionamento fluido su MT4/MT5:

Timer Throttling

Aggiornamento Dashboard:

Ogni 3 secondi

New-Bar Trigger

I seguenti calcoli vengono eseguiti solo alla formazione di una nuova candela:

  • Fibonacci

  • Supporti e Resistenze

Ottimizzazione MT5

Durante l'inizializzazione:

  • Creazione degli Indicator Handles

  • Lettura veloce dei dati tramite CopyBuffer()

Auto Broker Symbol Resolver

Riconosce automaticamente i suffissi dei broker:

EURUSD

EURUSD.m

EURUSD.pro

EURUSD.ecn

EURUSD.fx

Senza necessità di modificare il codice.

Obiettivo Finale

Creare un sistema professionale di analisi per MT4/MT5 che integri:

  • Forza delle valute basata su RSI

  • Analisi Multi-TimeFrame

  • Momentum

  • Acceleration

  • Rilevamento del trend

  • Analisi EMA

  • Fibonacci automatico

  • Supporti e resistenze intelligenti

  • Dashboard in tempo reale

  • Segnali intelligenti BUY/SELL

  • Sistema avanzato di alert

  • Compatibilità con tutti i broker

  • Ottimizzazione ad alte prestazioni

Obiettivo:

Sviluppare uno strumento avanzato di analisi del mercato simile ai sistemi utilizzati dai trader professionisti e dagli operatori istituzionali.



Prodotti consigliati
Oscillator helps determine the direction of the market Shows the direction of the price movement and is painted in the appropriate color. Allows you to conduct trend and counter trend trading It works on all timeframes, on any currency pairs, metals and cryptocurrency Can be used when working with binary options Distinctive features Does not redraw; Simple and clear settings; It works on all timeframes and on all symbols; Suitable for trading currencies, metals, options and cryptocurrency (Bitco
Knowledge of the strength and weakness of each currency is vital for every forex trader. Our   Currency Strength Meter indicator   measures the strength of eight major currencies (USD, EUR, GBP, CHF, JPY, CAD, AUD, NZD) by using the Relative Strength Index indicator, also known as RSI. The Currency Strength Meter indicator shows you, simply and quickly, when a currency is oversold, overbought, or in "normal area". This way, you can identify which currency is the strongest and the weakest. Our
The UNIVERSAL DASHBOARD indicator will eliminate the need of using dozens of indicators on dozens of charts. From one place you can monitor all the pairs and all the timeframes for each of the following indicators: MACD STOCHASTIC WPR RSI CCI You can also use any Custom indicator in the dashboard as long as it has a readable buffer. With a single click you can quickly navigate between charts, pairs and timeframes. Alerts will provide clear indication about what happens for your favorite pairs on
FREE
Description: Pattern Pulse Pro — Price Action Pattern EA with RSI Confirmation (Swap-Free) PRODUCT OVERVIEW Pattern Pulse Pro is a professional price action trading solution designed for the MetaTrader 4 platform. It identifies key market patterns and combines them with RSI momentum confirmation for high-probability entries. The EA focuses on candlestick patterns and price levels that indicate potential reversals or continuations. WHY PATTERN PULSE PRO IS DIFFERENT Most EAs
Currency Momentum Pulse 28 Currency Momentum Pulse 28 is a multi-currency momentum indicator for MetaTrader 4 designed to visualize changes in the relative momentum of the eight major currencies: USD, EUR, GBP, CHF, AUD, CAD, JPY and NZD. Instead of analyzing only the current Forex pair, the indicator processes the 28 combinations of the eight major currencies and displays their relative momentum behavior in a single indicator window. Normal market fluctuations remain concentrated around the
FREE
The FFx Dashboard MTF alerter will show you on a single chart all the timeframes (M1 to Monthly) with their own status for the indicator. 2 Alert Options: Single timeframe: each selected timeframe alert separately when a signal occurs Multi timeframes: all selected timeframes must agree for an alert to be triggered Both options have an input to select the timeframes to be used for the alert(s). How to understand the status: Green/Red square: ADX above level Grey square: ADX below level Red bor
FTC Neuro
Aliaksandr Ausiyevich
Benvenuti nel mondo delle soluzioni di trading innovative! Presentiamo alla vostra attenzione il nostro consulente commerciale avanzato FTC Neuro , che lavora sulla base di statistiche macroeconomiche aggiornate e moderni calcoli di rete neurale. Analizzando la situazione del mercato con algoritmi sofisticati, il consulente riconosce i modelli nascosti nelle informazioni economiche utilizzando algoritmi avanzati di intelligenza artificiale. Ti offre la massima esperienza di trading professional
Multi Time Frame Multi Currency Signals Dashboard (MT4) A powerful, all‑in‑one MT4 dashboard delivering instant, high‑probability trading signals across multiple currency pairs and multiple timeframes — all from one clean, centralized chart. The Multi Time Frame Multi Currency Signals Dashboard simplifies the way you analyze the markets by unifying signals, trend conditions, and key levels into a single view. Driven by an advanced multi‑timeframe trend algorithm, it scans dozens of symbols sim
Smart Currency Strength   is a powerful yet simple indicator that measures the strength of individual currencies. It features a graphic panel that lists the main currencies and their strength in each timeframe, ranging from 0 (most oversold) to 100 (most overbought). The strength for all currencies in the current timeframe is also shown in a separate window as a multi-line graph, where each currency is represented with a different color, this allows you to monitor the evolution of strength tre
FX Power MT4 NG
Daniel Stein
4.95 (21)
FX Power: Analizza la Forza delle Valute per Decisioni di Trading Più Intelligenti Panoramica FX Power è lo strumento essenziale per comprendere la reale forza delle principali valute e dell'oro in qualsiasi condizione di mercato. Identificando le valute forti da comprare e quelle deboli da vendere, FX Power semplifica le decisioni di trading e rivela opportunità ad alta probabilità. Che tu segua le tendenze o anticipi inversioni utilizzando valori estremi di Delta, questo strumento si adatta
Zain Gold Scalping MT4 V5
Ahmed Gamal Abdel Nasser Mohamed
Zain Gold Scalping MT4 - Multi-Timeframe Technical Indicator Zain Gold Scalping MT4 is a technical analysis indicator developed for the MetaTrader 4 (MT4) platform. It provides analytical insights and multi-timeframe trend tracking for various market instruments, including precious metals and major currency pairs.  Timeframe and Market Compatibility Multiple Timeframe Support: Designed to operate across standard chart timeframes, from M1 and M5 up to higher structured timeframes like H1 and Dai
TrendSeeker Pro – Dashboard Definitivo di Trend & Punti di Inversione + Rilevatore di Range H4 Ultimate Trend & Turning Point Dashboard è un sistema completo multi-timeframe progettato per aiutare i trader a rimanere dalla parte giusta della tendenza, eliminare condizioni di mercato a bassa probabilità e fornire entrate precise ai punti di inversione con sicurezza. Non è solo un indicatore. È un vero e proprio framework di trading che risponde a tre domande critiche prima ancora di aprire una po
TSScreenBowTie
Salvatore Labriola
Expert for trading with the BowTie strategy. Intelligent algorithm for scalper and intraday traders. Multi time frame and multi currency panel.   The benefits you get: Easy-to-use panel that alerts you to crossings of moving averages, like strategy, on each currency. Possibility to choose your favorite crosses. Possibility to choose to activate only the preferred time frames. Never redesigns, does not retreat, never recalculates. Works on forex and CFD, timeframe from M5 to D1. Integrated pop-up
Market Momentum Alerter for MT4
Renaud Herve Francois Candel
Market Momentum Alerter Market Momentum Alerter will inform you about danger to operate in the market. Imagine you see a very nice setup (Forex, Stocks, Indices) and you decide to place your trade... And you finally lose your trade and don't understand what happened. This can happen due to big operations in the market carried out by banks and big institutions. These operations are invisible for most people. Now with the Market Momentum Alerter you will be able to detect those operations...
MQLTA Currency Strength Matrix
MQL4 Trading Automation
4.38 (8)
Currency Strength Matrix (CSM) is an indicator that will show you the current strength of the major currencies in several timeframes, allowing you to sort the currencies for strength and spot possible trading setups. This indicator is ideal for scalping and in all those events of sudden big moves. How does it work? The CSM compares the value of the current moving average with the same moving average in the previous candle for all the 28 pairs and all 9 timeframes, producing a Matrix of Strength
FREE
Full Forex Market View Dashboard
Opengates Success International
5 (2)
VISUALIZZAZIONE COMPLETA DEL MERCATO FOREX Indicatore del cruscotto Questo è un indicatore personalizzato creato per offrire ai trader una visione completa di ciò che sta accadendo nel mercato. Utilizza dati in tempo reale per accedere al mercato e visualizzare tutte le informazioni necessarie per fare trading di successo. INSTALLAZIONE: Prima di allegare questo indicatore al grafico della finestra, vai al pannello Market Watch del tuo MT4 e NASCONDI tutte le coppie di valute che non ti servo
Presentiamo il Ichimoku Cloud Strategy Multicurrency EA MT4, una soluzione di trading sofisticata progettata per i trader che cercano di sfruttare la potenza dell'indicatore Ichimoku su più coppie di valute. Questo consulente esperto automatizza le decisioni di trading basate su una logica di segnale robusta, rendendolo ideale sia per i trader principianti che per quelli esperti che desiderano ottimizzare le loro strategie di trading. Questo EA fornisce un quadro di trading completo, consentendo
Algo Trading Indicaor  With this indicator , you’ll have zones and trends that hight probability the price will reverse from it. so will gives you all the help that you need  MT5 Version                    https://www.mql5.com/en/market/product/170028 MT4 Version                    https://www.mql5.com/en/market/product/88034 Why should you join us !?  1-This indicator is logical since it’s working in previous days movement , to predict the future movements. 2-Algo trading indicator will hel
Ultimate ADX Multi-timeframe Indicator This indicator provides real-time ADX values for multiple timeframes in one unobtrusive label panel. It i s especially useful for gauging trend strength across timeframes without constantly switching charts. Choose which periods to display, anchor the panel to any chart corner, and color-code ADX strength levels to your taste. Key Features & Personalization Multi-Timeframe ADX - Toggle visibility for 9 built-in periods (M1, M5, M15, M30, H1, H4, D1, W1, MN1
FREE
Market Trend Strength Heatmap  Smart Structure Heatmap is a multi-timeframe trend analysis indicator designed to help traders quickly identify market direction and overall trend strength based on real time. The indicator combines several technical filters into a simple heatmap dashboard, allowing traders to view trend conditions across multiple timeframes in one place. Trend direction is displayed using color signals: Green Uptrend (buy) Red Downtrend (sell) Yellow Sideways  S
Renko Star
Abdulkarim Karazon
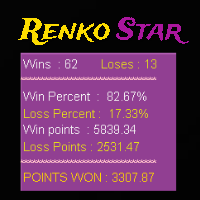
Renko Star è un indicatore di tipo freccia mt4 progettato per scambiare grafici renko, questo indicatore ha un dashboard di backtest che fornisce al trader informazioni utili come tasso di vincita e punti vinti, fornisce anche tp e sl nella moltiplicazione atr x, questo indicatore dà il suo segnale sulla barra aperta o intra bar e ha un segno giallo che segnerà il prezzo esatto in cui è stato dato il segnale, il modo per utilizzare questo indicatore è aprire un acquisto o una vendita secondo la
Gann Box MT4
Frederic Jacques Collomb
5 (1)
L'indicatore Gann Box è uno strumento potente e versatile progettato per aiutare i trader a identificare e sfruttare i livelli chiave del mercato. Questo indicatore consente di disegnare un rettangolo sul grafico, che viene automaticamente suddiviso in più zone con livelli strategici 0, 0.25, 0.50, 0.75, 1 . Quando il prezzo tocca uno di questi livelli, si attivano degli avvisi, offrendo così un aiuto prezioso per le decisioni di trading. Sapete immediatamente come si sta evolvendo il mercato ri
Super Scalp Indicator MT4    is a unique  trend reversal  100% non-repainting  multi-algo indicator that can be used on all symbols/instruments:   forex,   commodities,   cryptocurrencies,   indices,   stocks .    Super Scalp Indicator MT4    will determine the current trend at its early stages, gathering information and data from up to 10 standard algos When indicator give a valid buy or sell signal, a corresponding arrow will be printed on the chart, open trade at start of the next candle/bar
DoIt EA Monitor MT4
Diego Arribas Lopez
DoIt EA Monitor - Multi EA Performance Dashboard for MT5 Your account can be profitable while one EA quietly drags down the portfolio. MetaTrader history shows the combined result, but it does not clearly show which strategy deserves more capital and which one needs attention. DoIt EA Monitor runs on one chart and separates live and historical performance by magic number, EA and symbol. It is completely read-only. It never opens, closes or modifies a trade. KNOW WHICH EA IS EARNING ITS PLACE Aut
FREE
Email Drawdown Alert
Roman Starostin
5 (12)
Free informative Indicator-helper. It'll be usefull for traders who trade many symbols or using grid systems (Averaging or Martingale). Indicator counts drawdown as percent and currency separate. It has a number of settings: Count deposite drawdown according equity value and send e-mail or notifications to user if DD more than set; Sending e-mail when max open orders reached; Shows price and remaining pips amount before MarginCall on current chart and Account generally; Display summary trade lot
FREE
Meat EA
Roman Kanushkin
5 (1)
The Meat EA is a fully automatic, 24-hour trading system. It trades based on analysis of market movement on the basis of a built-in indicator and the Moving Average trend indicator. The system is optimized for working with the EURUSD currency pair on the M30 timeframe. It is recommended to use an ECN/STP broker with low spread, low commission and fast execution. Signal monitoring Working currency pair/timeframe: EURUSD M30. Advantages never trades against the market; the higher the risk, the hi
NeuroExtMT4
Dmytryi Voitukhov
https://t.me/mql5_neuroExt   actual version Signal  https://www.mql5.com/ru/signals/1516213 You can use any tool. The bases will be automatically created at the start of the Learn. If you need to start learning from 0 - just delete the base files. Initial deposit - from 200 ye. Options: DO NOT ATTEMPT TO TEST WITHOUT NEURAL NETWORK TRAINING! it is enough for the balance graph after training to be horizontal. generating a training base is extremely simple.  there is a ready-made training for
FREE
EMA Dashboard
Chantal Sala
1 (1)
Ema Dashboard is an innovative dashboard that allows you to monitor Moving Average on multiples symbols and different timeframes. This dashboard allows you to analyze information on 28 pairs on an unique chart. Its functionality includes analysis of All Time Frames. This configuration allows you to identify the Long Term Trend with extreme ease. This panel allows you to take very important directional movements. A click on button opens a new chart (symbol and timeframe). Graphic Object Symbol l
MP Candle Countdown indicator with a progress bar is a tool used in technical analysis that displays the time remaining until the current candlestick on a chart closes, along with a progress bar that shows visually the amount of time that has elapsed since the candlestick opened. This indicator can be helpful for traders who use candlestick charting to make trading decisions, as it provides both a visual representation of the time left until a candlestick closes and an indication of how much ti
FREE
Star Fund Ai Robot
Nirundorn Promphao
I will support only my client. สำหรับลูกค้า Star Fund Ai Robot is a safe system for Forex and Crypto currencies trading. Developed exclusively for the XAUUSD pair(GOLD), any currency pairs and any broker. Try now! The Ai Robot is designed to operate in the XAUUSD (GOLD) and any currencies market, entering only when there are high probabilities of success and certain unique conditions. The Ai Robot is based on a robust, profitable strategy and No MARTINGALE. No more indicator. You can select da
Gli utenti di questo prodotto hanno anche acquistato
Miraculous Indicator Binary & Forex v3 StrategySafe Miraculous Indicator Binary & Forex v3 StrategySafe è un indicatore professionale progettato per trader che cercano segnali chiari, strumenti di conferma avanzati e un metodo strutturato per operare sui mercati Binary e Forex. La versione v3 include MIR Dashboard, Miraculous Confirmation Dashboard, GANN Law, livelli Square of 9, angoli GANN e una modalità Forex più completa per un’analisi di mercato più precisa. Caratteristiche principali Modal
TrendMaestro
Stefano Frisetti
4 (4)
Attenzione alle truffe, questo indicatore e' distribuito esclusivamente su MQL5.com nota: questo indicatore e' per METATRADER4, se vuoi la versione per  METATRADER5 questo e' il link:  https://www.mql5.com/it/market/product/108123 TRENDMAESTRO ver 2.5 TRENDMAESTRO riconosce un nuovo TREND sul nascere, non sbaglia mai. La sicurezza di identificare un nuovo TREND non ha prezzo. DESCRIZIONE TRENDMAESTRO identifica un nuovo TREND sul nascere, questo indicatore prende in esame la volatilita' i vol


ORB Seeker
Marcela Goncalves De Oliveira
4 (1)
Prezzo speciale per limitare la disponibilità e mantenere l'interesse per il prodotto! Solo $599! Dopo l'acquisto, contattami per ricevere in omaggio l'EA ORB Seeker e i file di configurazione personalizzati e ottimizzati. Individua con sicurezza le eruzioni cutanee durante le sessioni di allenamento! ORB Seeker è un indicatore ORB (Opening Range Breakout) professionale, pensato per i trader che desiderano precisione, semplicità, flessibilità e una struttura grafica chiara. Traccia automaticam
FFx Engulfing Setup Alerter gives trade suggestions with Entry, Target 1, Target 2 and StopLoss. Below are the different options available: Entry suggestion - pips to be added over the break for the entry 3 different options to calculate the SL - by pips, by ATR multiplier or at the pattern High/Low 3 different options to calculate the 2 TPs - by pips, by ATR multiplier or at Risk/Reward Offset the dashboard - any place on the chart Remove the suggestion once the price reached the SL line Lines
FFx InsideBar Setup Alerter gives trade suggestions with Entry, Target 1, Target 2 and StopLoss. Below are the different options available: Entry suggestion - pips to be added over the break for the entry Minimum candle size - to avoid too close buy/sell entry suggestions 3 different options to calculate the SL - by pips, by ATR multiplier or at the pattern High/Low 3 different options to calculate the 2 TPs - by pips, by ATR multiplier or at Risk/Reward Offset the dashboard - any place on the c
FFx OutsideBar Setup Alerter gives trade suggestions with Entry, Target 1, Target 2 and StopLoss. Below are the different options available: Entry suggestion - pips to be added over the break for the entry. 3 different options to calculate the SL - by pips, by ATR multiplier or at the pattern High/Low. 3 different options to calculate the 2 TPs - by pips, by ATR multiplier or at Risk/Reward. Offset the dashboard - any place on the chart. Remove the suggestion once the price reached the SL line.
FFx PinBar Setup Alerter gives trade suggestions with Entry, Target 1, Target 2 and StopLoss. Below are the different options available: Entry suggestion - pips to be added over the break for the entry Minimum candle size - to avoid too small candles 3 different options to calculate the SL - by pips, by ATR multiplier or at the pattern High/Low 3 different options to calculate the 2 TPs - by pips, by ATR multiplier or at Risk/Reward Offset the dashboard - any place on the chart Remove the sugges
Automatic, live & interactive picture of all trendlines. Assign push, email and sound alerts to the lines of your choice and be informed about price rollback, breakout, rollback after breakout, number of rollbacks, line expiration by double breakout. Correct, drag or delete the lines and interactively tune the line system. https://youtu.be/EJUo9pYiHFA . Chart examples https: //www.mql5.com/en/users/efficientforex Price Interaction Events All events are effective immediately and only after one
The purpose of this new version of the MT4 standard indicator provided in your platform is to display in a sub-window multiple timeframes of the same indicator with its divergences. See the example shown in the picture below. But the display isn't like a simple MTF indicator. This is the real display of the indicator on its timeframe. Here's the options available in the FFx divergences indicator: Select the timeframes to be displayed (M1 to Monthly) Define the width (number of bars) for each tim
The purpose of this new version of the MT4 standard indicator provided in your platform is to display in a sub-window multiple timeframes of the same indicator with its divergences. See the example shown in the picture below. But the display isn't like a simple MTF indicator. This is the real display of the indicator on its timeframe. Here's the options available in the FFx divergences indicator: Select the timeframes to be displayed (M1 to Monthly). Define the width (number of bars) for each ti
The FFx Dashboard MTF alerter will show you on a single chart all the timeframes (M1 to Monthly) with their own status for the indicator. 2 Alert Options: Single timeframe: each selected timeframe alert separately when a signal occurs Multi timeframes: all selected timeframes must agree for an alert to be triggered Both options have an input to select the timeframes to be used for the alert(s). How to Understand the Status: Green/Red square: histogram above/below 0 line Green square + Red bord
The FFx Dashboard MTF alerter will show you on a single chart all the timeframes (M1 to Monthly) with their own status for the indicator. 2 Alert Options: Single timeframe: each selected timeframe alert separately when a signal occurs Multi timeframes: all selected timeframes must agree for an alert to be triggered Both options have an input to select the timeframes to be used for the alert(s). How to understand the status: Green/Red square: RSI above/below 50 line Green square + Red border: R
The FFx Dashboard MTF alerter will show you on a single chart all the timeframes (M1 to Monthly) with their own status for the indicator. 2 Alert Options: Single timeframe: each selected timeframe alert separately when a signal occurs Multi timeframes: all selected timeframes must agree for an alert to be triggered Both options have an input to select the timeframes to be used for the alert(s). How to understand the status: Green/Red square: Stoch above/below 50 line Green square + Red border:
The FFx Dashboard MTF alerter will show you on a single chart all the timeframes (M1 to Monthly) with their own status for the indicator. 2 Alert Options: Single timeframe: each selected timeframe alert separately when a signal occurs Multi timeframes: all selected timeframes must agree for an alert to be triggered Both options have an input to select the timeframes to be used for the alert(s). How to understand the status: Green/Red square: Price above/below Cloud (Kumo) Green square + Red bo
The FFx Dashboard MTF alerter will show you on a single chart all the timeframes (M1 to Monthly) with their own status for the indicator. 2 Alert Options: Single timeframe: each selected timeframe alert separately when a signal occurs Multi timeframes: all selected timeframes must agree for an alert to be triggered Both options have an input to select the timeframes to be used for the alert(s). How to understand the status: Green/Red square: MA pointing Up/Down Green square + Red border: MA po
The FFx Dashboard MTF alerter will show you on a single chart all the timeframes (M1 to Monthly) with their own status for the indicator. 2 Alert Options: Single timeframe: each selected timeframe alert separately when a signal occurs. Multi timeframes: all selected timeframes must agree for an alert to be triggered. Both options have an input to select the timeframes to be used for the alert(s). How to understand the status: Green square: Price above PSAR Red square: Price below PSAR Options
The FFx Dashboard MTF alerter will show you on a single chart all the timeframes (M1 to Monthly) with their own status for the indicator. 2 Alert Options: Single timeframe: each selected timeframe alert separately when a signal occurs Multi timeframes: all selected timeframes must agree for an alert to be triggered Both options have an input to select the timeframes to be used for the alert(s). How to understand the status: Green/Red square: CCI above/below levels (ie. 100/-100) Grey square: C
The FFx Dashboard MTF alerter will show you on a single chart all the timeframes (M1 to Monthly) with their own status. 2 Alert Options: Single timeframe: each selected timeframe alert separately when a signal occurs Multi timeframes: all selected timeframes must agree for an alert to be triggered Both options have an input to select the timeframes to be used for the alert(s). How to understand the status: Green/Red square: bullish/bearish candle Options available in the FFx Dashboard Alerter
The [GRAFF] III manual trading system is based on multiple MetaTrader (MT4) indicators. Together, the entire PACK of GRAFF III indicators makes an advanced trading tool. The system consists of over 20 different custom-built indicators which have been carefully selected and tested in the long term to produce strong and efficient trading signals. The particular indicators are based on different mathematical formulas, so the entire system is calibrated to remove false signals from its own indicator
FFx Universal Strength Meter PRO is more than a basic strength meter. Instead of limiting the calculation to price, it can be based on any of the 19 integrated strength modes + 9 timeframes. With the FFx USM, you are able to define any period for any combination of timeframes. For example, you can set the dashboard for the last 10 candles for M15-H1-H4… Full flexibility! Very easy to interpret... It gives a great idea about which currency is weak and which is strong, so you can find the best pai
A simplistic indicator informing a user on RSI divergence by sending messages to mobile device and email. The indicator draws 2 vertical lines, marking two RSI extrema that formed the divergence. You get the alert, open the charts and make a decision. The indicator does not show past divergences, thus when you attach it to a chart for the first time you see nothing. Graphics and alerts will appear as soon as divergences do. Drop it in Tester to see how it works. Parameters: RSIPeriod - number of
Pan PrizMA CD Phase is an analogue of the МetaТrader 5 indicator , and is an option based on the Pan PrizMA indicator. Details . Averaging by a quadric-quartic polynomial increases the smoothness of lines, adds momentum and rhythm. Extrapolation by the sinusoid function near a constant allows adjusting the delay or lead of signals. The value of the phase - wave status parameter (which is close in meaning to the trigonometric phase or the angle of the radius-vector rotation in the trigonometric p
Green Wall Arrows
Daniel Luchinger
1 (1)
The Name Green Wall : Arrows hits a lot of TP, by changing the idea of non using SL as something bad, but instead use Small TP and a lot of free Margin and Patience. Use micro TP and a lot of Free Margin with this indicator on Forex. It also can be used with Binary Options. This strategy is intended to be traded Manually. This Indicator runs on Open Bar, arrows will delete when price are against it. The only Indicator Parameter is Alerts true/false, all the rest is included inside the code. Arro
Golden Monowave
Ahmed Mohamed Ali
Golden Monowave is monowave indicator, the monowave theory is one of Elliott wave approach and one of most complicate and accurate method. Golden Monowave can shortcut many major steps to identify and describe the monowave. It works on any timeframe and with any trading instrument, including currencies, indices, futures, etc. Input Parameters initial_Bars - set the initial number of bars to calculate. wave_color - select the color of the wave. label_color - select the color of labels. temp_labe
Ticks Size
Viktor Kolmakov
This indicator displays in a separate window the difference between the number of points which increased the price, and the number of points that decreased the price during the time interval specified in the settings. The time interval for calculation is expressed as the number of bars of the chart the indicator is attached to. This approach allows you to evaluate the movement direction (growth or fall) of the instrument's price, the strength of the movement and the size of the movement in point
FFx Basket Scanner
Eric Venturi-Bloxs
MetaTrader 5 version available here : https://www.mql5.com/en/market/product/24882 FFx Basket Scanner is a global tool scanning all pairs and all timeframes over up to five indicators among the 16 available. You will clearly see which currencies to avoid trading and which ones to focus on. Once a currency goes into an extreme zone (e.g. 20/80%), you can trade the whole basket with great confidence. Another way to use it is to look at two currencies (weak vs strong) to find the best single pairs
NostradamusMT4
Andrey Spiridonov
1 (1)
NostradamusMT4 is a powerful indicator from the set of professional trader. The indicator is based on Andrei Spiridonov's original price calculation method (ESTIMATED PRICE) for the current candle price. Advantages The indicator does not redraw. It works on any timeframes. Works with any trading instruments. Perfectly suitable for scalping and trading binary options. Parameters Color - color of the ESTIMATED PRICE FUTURE line. How to work with the indicator The indicator forms the ESTIMATED P
Filtro:
Nessuna recensione
Rispondi alla recensione