
WaveTrend Oscillator WT Indicator
- Indicatori
- Versione: 1.0
- Attivazioni: 5

Veyra WaveTrend LB NR MT5
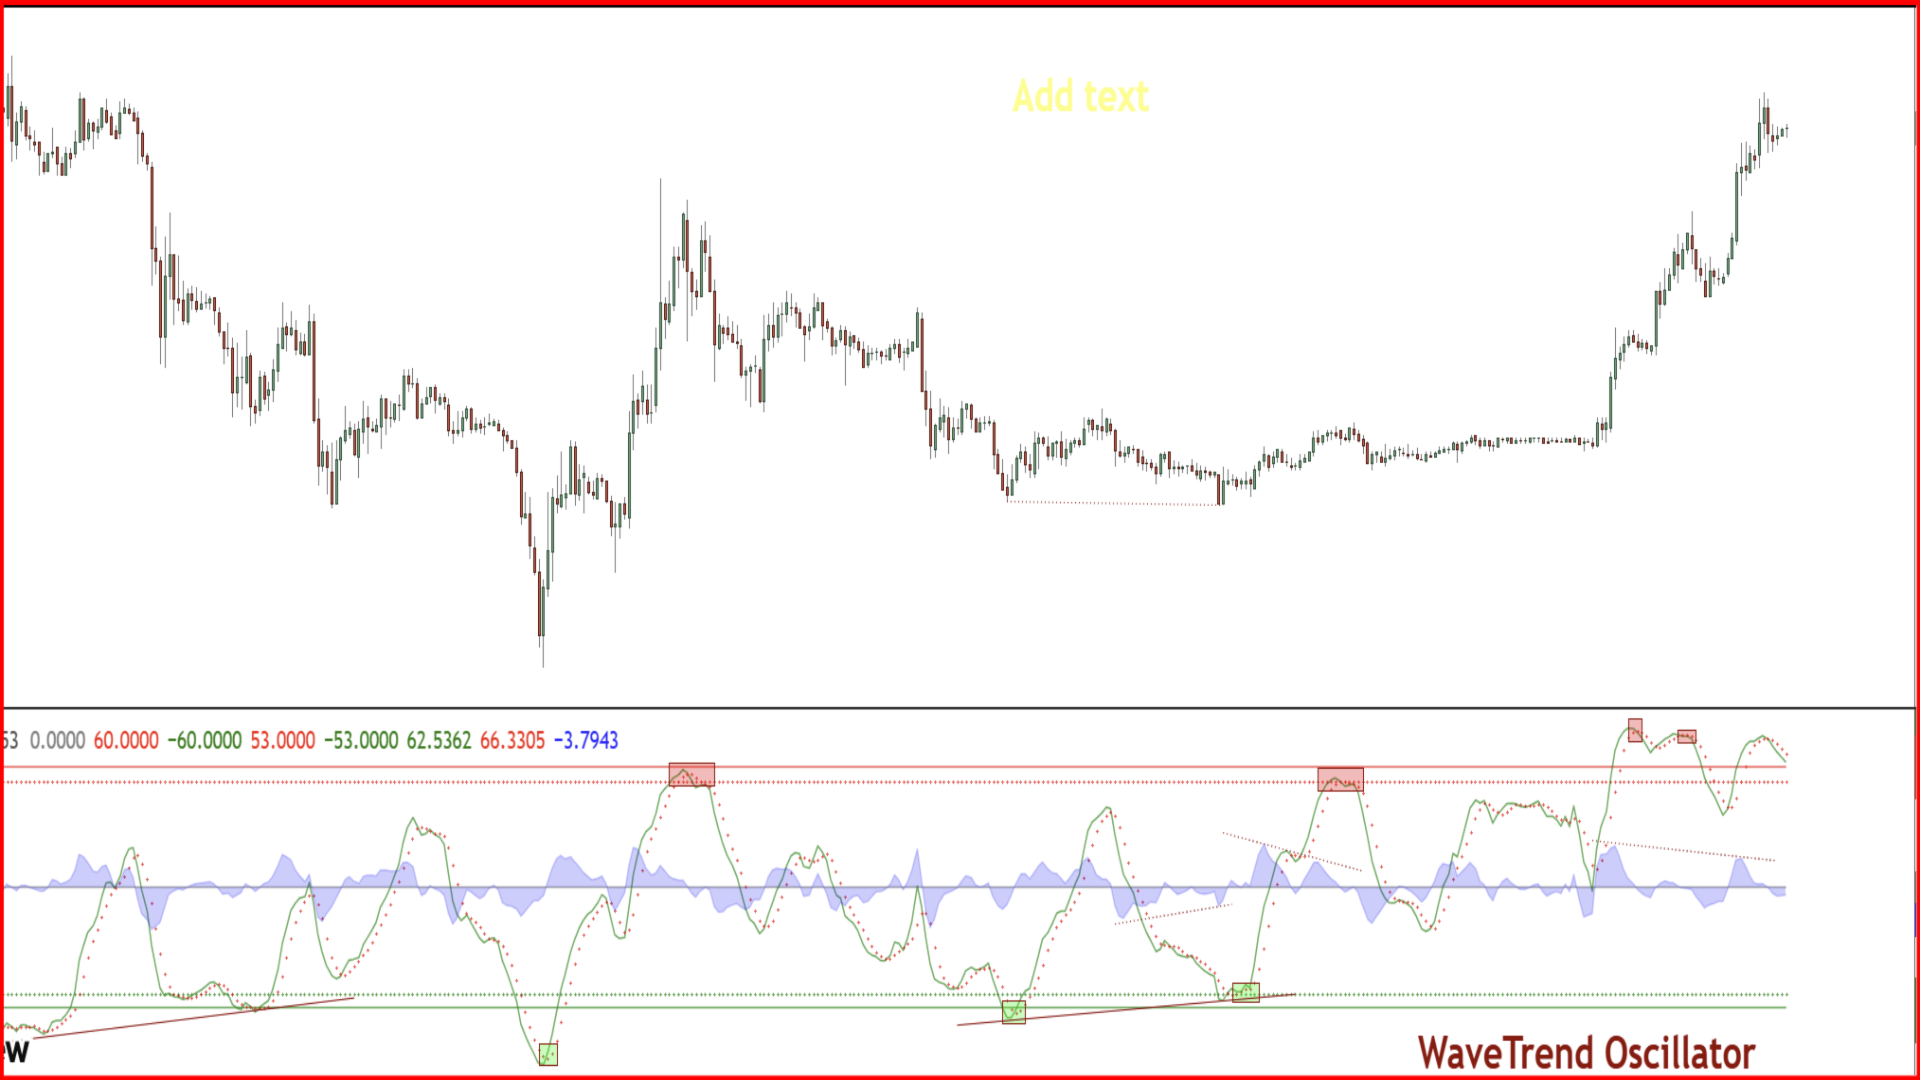
Veyra WaveTrend LB NR MT5 is a clean and lightweight WaveTrend oscillator for MetaTrader 5, designed to help traders read momentum cycles, overbought/oversold conditions, and potential turning points with a clear visual layout.
The indicator is based on the well-known WaveTrend oscillator concept, using a channel-based momentum calculation with a smoothed signal line. It is displayed in a separate oscillator window and includes the main WaveTrend line, signal line, histogram, zero line, and customizable overbought/oversold levels.
When the WaveTrend line moves above the overbought zone, the market may be entering an overheated bullish condition. When it moves below the oversold zone, the market may be entering an exhausted bearish condition. Traders commonly watch the relationship between the main line and the signal line near these zones to evaluate possible reversal or continuation opportunities.
This version does not rely on repainting signals or future candles. Values are calculated from available historical data only, and the indicator is designed to keep confirmed historical values stable.
Main Features
- WaveTrend oscillator displayed in a separate subwindow
- Main WaveTrend line and smoothed signal line
- Histogram showing the distance between WT1 and WT2
- Customizable overbought and oversold levels
- Zero line for momentum balance
- Clean visual design for manual market analysis
- Non-repaint calculation logic
- No arrows, no aggressive signal spam, and no misleading entry markers
- Lightweight and suitable for multiple symbols and timeframes
- No DLL, no WebRequest, no file access, and no trading operations
How to Use
The indicator can be used to evaluate market momentum and potential exhaustion zones.
A common interpretation is:
- When the oscillator is above the overbought area, bullish momentum may be stretched.
- When the oscillator is below the oversold area, bearish momentum may be stretched.
- Crosses between the main WaveTrend line and the signal line may provide useful context, especially when they occur near overbought or oversold levels.
- The histogram helps visualize momentum expansion or contraction between the two WaveTrend lines.
- The zero line can be used as a general momentum balance reference.
This tool is intended for discretionary analysis. It can be combined with price action, trend filters, support and resistance, market structure, or other confirmation methods.
Input Parameters
- Channel Length: Controls the sensitivity of the WaveTrend channel calculation.
- Average Length: Controls the smoothing of the main WaveTrend line.
- Overbought Level 1: Main upper extreme level.
- Overbought Level 2: Secondary upper reference level.
- Oversold Level 1: Main lower extreme level.
- Oversold Level 2: Secondary lower reference level.
- Max History Bars: Limits historical calculation for better performance.
Recommended Usage
The indicator can be used on forex, indices, metals, crypto, and other CFD instruments. It works on multiple timeframes, but users should adjust the settings according to the instrument, volatility, and trading style.
Lower timeframes may generate faster oscillator movement, while higher timeframes may provide smoother momentum context.
Important Notice
This indicator does not open, close, or manage trades. It does not guarantee profitable results and should not be used as a standalone trading system. Always test the indicator on a demo account and combine it with proper risk management before using it in live trading.






























L'utente non ha lasciato alcun commento sulla valutazione.