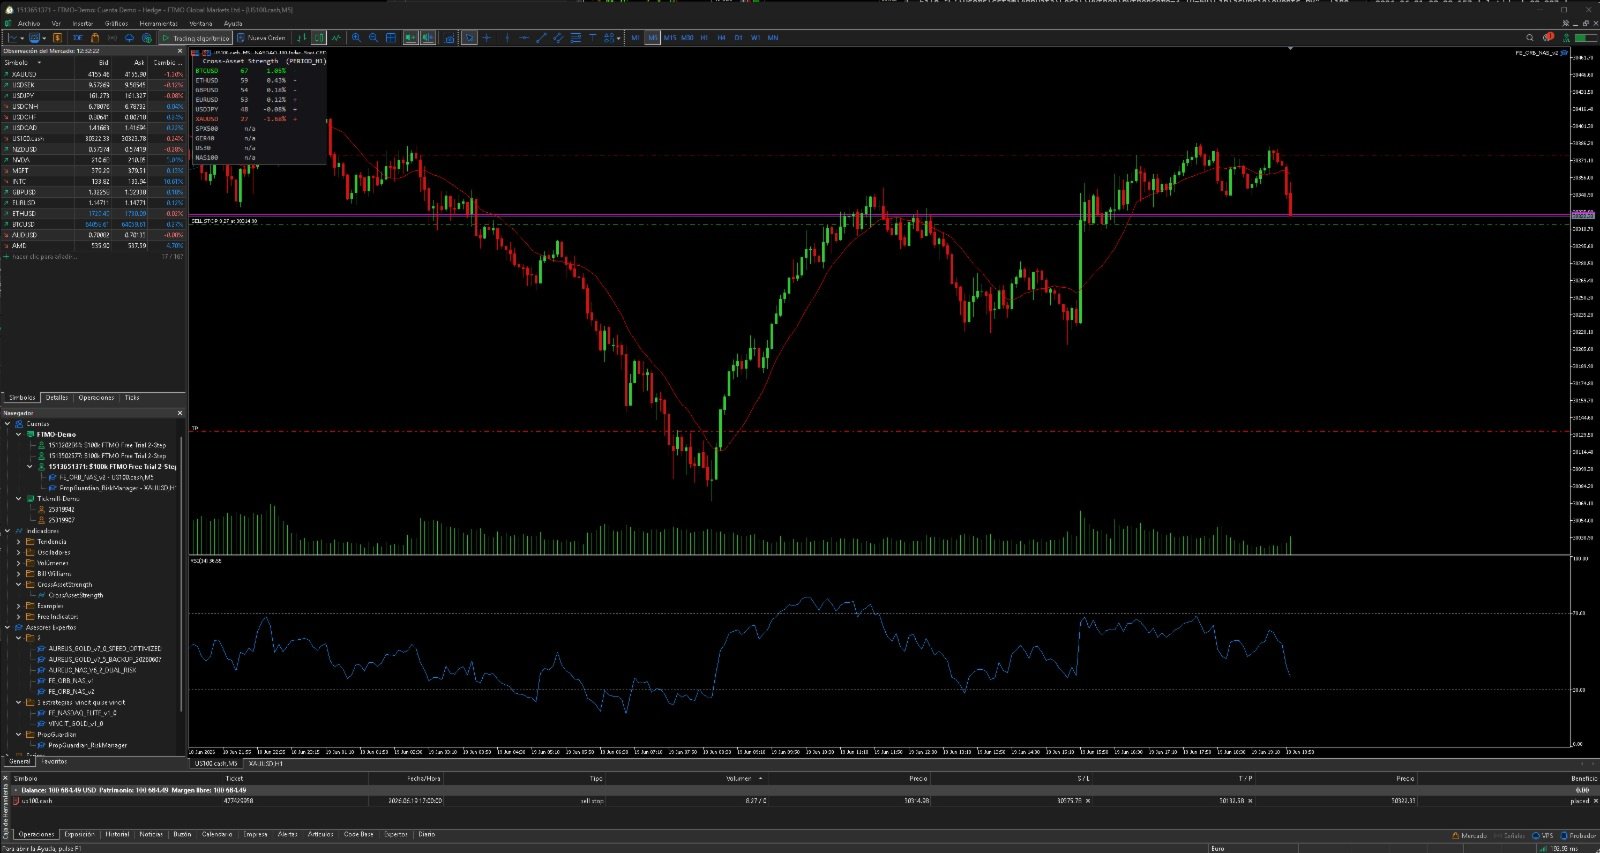
Cross Asset Strength Meter
- Indicatori
- Versione: 1.10
- Attivazioni: 10

Cross Asset Strength Meter ranks a basket of instruments by normalized momentum strength, side by side, in a single sortable dashboard. Most strength meters only cover the 8 Forex majors. This one is built to compare anything you trade at the same time: indices, metals, crypto and FX together. It does not open trades, it does not predict, and it does not repaint. It is a clean ranking tool that answers one question: which of my instruments are strongest and which are weakest right now. How it works. Each instrument is scored from a normalized momentum reading over your chosen lookback and timeframe, mapped to a 0 to 100 strength score. The dashboard lists every instrument sorted from strongest to weakest, with the score, the percentage move over the lookback, and a short term acceleration mark that shows whether the move is still building or fading. Features. Any basket of instruments in one panel: indices such as US30, NAS100, SPX500 and GER40, metals such as XAUUSD, crypto such as BTCUSD and ETHUSD, and FX majors, all ranked together. Normalized 0 to 100 strength score, comparable across instruments with very different prices. Percentage move over the lookback and an acceleration mark for each instrument. Sorted automatically from strongest to weakest. Color coded for strong, weak and neutral. Fully configurable: instrument list, timeframe, lookback, acceleration lookback, refresh interval, corner, font, colors and background. Honest behavior: if a symbol is not available on your broker it shows n a instead of inventing a value. Notes. Add your broker exact symbol names in the Symbols input. Brokers name indices and crypto differently, for example US500.cash, GER40.cash or USTEC. If an instrument shows n a, the name does not match your broker Market Watch. This is an analysis dashboard, not a signal or trading system. It does not place orders and makes no profit claim. Inputs. Symbols is the comma separated list of instruments to rank. TF is the timeframe used for the calculation. Lookback is the number of bars for the strength reading. FastLookback is the number of bars for the acceleration mark. RefreshSec is the dashboard refresh interval in seconds. PanelCorner sets the panel position, 0 top left, 1 top right, 2 bottom left, 3 bottom right. PanelX and PanelY set the panel position in pixels. FontSize and FontName set the panel font. HeaderColor, StrongColor, WeakColor and NeutralColor set the text colors. ShowBackground and BackgroundColor control the optional background panel.