Multi Timeframe Trend Scanner
- Indicatori
- Versione: 1.0
- Attivazioni: 10

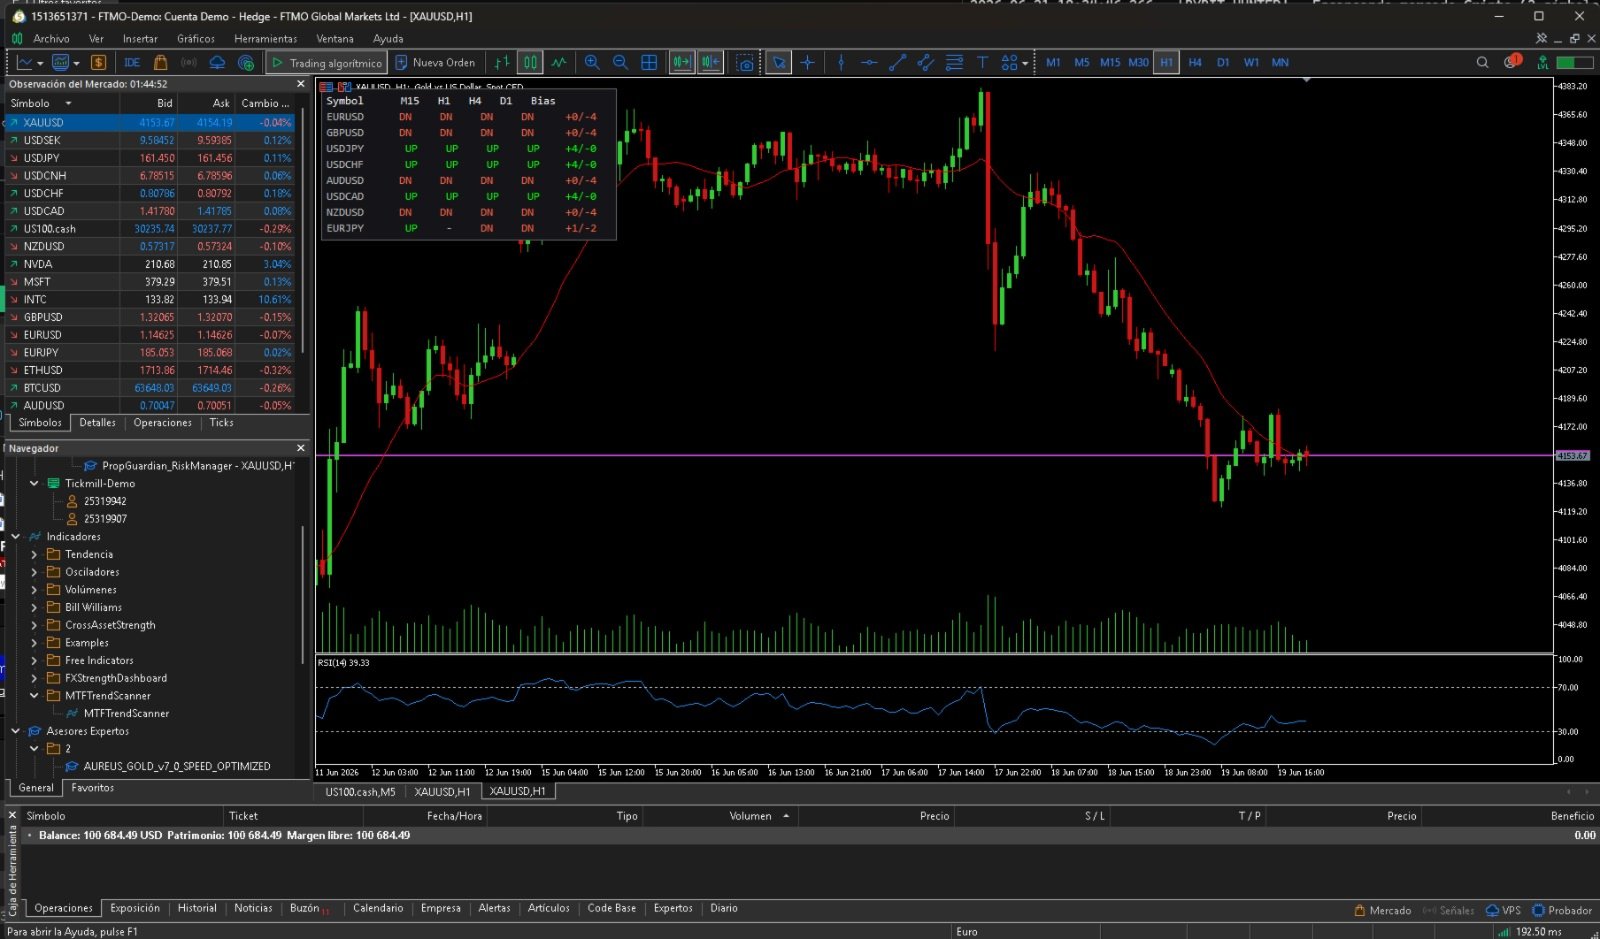
Multi Timeframe Trend Scanner shows the trend direction of each instrument across several timeframes at once, in one clean grid, plus a consensus bias column. Instead of flipping through dozens of charts, you see at a glance which instruments are aligned up, aligned down, or mixed. It does not open trades, it does not predict, and it does not repaint. The trend is read on closed bars only. How it works. For each instrument and each timeframe, the scanner compares the last closed price to its moving average. Above the average is an uptrend shown as UP, below the average is a downtrend shown as DN, and inside a small flat band it is neutral. The Bias column counts how many timeframes agree, for example plus 4 minus 0 means every timeframe is up. Features. Any list of instruments and any set of timeframes from M1 to MN1. Trend shown per timeframe in a color coded grid, green for up, red for down, gray for neutral. A consensus bias column with the up versus down count. Closed bar reading, no repaint. Works on any instruments and any broker, including indices, gold and crypto when you add your broker symbol names. Honest behavior, a cell shows n a while its history is still loading or if the symbol is not available on your broker. Inputs. Symbols is the comma separated list of instruments. Timeframes is the comma separated list of timeframes to scan, for example M15,H1,H4,D1. MA_Period is the moving average period used as the trend filter. FlatPct is the size of the neutral band around the average, as a percentage. RefreshSec is the dashboard refresh interval in seconds. PanelCorner sets the panel position, 0 top left, 1 top right, 2 bottom left, 3 bottom right. PanelX and PanelY set the panel position in pixels. FontSize and FontName set the panel font. HeaderColor, UpColor, DownColor and FlatColor set the text colors. ShowBackground and BackgroundColor control the optional background panel.