CrossTrendBlend
- Experts
- Versione: 1.37

CrossTrendBlend
Cross-asset trend following — automated rotation across four markets.
Who it's for, what it delivers, minimum deposit, testing
Who it's for. Traders who want a systematic, hands-off way to ride trends across several markets at once — semiconductors, Bitcoin, gold, and the Nasdaq — without watching charts or making discretionary calls. It suits anyone looking for cross-asset diversification inside a single Expert Advisor who is comfortable accepting meaningful drawdowns in exchange for high return potential.
What it delivers. Fully automated trading across four "sleeves," each with its own signal; daily position reconciliation; even exposure allocation; and built-in capital protection. Manual timing and emotion are removed — the algorithm makes the decisions.
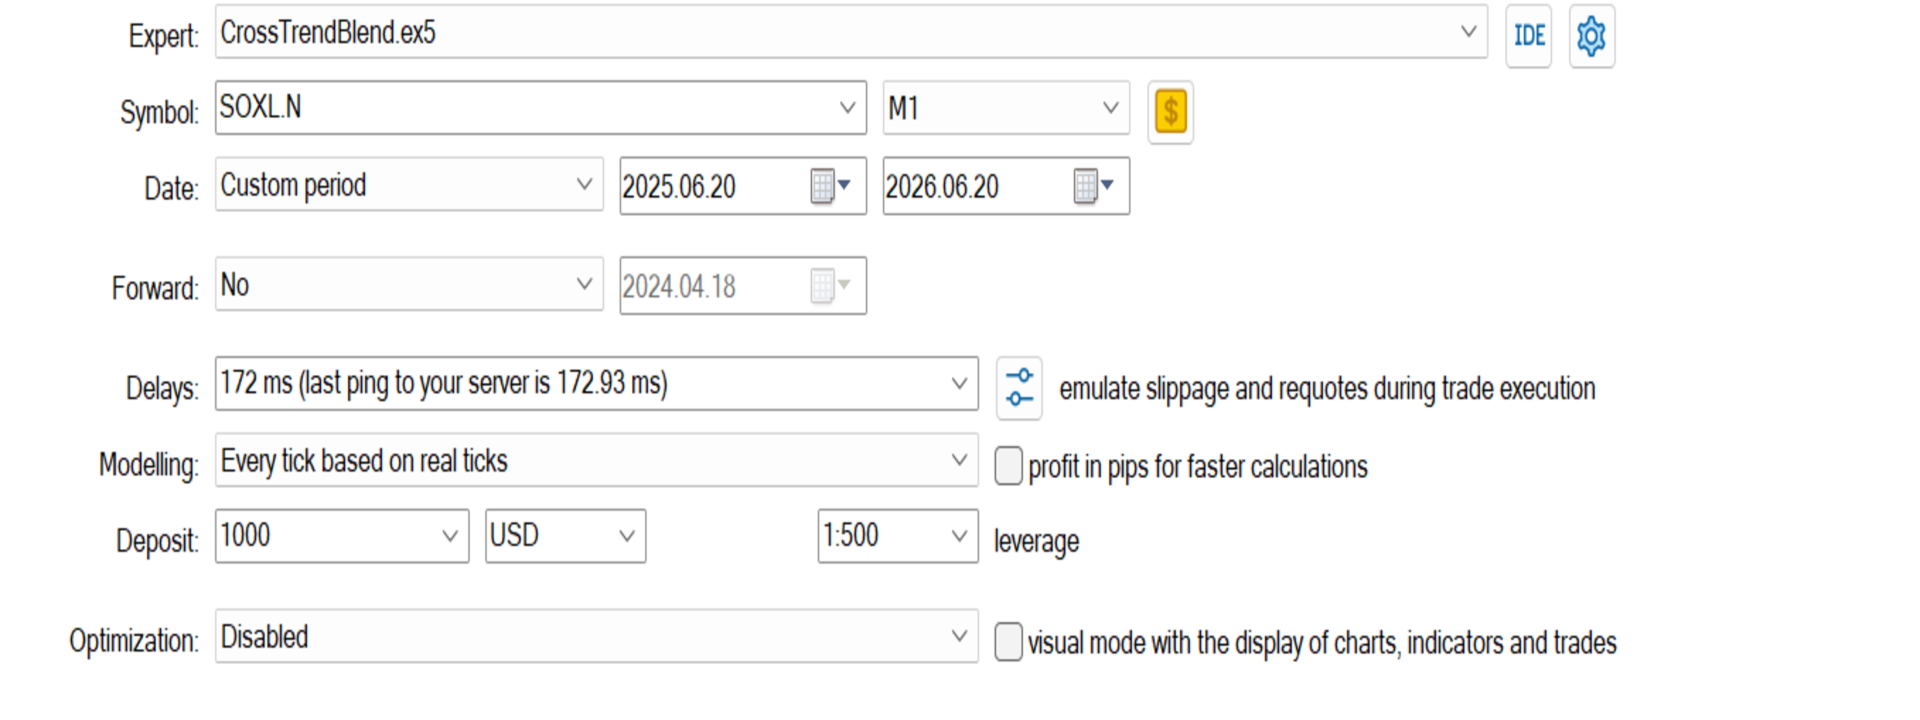
Minimum deposit: from $1,000 (the backtest was run on exactly $1,000; a larger balance rides out drawdowns more comfortably).
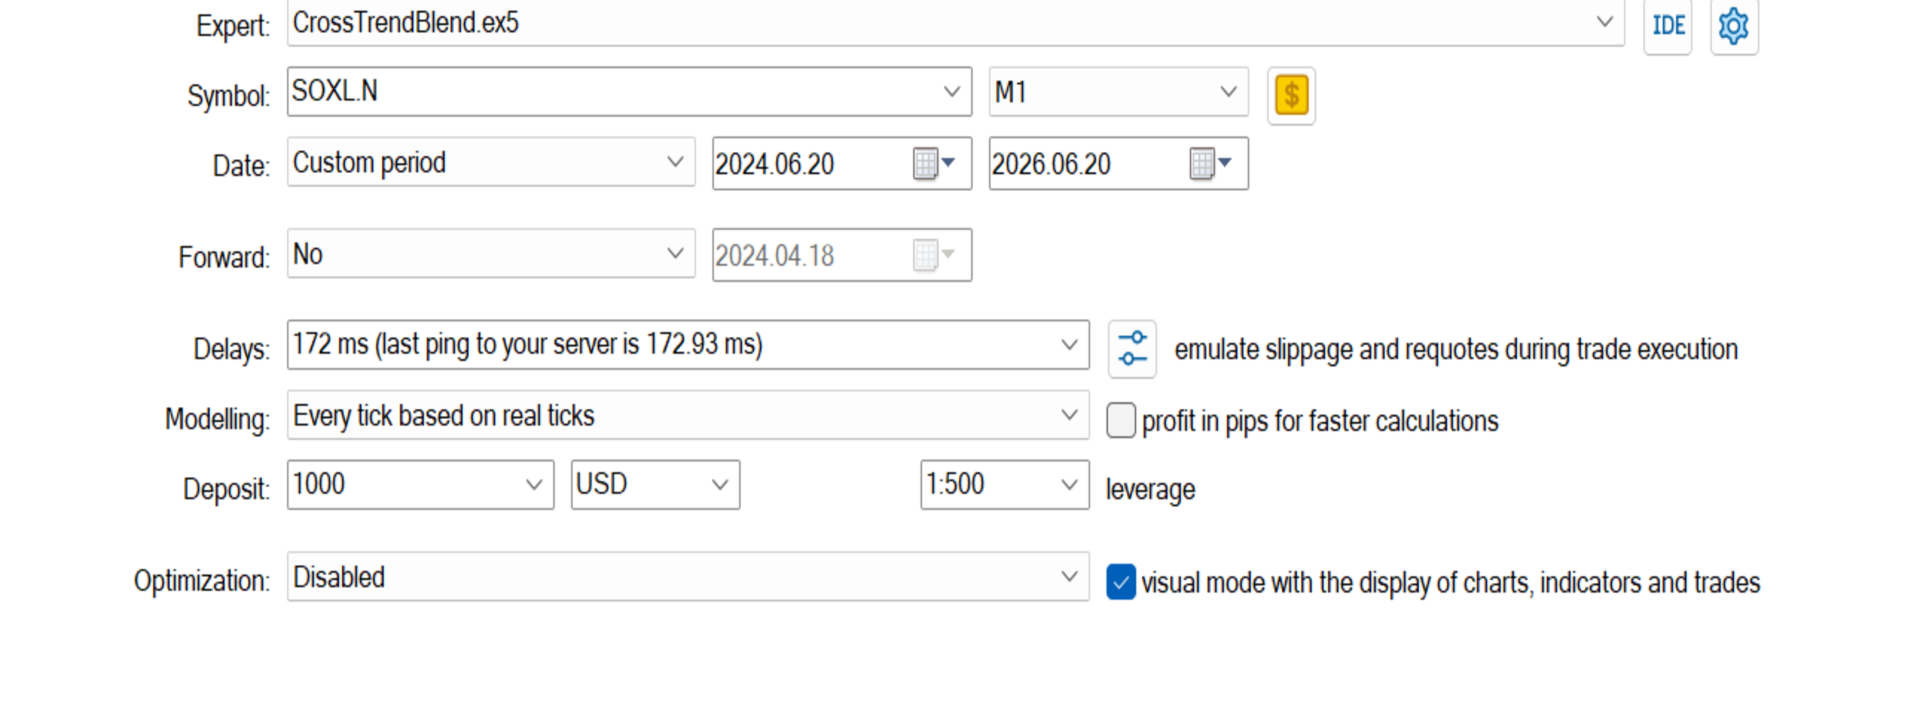
Test broker: FxPro (CFD). History quality 100%.
Leverage. Total strategy exposure is 2.15× of account equity (hardwired into the EA). Backtesting was performed on an account with 1:500 leverage.
How it works, returns, capital protection, risk
What it's built on. Four independent sleeves:
- SOXL.N — 200-day moving-average trend following (semiconductors);
- IBIT.O — 100-day moving-average trend following (Bitcoin via ETF);
- GLD.N — 200-day moving-average trend following (gold);
- QQQ.O — RSI(2) dip-buying (Nasdaq).
The 2.15× exposure is split across the sleeves; the EA trades long only and reconciles positions daily. The idea is to capture sustained trends in rising assets while adding shallow dip entries on the index, spreading risk across different markets.
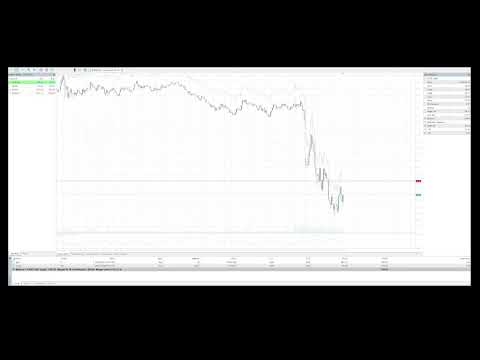
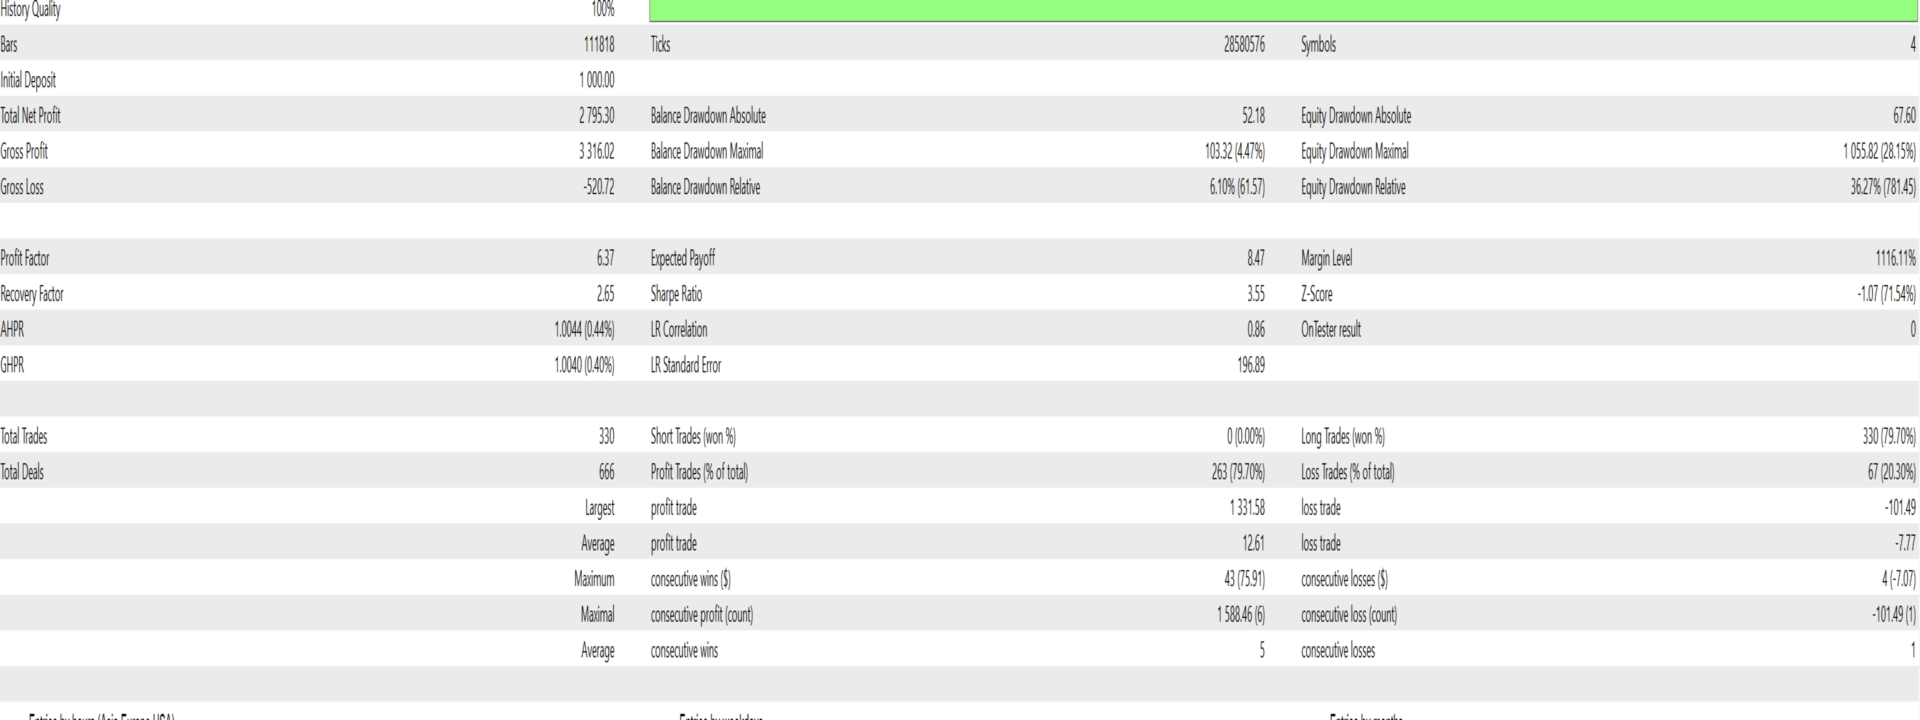
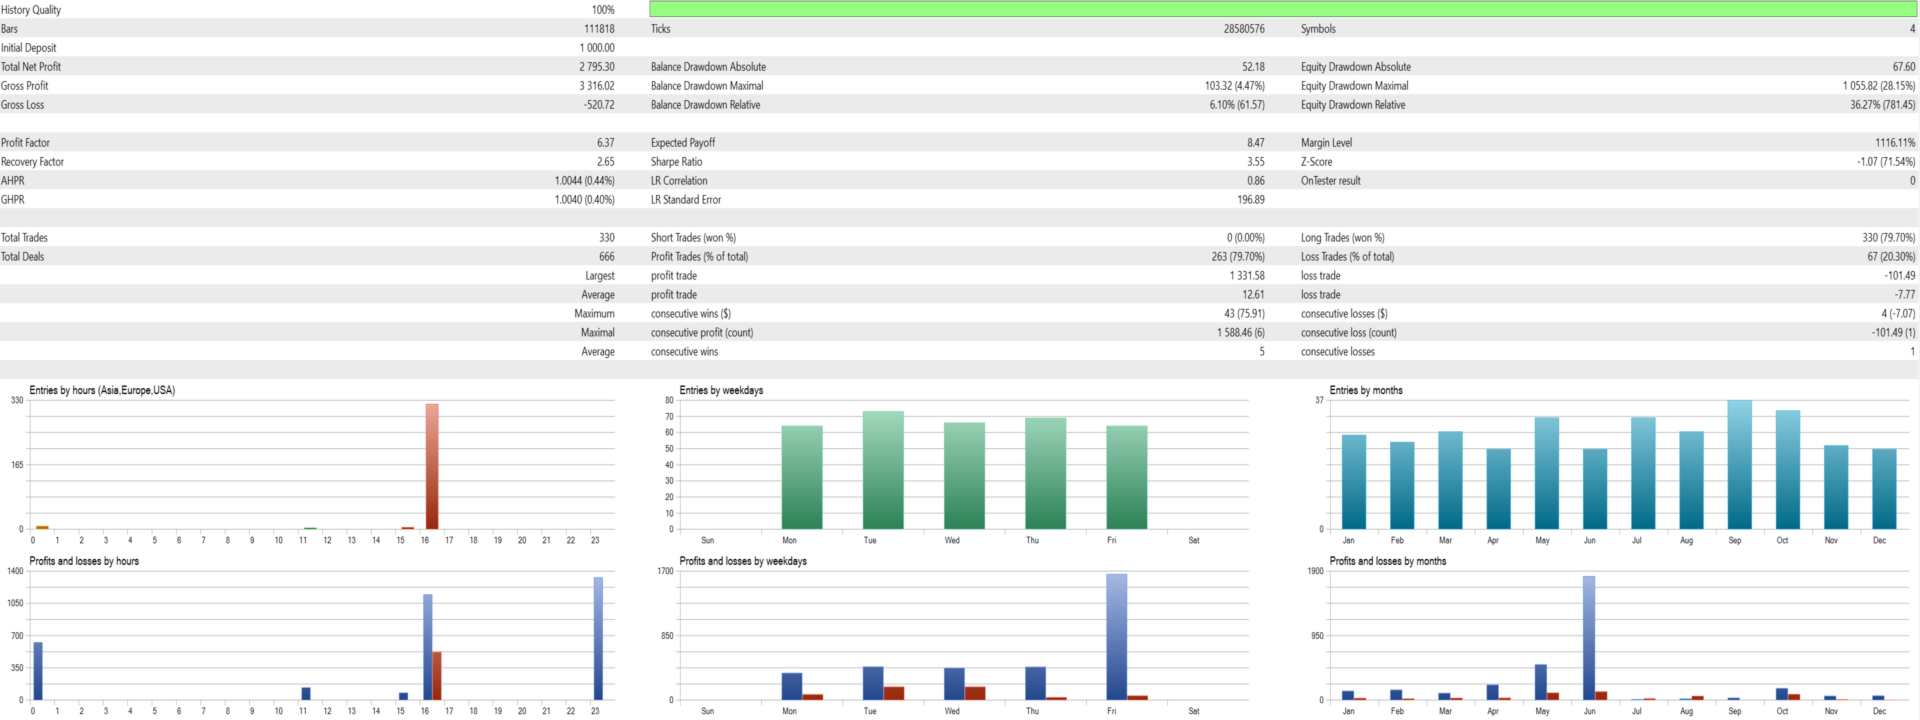
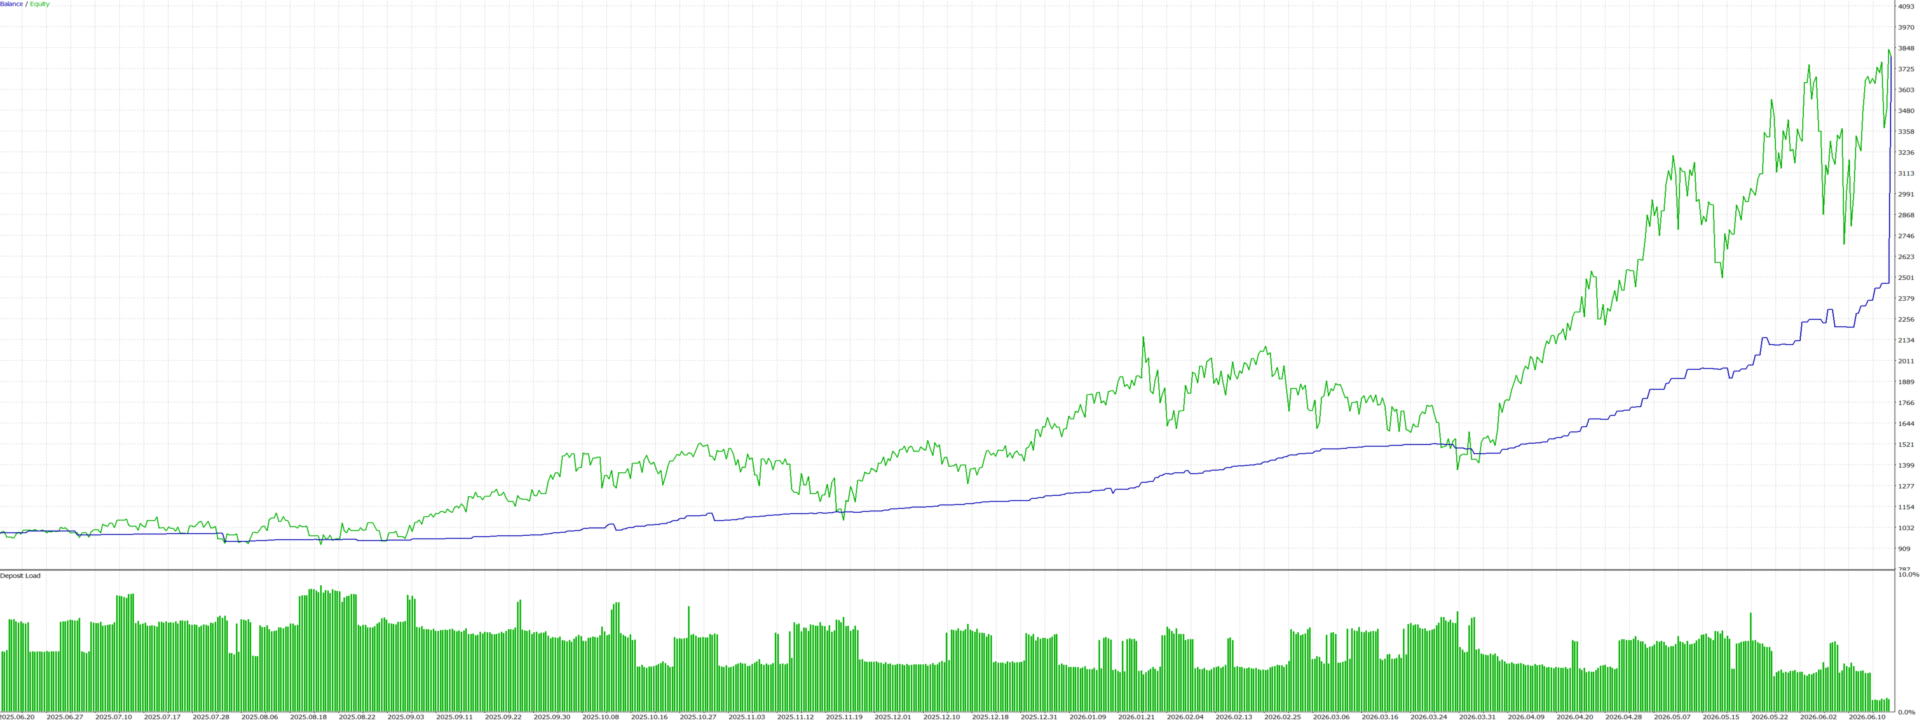
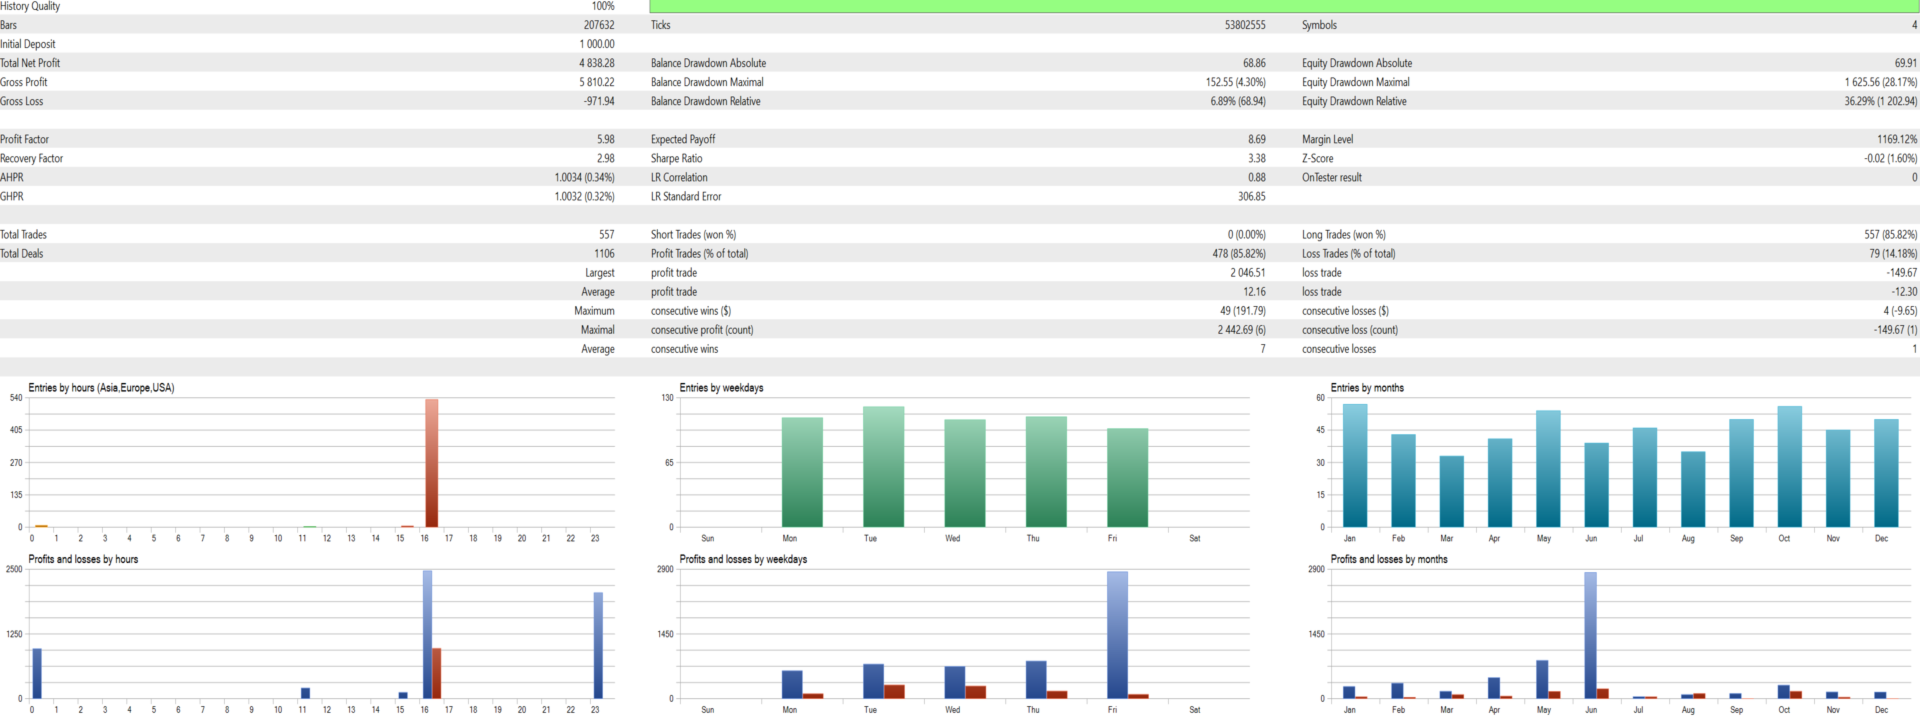
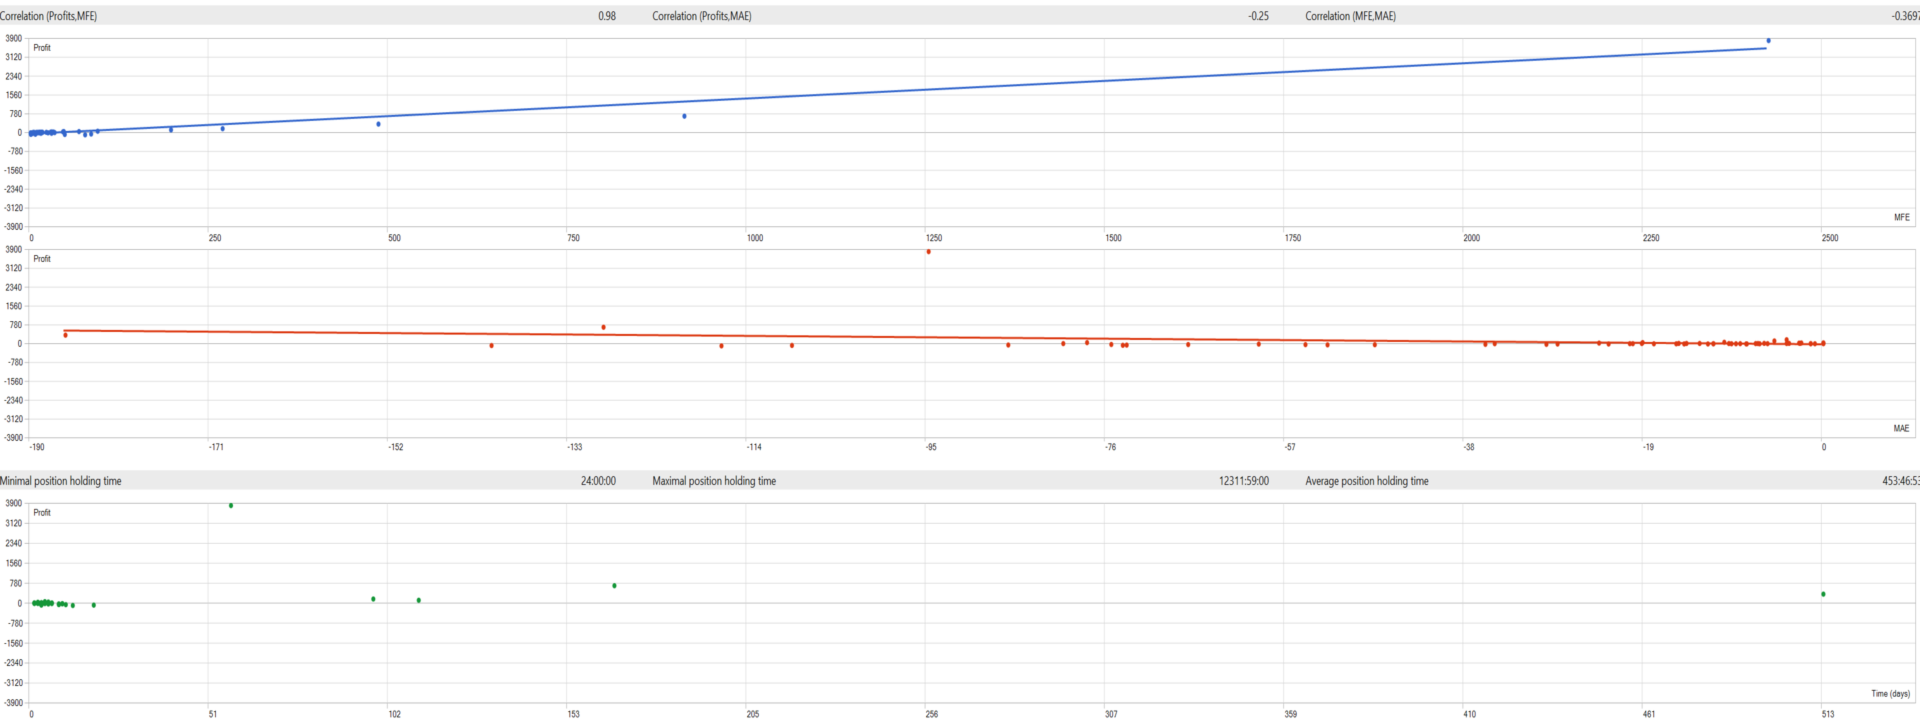
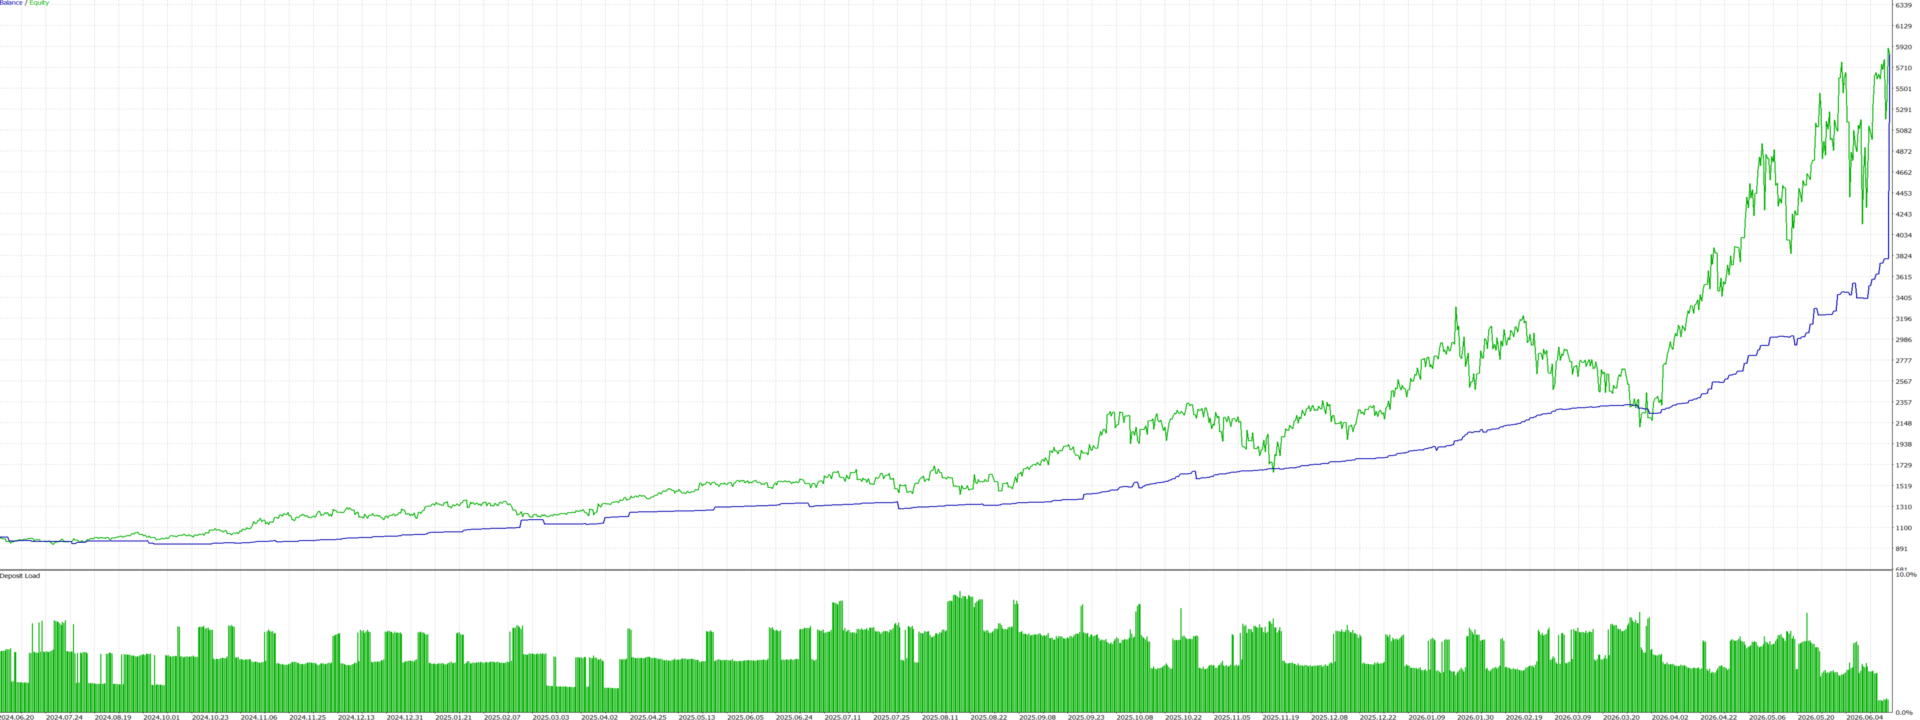
How much you can earn. Over the backtest period June 20, 2025 – June 20, 2026 (starting deposit $1,000), the EA produced +$2,795 for the year — that is +279%, with a 79.7% win rate across 330 trades. Broken down into shorter windows (profit accrued unevenly and accelerated as the balance grew):
- per month — roughly +$230 on average;
- per half-year — approximately +$1,000–1,400.
This is a result on historical data over a single year that was exceptionally strong for all four assets — not a forecast and not a promise. Under normal market conditions returns will be substantially lower. Actual results depend on the market, your broker, spread, and slippage, and will differ. We do not guarantee that your profit will match these figures.
How capital is protected. Free-margin check before every trade; a drawdown circuit breaker; netting-account-only operation; a trading-session filter; volume normalization to the broker's contract specifications; and a strict lock to the defined instrument basket.
How much you can lose. This is a high-risk strategy. Over the same test, the maximum equity drawdown reached 28% of capital (a $1,000 balance fell to roughly $720 at its worst point before recovering; relative equity drawdown reached 36%). If market conditions change, the drawdown can be larger — up to losing a significant part of, or all of, your deposit. Use only funds you can afford to lose.
Happy trading! CrossTrendBlend was built to give you a disciplined, multi-market approach to trends and to take the daily grind of position management off your plate. May your trends run long and your drawdowns stay short. Wishing you success in the markets!
Disclaimer
Trading CFDs is highly speculative and carries a significant risk of loss. Leverage can amplify both profits and losses — even a small market move against your position can lead to losses exceeding what you expected. Backtested results on historical data are not a guarantee of future performance; past results do not predict future returns. You may lose part or all of your invested capital. Trade only with funds you can afford to lose. This product is not personalized investment advice — the decision to use it is yours alone and taken at your own responsibility.