HTF swing pro MT5
- Indicatori
- Versione: 1.26
- Aggiornato: 21 aprile 2026
- Attivazioni: 5

การใช้งาน
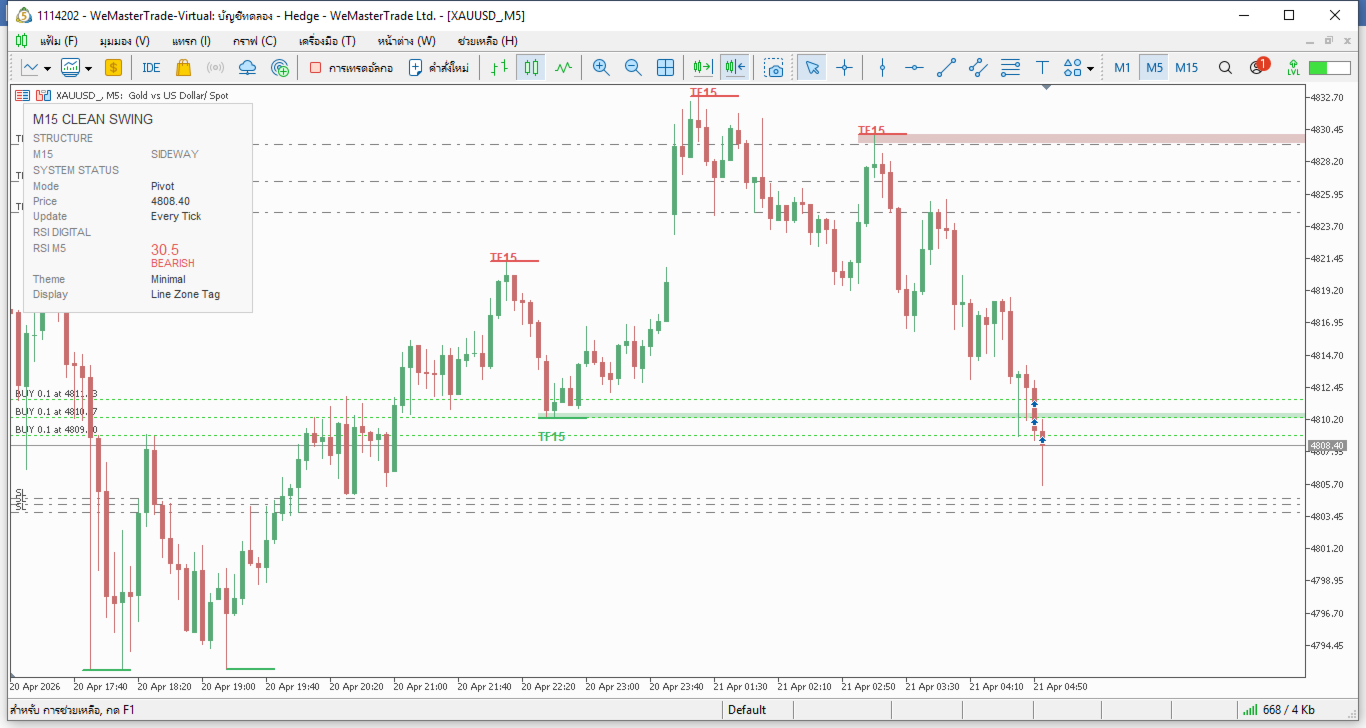
HTF SWING OVERLAY PRO MT5 v1.26 (M15 CLEAN SWING MODE)
ไอดิเคเตอร์นี้ถูกออกแบบให้ “อ่านสวิง M15 แบบสะอาด” โดยเน้น:
-
วาด สวิงสูง / ต่ำ จาก M15 อีกครั้ง
-
ผู้กำกับสั้น (ไม่ลากยาวรกกราฟ)
-
โซนบาง (โซนตามวิค)
-
แผงแสดงโครงสร้าง + RSI
-
ใหม่ล่าสุด (ลดความกระจ่าง)
วิธีการใช้งาน (Workflow จริง)
-
ใส่ Indicator ลงกราฟ (แนะนำ XAUUSD M1 / M5)
-
ปล่อยให้ระบบอ่าน สวิงจาก M15
-
โดยใช้:
-
แท่น = จุดเข้า (ปลายไส้)
-
โซน = ไฟล์ Re-entry
-
แผง = ดูโครงสร้าง + RSI
-
เรื่องของเรื่องบนกราฟ
1. ดักสวิง (สวิงไลน์)
-
= แกว่งสูง
-
สีเขียว = สวิงต่ำ
-
ผู้กำกับสั้น = โฟกัสเฉพาะจุดจริง (ไม่รก)
2. โซน (Zones)
-
โซนแดง = Supply (จาก wick บน)
-
โซนเขียว = Demand (จาก wick ล่าง)
-
บาง = คำนวณจากไส้เทียน (ZoneThinFactor)
3. ป้ายกำกับ
-
“TF15” = ส่วนมาจาก M15
-
แสดงที่สิ้นสุดไส้ (offset ขึ้น/ลง)
4. แผง
แสดง:
-
เทศกาล: ขึ้น / ลง / ด้านข้าง
-
ราคา
-
อาร์เอสไอ
-
ระบบ
สิ่งสำคัญจริง)
🔹 กลุ่ม: M15 คลีนสวิง
-
UseM15Only = true
➜ ใช้เฉพาะ M15 (แนะนำเปิดตลอด) -
SwingTF = PERIOD_M15
➜นี้จะต้องเปลี่ยนโหมดการปกครองของคุณ
🔹 กลุ่ม : เครื่องยนต์สวิง
-
SwingMode
-
PIVOT = เนียนกว่า (แนะนำ)
-
FRACTAL = คอมแต่สัญญาณเยอะ
-
-
LeftBars / RightBars
➜ ต้นแบบความ “ชัดของสวิง”-
3/3 = สมดุล (ค่าเดิมดีแล้ว)
-
5/5 = นิ่งขึ้น
-
2/2 = ตรวจตรา
-
-
ConfirmedOnly = true
➜เออเฉพาะสวิงที่ “ปิดแท่งแล้ว” (ยังไม่ทาสีใหม่)
🔹กลุ่ม: จอแสดงผล
-
MaxSwingPoints = 6
➜มีความสำคัญสวิงที่โชว์ -
SwingLineBars = 6
➜ เส้นทางเส้น (แนะนำ 5–8) -
LabelOffsetPoints = 80
➜ ป้ายกำกับระยะจากราคา
🔹 กลุ่ม: การตั้งค่าโซน
-
ZoneForwardBars = 220
➜ โซนยืดตลอดกาล -
ZoneThinFactor = 0.30
➜โซนบางโซน-
0.2 = บางมาก (หนังศีรษะ)
-
0.3 = ความสมดุล (แนะนำ)
-
0.5 = ฝาเพิ่มขึ้น
-
-
ShowOnlyLatestZone
-
true = โชว์เฉพาะโซนล่าสุด (สะอาดมาก)
-
false = แสดงหลายโซน
-
🔹 กลุ่ม: RSI Digital
-
RSIPeriod = 14
-
RSI_OB = 70 / RSI_OS = 30
ใช้ดู:
-
ซื้อเกิน = เสี่ยงลง
-
OVERSOLD = เสี่ยงขึ้น
50 = ตกลง ซื้อ
-
<50 = ขาย
🔹กลุ่ม: Panel
-
ShowStructurePanel = true
-
PanelCorner / X / Y
➜ UI ของป้อมปราการ
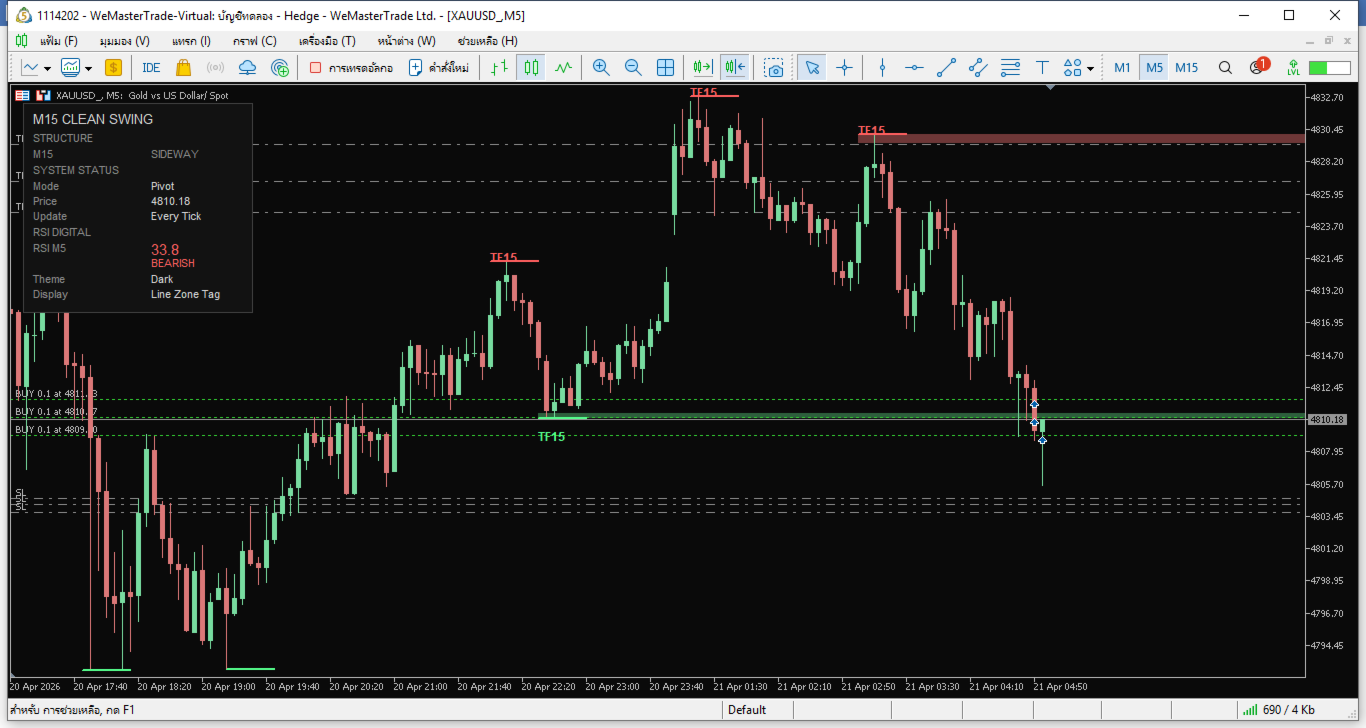
🔹กลุ่ม: Theme
-
ThemeMode
-
DARK = เทรดจริง
-
ขั้นต่ำ = ขั้นต่ำ
-
-
HideChartGrid = true
➜ ตรวจสอบเปิด (กราฟสะอาด)
🔹 กลุ่ม: ติ๊กอัพเดท (สำคัญ)
-
RefreshEveryTick = true
➜ อัปเดตเรียลไทม์ -
MinRedrawGapMS = 150
➜ ลดความเด้ง (ยิ่งมากยิ่งนิ่ง)
วิธีการระบบเทรด (ของคุณ)
ค่ะ:
-
แนวโน้ม EMA + จุดเข้าแบบแฟรกทัล
-
โกลด์ M1 / M5
การตั้งค่าแนะนำ:
-
TF: M1 หรือ M5
-
ใช้ Swing M15 เป็นฟิลเตอร์ HTF
ตรรกะ:
-
Trend UP → รอราคาลง Demand Zone → ซื้อ
-
เทรนด์ขาลง → รอราคาขึ้น Supply Zone → ขาย
จุดเด่นของเรื่องนี้ (v1.26)
-
กระพริบไม่มั่ว (มี คันเร่งวาดใหม่)
-
แท่นสั้นไม่รก
-
โซนบาง (เข้าแม่นขึ้น)
-
แผง
-
M15 สะอาดจริง
ระวัง
-
รายการนี้คือ → ระบบอัตโนมัติต้องใช้ระบบร่วม
-
ปรับ ซ้าย/ขวา ต่ำเกิน → สวิงหลอกเยอะ
-
เปิดหลาย TF → จะรก (ตั้งใจนี้ M15 อีกครั้ง)