MultiTF Adx Rsi Macd Panel
- Indicatori
- Versione: 1.17
- Aggiornato: 27 marzo 2026
- Attivazioni: 10
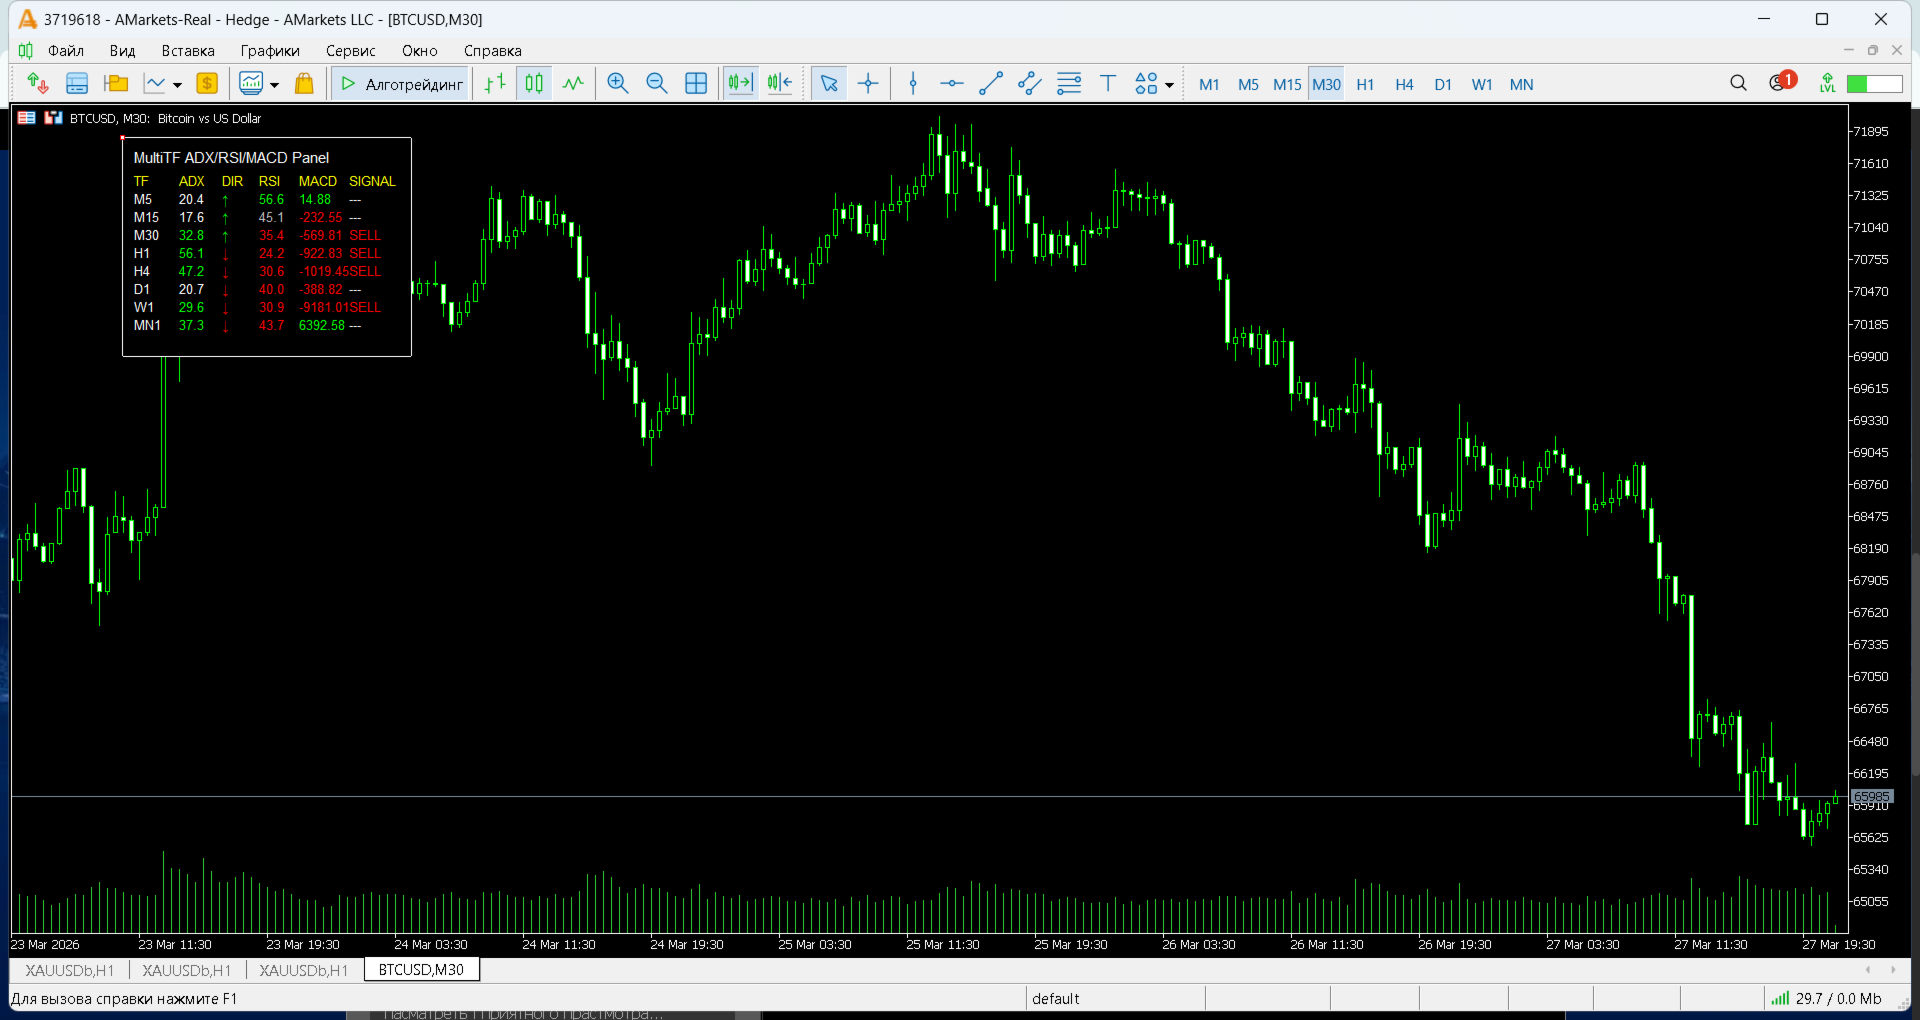
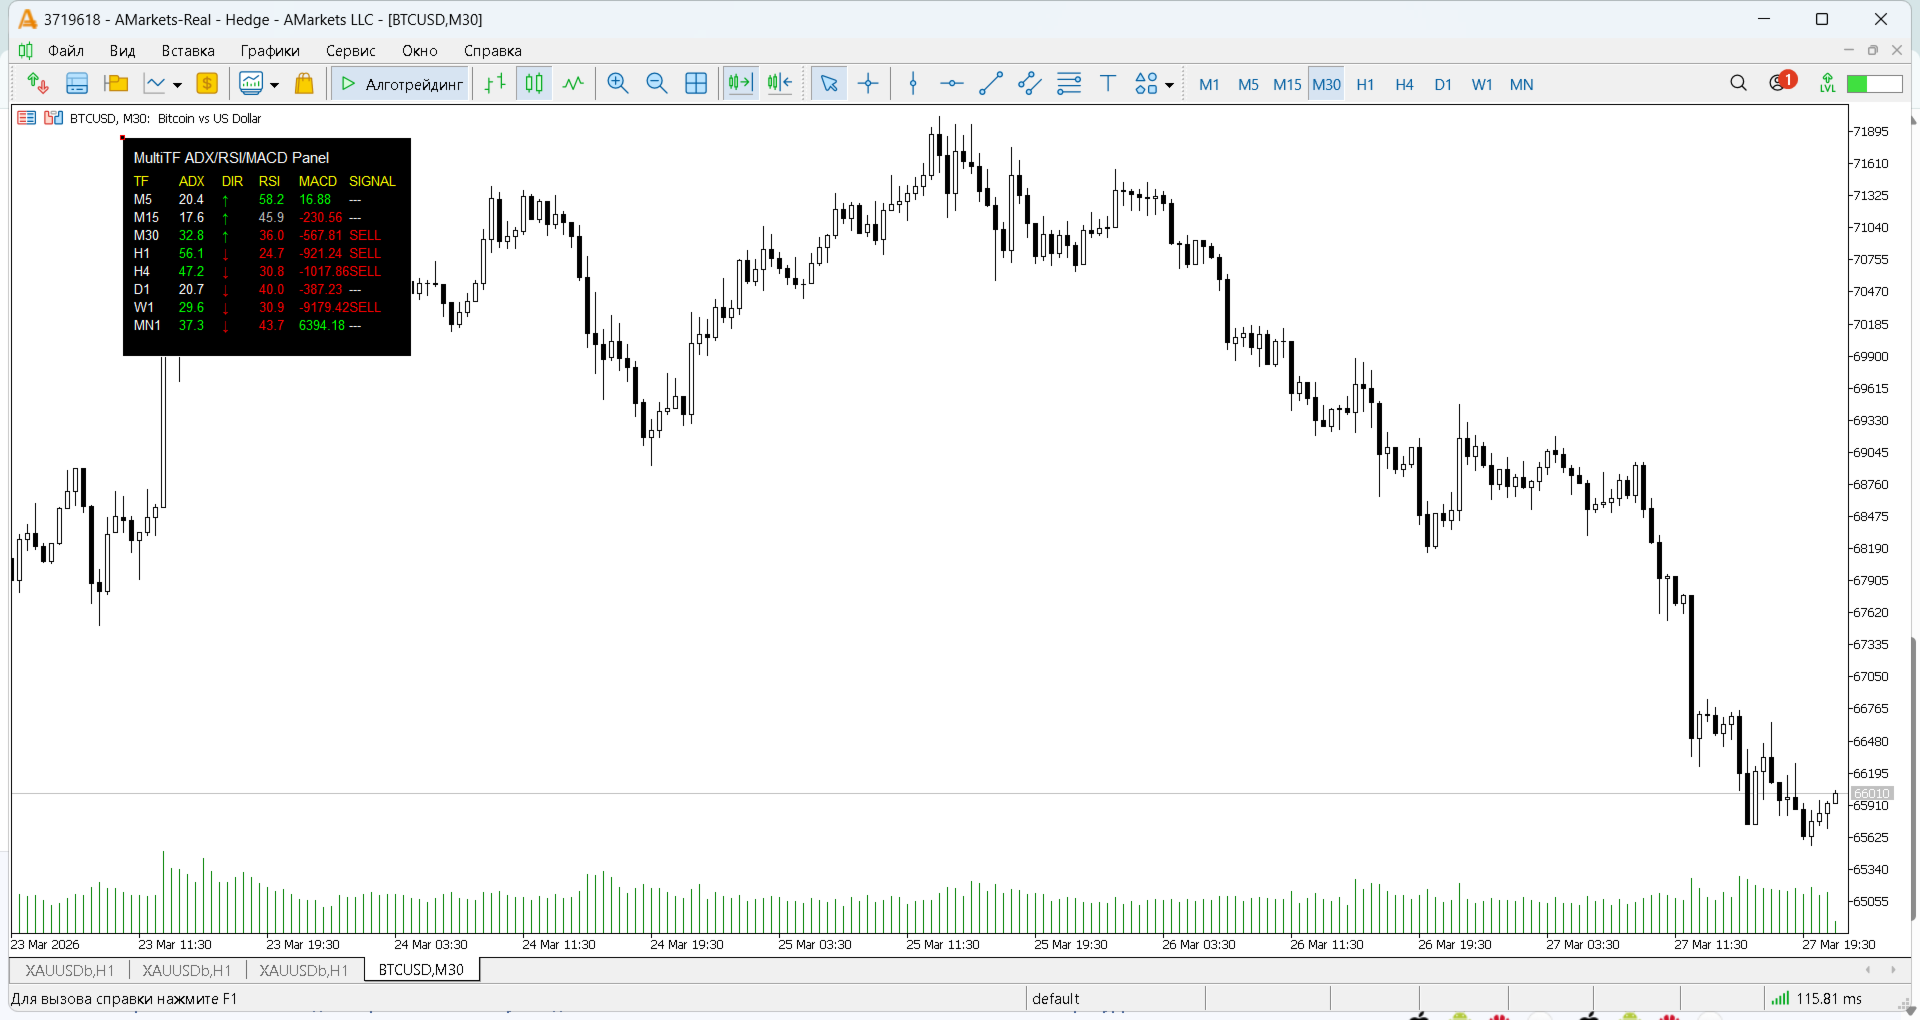
MultiTF ADX RSI MACD Panel Multi-timeframe dashboard for instant trend and momentum analysis This indicator displays the current readings of three classic technical tools (ADX, RSI, MACD) simultaneously across eight timeframes from M5 to MN1 in one compact table. The main goal is to quickly identify strong, aligned market moves when the majority of timeframes show signals in the same direction. What the panel shows for each timeframe: • TF — timeframe • ADX — ADX value (green > 25 — strong trend) • DIR — trend direction based on +DI/−DI (↑ green / ↓ red) • RSI — RSI(14) value (green > 55, gray 45–55, red < 45) • MACD — MACD main line (green > 0, gray ≈ 0, red < 0) • SIGNAL — final signal BUY / SELL / — Signal conditions (strict confluence): BUY → ADX > 25 + RSI > 55 + MACD > 0 SELL → ADX > 25 + RSI < 45 + MACD < 0 The strategy is specifically designed to catch **strong impulsive moves** — when a trend is already formed and confirmed across multiple timeframes. This allows entering the market in the direction of the dominant force while avoiding flat and weak periods. Key advantages: • Uses current (unfinished) bar data — maximum timeliness • Automatic alert when BUY or SELL appears on 3 or more timeframes simultaneously • Fully customizable colors, font, background, border, panel position • Very low resource usage Ready-to-use indicators with alerts for this strategy (including additional filters and confirmations) are already published in my profile: https://www.mql5.com/en/users/savkat366231/seller Suitable for: • trend following • swing trading • catching impulsive moves on Forex, cryptocurrencies, indices, and commodities Recommended to combine with support/resistance levels and news filter. Questions about settings or signal examples — feel free to message me. Happy trading!