ST Adaptive Flow

ST Adaptive Flow: Triple Confluence & KAMA Intelligence

ST Adaptive Flow is a next-generation indicator designed for traders who demand surgical precision in identifying institutional flow. It is not just a moving average; it is a decision algorithm that combines KAMA (Kaufman Adaptive Moving Average) with momentum filters (RSI) and macro trend (SMA 200).

The Core of the Algorithm:

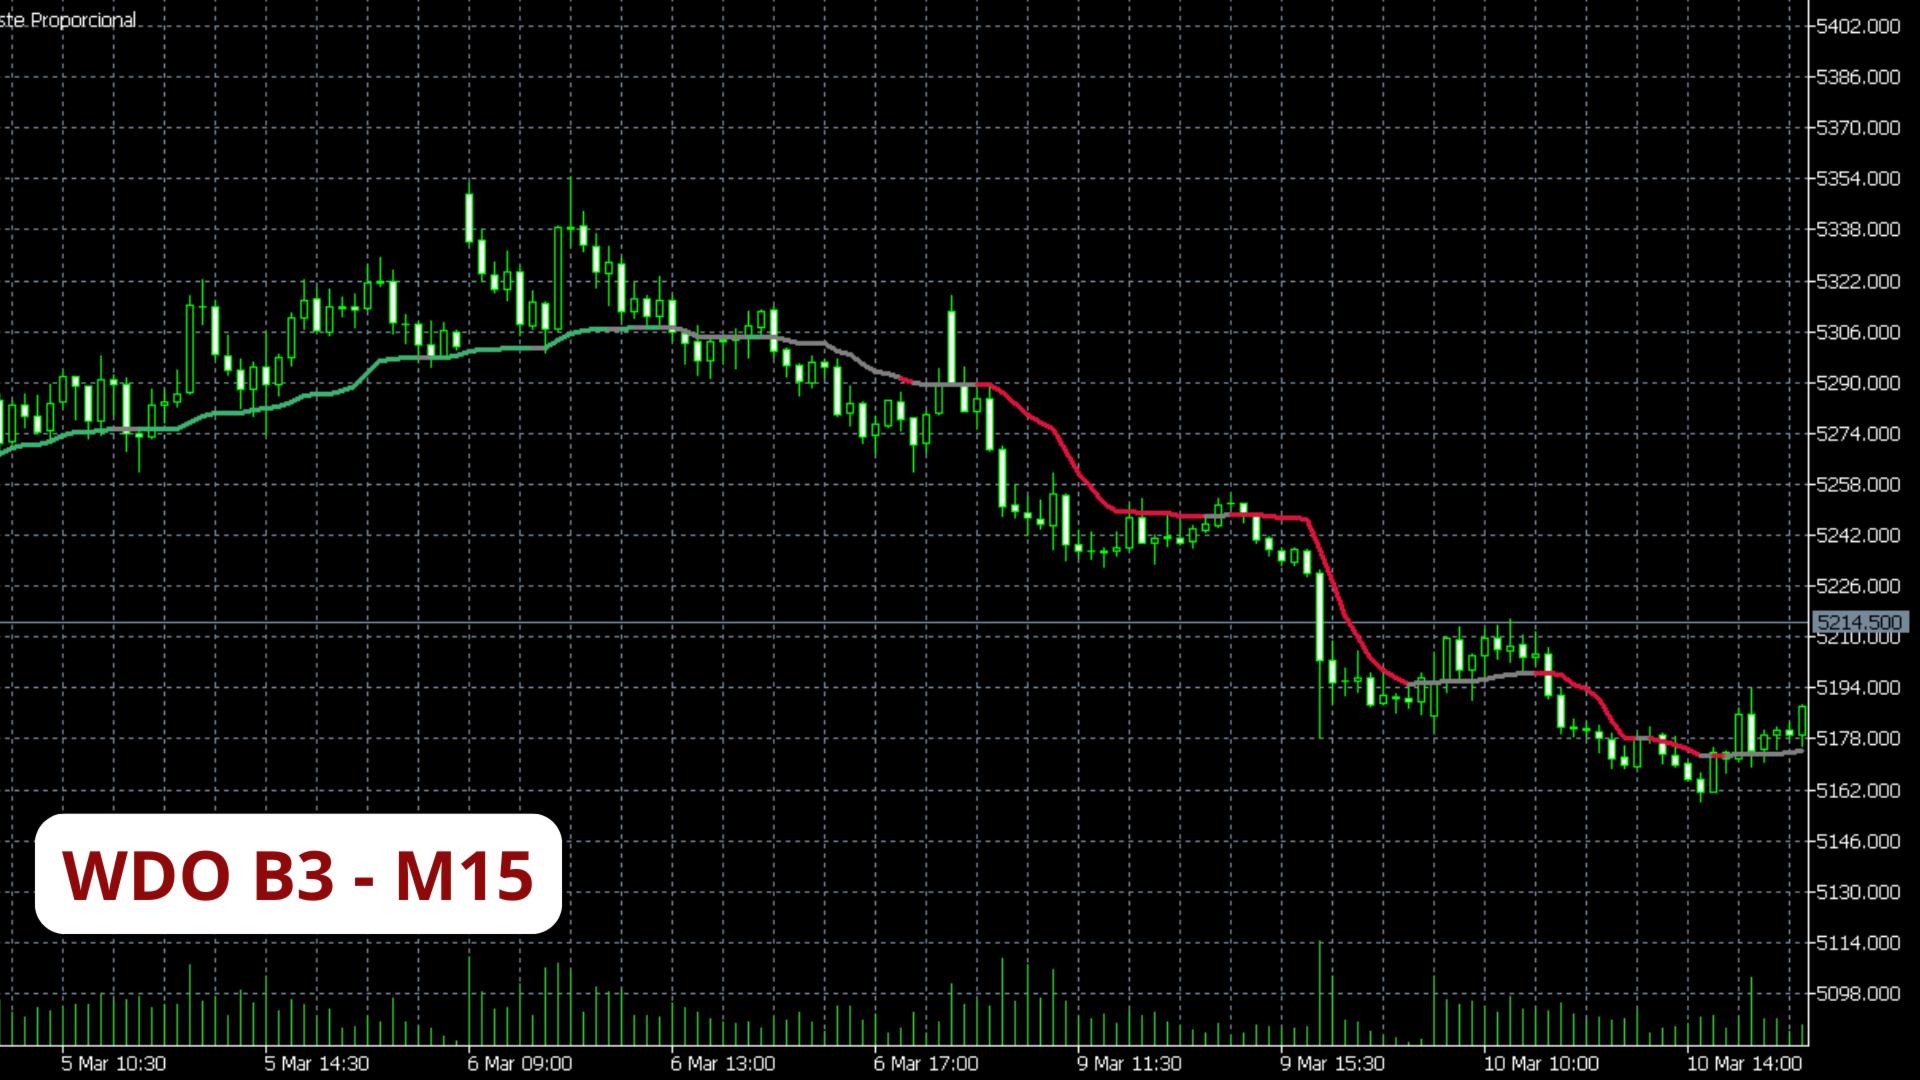
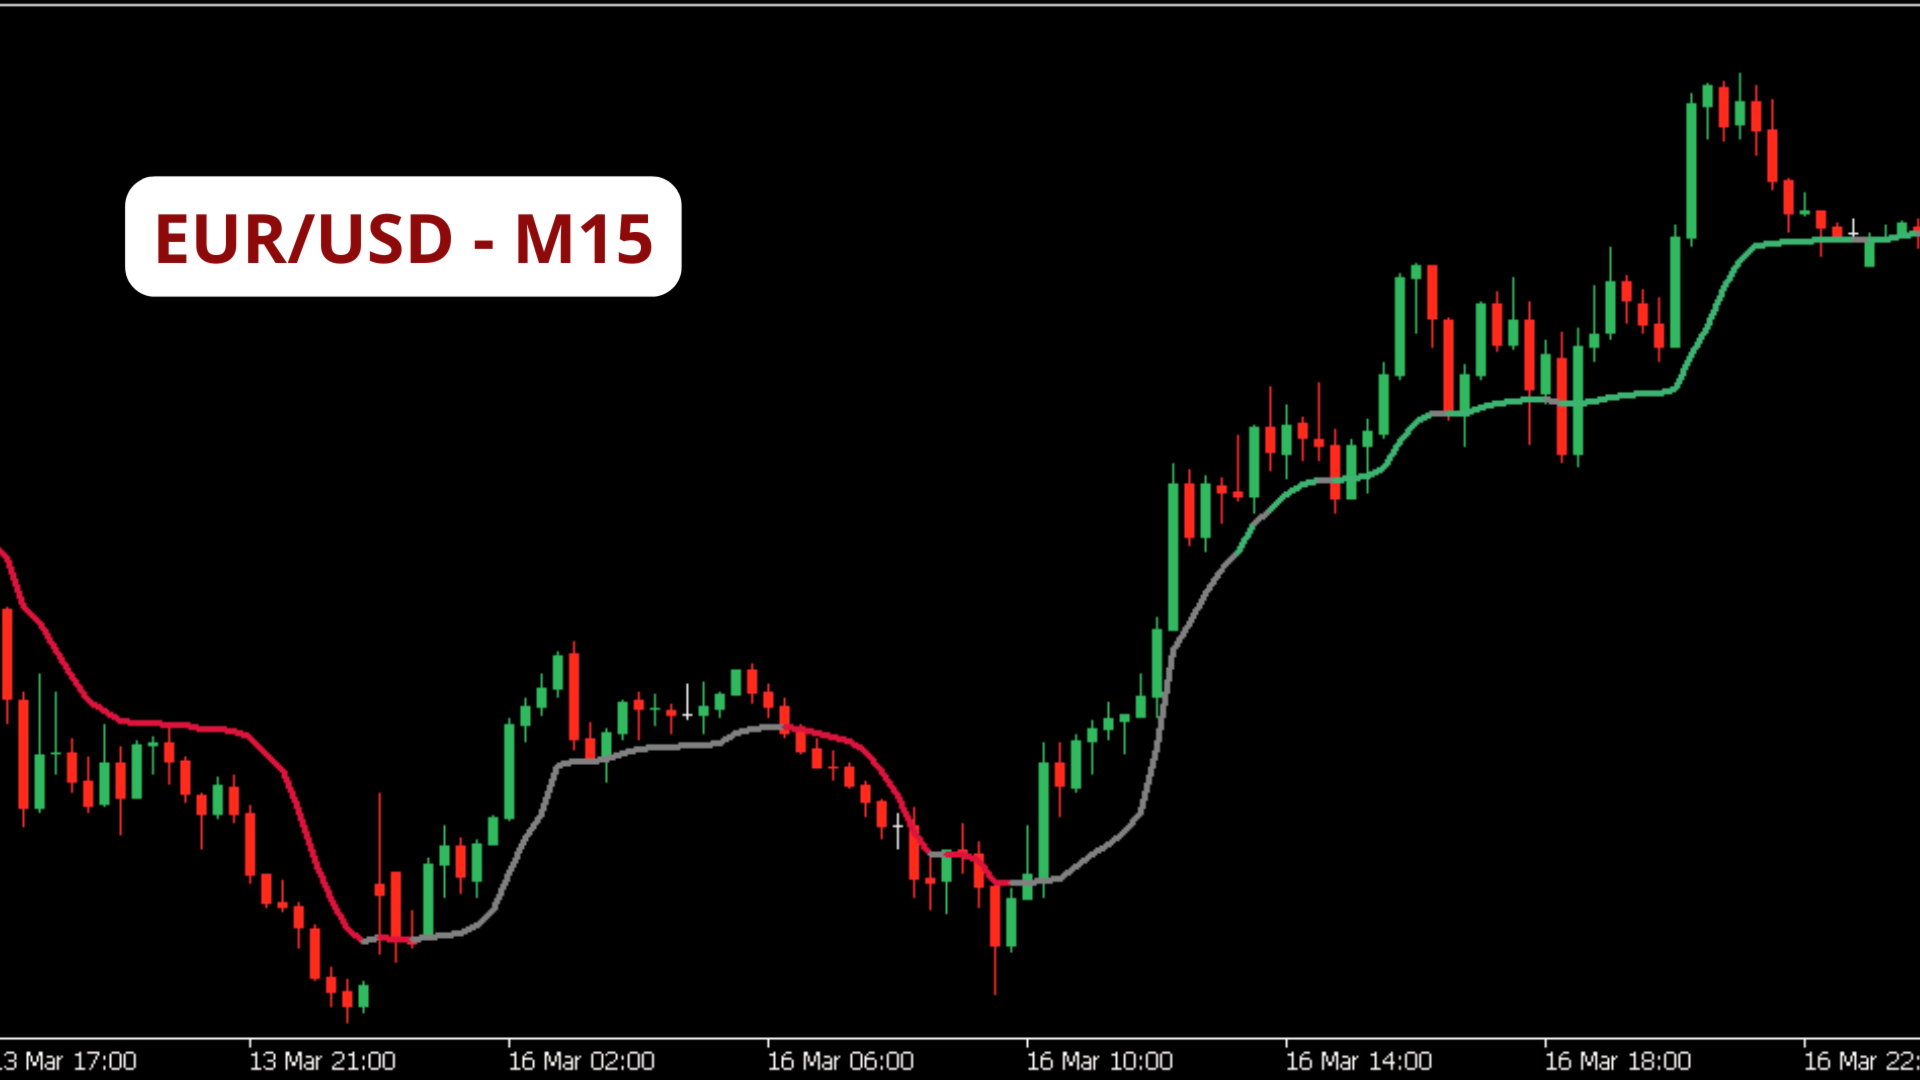
  • Dynamic Adaptive Line: Uses Kaufman’s logic to adjust to market speed. It flattens in sideways markets and slopes aggressively in strong trends.

  • Color Semantics (Flow Traffic):

    • Green (Bullish): Full confluence (Price > SMA 200 + RSI > 50 + Bullish KAMA). Confirmed buying momentum.

    • Red (Bearish): Full confluence (Price < SMA 200 + RSI < 50 + Bearish KAMA). Confirmed selling momentum.

    • Gray (Neutral): No-trade zone. The indicator identifies the lack of statistical advantage and protects your capital.

Trading Criteria:

  1. Buy Trigger: Color change from Gray to Green. The signal is validated when the candle closes above the line.

  2. Sell Trigger: Color change from Gray to Red. The signal is validated when the candle closes below the line.

  3. Precision Exit: The signal ends when the line returns to Gray or a candle closes on the opposite side of the line.


Prodotti consigliati
SPECIAL LAUNCH OFFER: $30 (1-Month Rent) Limited time offer to build our community and gather feedback! AmbM GOLD Institutional Scalper A high-precision M5 algorithm for XAUUSD (Gold) , engineered to trade exclusively at Institutional Liquidity Levels ($5/$10 psychological marks). PERFORMANCE DATA (BUY ONLY) • Win Rate: 87.09%. • Safe Growth: +$4,113 profit on $10k (13.75% Max Drawdown). • Extreme Stress Test: Successfully generated +$22,997 in a 5-year stress test (2020-2026), proving
L'indicateur SMC Venom Model BPR est un outil professionnel pour les traders travaillant dans le concept Smart Money (SMC). Il identifie automatiquement deux modèles clés sur le graphique des prix: FVG   (Fair Value Gap) est une combinaison de trois bougies, dans laquelle il y a un écart entre la première et la troisième bougie. Forme une zone entre les niveaux où il n'y a pas de support de volume, ce qui conduit souvent à une correction des prix. BPR   (Balanced Price Range) est une combinaiso
Il nostro indicatore   Basic Support and Resistance   è la soluzione necessaria per aumentare l'analisi tecnica.Questo indicatore consente di proiettare i livelli di supporto e resistenza sul grafico/ MT4 gratuita Funzionalità Integrazione dei livelli di Fibonacci: Con la possibilità di visualizzare i livelli di Fibonacci insieme a livelli di supporto e resistenza, il nostro indicatore ti dà una visione ancora più profonda del comportamento del mercato e delle possibili aree di inversione. Ot
Welcome to the Ultimate Harmonic Patterns recognition indicator that is focused to detect advanced patterns. The Gartley pattern, Bat pattern, and Cypher pattern  are popular technical analysis tools used by traders to identify potential reversal points in the market. Our Ultimate Harmonic Patterns recognition Indicator is a powerful tool that uses advanced algorithms to scan the markets and identify these patterns in real-time. With our Ultimate Harmonic Patterns recognition Indicator, you ca
Delta Profile Volume
Teresinha Moraes Correia
Technical Description of the Indicator – Delta Profile for MetaTrader 5 The Delta Profile is an indicator developed for MetaTrader 5 focused on detailed analysis of volume flow within a defined range of candles. It organizes and displays information about the imbalance of positive volumes (associated with upward movements) and negative volumes (associated with downward movements) at different price levels. The result is a clear view of the chart points where the highest concentration of trades o
BTC Master Pro
Farzad Saadatinia
4.58 (12)
BTC Master Pro — il tuo partner affidabile per un trading disciplinato su Bitcoin. La nuova versione è ora potenziata con intelligenza artificiale OpenAI , offrendo un’esecuzione più intelligente e un filtraggio migliorato delle operazioni in condizioni di elevata volatilità del mercato crypto. Questo Expert Advisor professionale è stato sviluppato specificamente per il trading di Bitcoin (BTCUSD) sulla piattaforma MetaTrader 5 , con particolare attenzione a un’esecuzione strutturata, esposizion
Noize Absorption Index - is the manual trading system that measures the difference of pressure between bears forces and bulls forces. Green line - is a noize free index that showing curent situation. Zero value of index shows totally choppy/flat market.Values above zero level shows how powerfull bullish wave is and values below zero measures bearish forces.Up arrow appears on bearish market when it's ready to reverse, dn arrow appears on weak bullish market, as a result of reverse expectation.
True TrendLines MT5 - Smart Trend Detection & Alerts Overview True TrendLines MT5 is a professional-grade technical analysis tool that automatically identifies and plots high-probability trend lines on your MetaTrader 5 charts. Using a sophisticated swing point detection algorithm, it helps traders visualize key market structure and potential reversal points with precision. Key Features Automatic Trend Line Detection Identifies valid swing highs and lows based on your chosen strength paramet
FREE
Mette in evidenza le sessioni di trading sul grafico Versione a pagamento del prodotto Trading_Sessions_Indicator_Free con la possibilità di personalizzare l'inizio/fine delle sessioni. L'indicatore delle sessioni di trading evidenzia l'inizio e la fine di ogni sessione di trading. [OPTION:] Asian session Open Asian session Close Asian session OpenSummertime Asian session CloseSummertime European session Open European session Close European session Open European session Close Timeshift Si p
Fusion Cycles
Jean Carlos Souza
Professional Cycle Analysis with MACD Momentum Sync. Fusion Cycles is a high-performance indicator designed to identify market cycles by merging Stochastic dynamics with MACD momentum filtering. It offers a clear visual map of trend strength through its proprietary dynamic-color line system. Key Features: Momentum Synchronization: The main oscillator line changes color (Lime/Red) based on the MACD Histogram slope, preventing trades against the short-term flow. Strategic DNA Zones: Calibrated at
FREE
Rsi Cloud PullBack
Sylvestre Setufa Djagbavi
Do you want trading robots? Read this: Before investing in a trading robot, take a moment to understand what it entails. Trading is a game of probabilities. No one can guarantee a profit on every trade or every month. What truly matters is long-term profitability.  If you can't accept that, there's no point in buying my robot. Go find another job.  Don’t buy a robot based solely on its price or popularity on a platform. An expensive bot isn’t necessarily profitable.  Even with a profitable robot
Supply and Demand Indicator + FREE Currency Strength Meter ADD-ON Looking for a powerful tool that can help you identify the most reactive zones in the forex market? Our supply and demand indicator for MetaTrader 4 and 5 is exactly what you need. With its advanced algorithms and real-time analysis, this indicator helps traders of all experience levels make informed trading decisions. The supply and demand indicator is a cutting-edge tool that helps traders identify areas where buyers and sellers
Smart Market Structure Simple is a powerful indicator that helps traders identify market structure based on the Smart Money Concept (SMC) . This indicator automatically detects Break of Structure (BOS), Change of Character (CHoCH), Fair Value Gaps (FVG), Order Blocks (OB), Liquidity Zones (LQZ), and key swing points Higher High (HH), Higher Low (HL), Lower High (LH), Lower Low (LL) . Main Objective: Assist traders in tracking institutional flow ( Smart Money ) and finding high-probability trade
This tool monitors MACD indicators on all time frames in the selected markets. Displays a table with signals to open a BUY trade (green) or SELL trade (red). You can set the conditions for the signal. You can easily add or delete market names / symbols. If the conditions for opening a trade on multiple time frames are met, you can be notified by e-mail or phone message (according to the settings in MT5 menu Tools - Options…) You can also set the conditions for sending notifications. The list of
Triangle Pattern Gann v3.1 - Complete Feature Documentation Core Functionality OverviewTriangle Pattern Gann v3.1 is a sophisticated MetaTrader 5 indicator that combines W.D. Gann's geometric trading principles with advanced triangle pattern recognition to deliver actionable trading signals. Primary Features1. Triangle Pattern Detection SystemAscending Triangle Recognition Function: Automatically identifies bullish continuation patterns Detection Criteria: Flat horizontal resistance line
Golden Limit
Renato Fridschtein
There are no limits! Golden Limit is the ultimate indicator to get clear and easy readings of price movements on charts. It projects support and resistance ranges, calculated by statistical models involving Price Action and the Fibonacci sequence, revealing in advance the behavior of prices and the best places to trade and not to trade. It also has two moving averages to help choose the best entries. The Golden Limit method was created from a proven model. In summary: We use the names of precio
Trading Stats
Frank Jose Olivo Flores
Stop wasting time digging through MT4/MT5 account statements to understand how your trading is performing. The Trading Stats Indicator puts every number you need — Win Rate, Avg Profit, Avg Loss, Risk:Reward Ratio, Expected Value, and Total Profit — right on the chart, updated live with every tick. Why Trading Stats Exists? Every serious trader eventually asks the same questions at the end of a session: How many trades did I take today? What was my average winner versus my average loser? Do I a
MACD Multi Time Frame Scanner MACD Scanner MT5 is a powerful and easy-to-use dashboard tool that scans the MACD indicator across multiple symbols and multiple timeframes in real-time. It gives you a complete market overview at a glance, helping you spot bullish and bearish MACD crossovers instantly — without switching between charts. 1. Multi-Symbol / Multi-Timeframe Scanning Allow user to set a watchlist (symbols to scan). Scan across multiple timeframes (M1 → MN). Show signals (Bullish / Beari
Volume Profile V6
Andrey Kolesnik
4.75 (4)
Indicatore del profilo di volume del mercato + oscillatore intelligente. Funziona su quasi tutti gli strumenti: coppie di valute, azioni, futures, criptovalute, sia su volumi reali che su tick. È possibile impostare la definizione automatica dell'intervallo di costruzione del profilo (ad esempio, per una settimana o un mese, ecc.), oppure impostare l'intervallo manualmente spostando i confini (due linee verticali: rossa e blu). Viene visualizzato sotto forma di istogramma. La larghezza dell'isto
Italian Spiegazione dei Vantaggi (Senza menzionare il codice) 1. Differenziazione dettagliata del mercato (3 Dimensioni) Isola il movimento "Laterale" (Sideways) . Pressione di acquisto (Rialzista). Pressione di vendita (Ribassista). Importante: Evidenzia quando il mercato non ha direzione. 2. Misurazione della forza (Oscillatore 0-100) Zone Estreme: Ipercomprato/Ipervenduto. Riempimento aree: Colora le zone di picco per un'analisi rapida. 3. Flessibilità nel filtraggio (Smoothing) Riduzione del
Max Min Delta Indicator - Market Volume Imbalance Analysis Gain Deeper Insights into Market Volume Imbalance with Delta Analysis What is the Max Min Delta Indicator? The Max Min Delta Indicator is a powerful market volume analysis tool that visually represents maximum and minimum delta values using a histogram. It helps traders identify market strength, weakness, absorption, and aggressive buying/selling activity with precision. Key Features Histogram Visualization: Displays Max Delta (Green) an
Think of an indicator that instantly shows you all supports, resistances and turncoats and can send a notification to your phone or an alarm on your computer. In addition to all these, it groups how many times it has entered each field and, accordingly, the strength of the field. Supply Demand And Turncoat is at your service. Setup for any TimeFrame and Chart you want and enjoy easy trading. Features: Ability to select the fields to be shown (weak, untested, turncoat, verified, proven) Merge fie
Smart Manual Trader MT5
Jose Ramon Rosaenz Carmona
Smart Manual Trader MT5 is designed for traders who want simplicity, precision, and full control over their trades. It combines: manual trading with a visual panel automatic risk management in real money (Money) optional auto trading mode All inside a clean, intuitive, and professional interface. ️ Control Panel – Full Description The panel displays real-time market data and your trading configuration. Panel Information Symbol Shows the instrument currently traded (e.g., EURUSD, XAUUSD,
Visual River Flow Divergence Indicator
AL MOOSAWI ABDULLAH JAFFER BAQER
Introducing the River Flow Divergence Indicator Are you ready to unlock your trading potential? Meet the River Flow Divergence Indicator, a powerful tool designed to help you navigate market trends and reversals with precision. This indicator is tailored for traders who are eager to fine-tune their strategies and take control of their success. Note: This indicator is not optimized out of the box. It’s crafted for you to customize and optimize according to your unique trading style and goals. Ho
GEN TrendPivot Hunter Developer: Gede Egi Overview GEN TrendPivot Hunter is a multifunctional indicator for MetaTrader 5. It combines Pivot-based Support & Resistance, Fair Value Gaps (FVG), and Trendlines into one analytical tool. The indicator helps visualize possible price reaction areas and market structures directly on the chart. All drawing styles, alerts, and notifications can be customized through the input parameters. The tool does not generate trading signals automatically; it is inte
Sceptre Rex
Itumeleng Mohlouwa Kgotso Tladi
Sceptre Rex: The Sovereign of Trend Trading Take command of the markets with   Sceptre Rex , a premium Expert Advisor engineered specifically for traders who demand precision, efficiency, and data-driven logic. Built on the   EURNZD M15   timeframe, Sceptre Rex is designed to identify and execute high-probability trend reversals and continuations with surgical accuracy. Why Sceptre Rex? In a market full of "noise," Sceptre Rex focuses on clarity. This EA utilizes a proprietary trend-following
Visual CrossPulse Dynamics Indicator
AL MOOSAWI ABDULLAH JAFFER BAQER
Visual CrossPulse Dynamics: Trade with the Market's True Rhythm Unlock a new level of market insight with Visual CrossPulse Dynamics, a sophisticated trading indicator designed to adapt to ever-changing volatility and reveal the true direction of the trend. Are you tired of indicators that lag in fast-moving markets or give false signals during consolidation? The Visual CrossPulse Dynamics indicator solves this problem by using an advanced, adaptive algorithm that intelligently adjusts to the m
Mine Farm
Maryna Kauzova
Mine Farm is one of the most classic and time-tested scalping strategies based on the breakdown of strong price levels. Mine Farm is the author's modification of the system for determining entry and exit points into the market... Mine Farm - is the combination of great potential with reliability and safety. Why Mine Farm?! - each order has a short dynamic Stop Loss - the advisor does not use any risky methods (averaging, martingale, grid, locking, etc.) - the advisor tries to get the most
Equinox Gold
Dmitriq Evgenoeviz Ko
Equinox Gold is a high-tech trading expert advisor (EA) specifically designed for the gold market ( XAUUSD ). The system is based on a unique Market Equilibrium algorithm that identifies areas of imbalance between supply and demand during extreme volatility. Unlike most robots that use dangerous sit-and-wait methods, Equinox Gold relies on mathematical momentum confirmation and strict risk control for every trade. MAIN ADVANTAGES VRP Filter (Volatility Range Filter): The robot automatically ada
Bollinger Bands are a technical analysis tool that consists of a set of three lines plotted on a price chart. The middle line is a simple moving average, usually of 20 periods, and the upper and lower lines represent the standard deviation of the price from the moving average. The upper band is calculated by adding two standard deviations to the moving average, while the lower band is calculated by subtracting two standard deviations from the moving average. This creates a band around the moving
Gli utenti di questo prodotto hanno anche acquistato
ARIPoint
Temirlan Kdyrkhan
ARIPoint is a powerful trading companion designed to generate high-probability entry signals with dynamic TP/SL/DP levels based on volatility. Built-in performance tracking shows win/loss stats, PP1/PP2 hits, and success rates all updated live. Key Features: Buy/Sell signals with adaptive volatility bands Real-time TP/SL/DP levels based on ATR Built-in MA Filter with optional ATR/StdDev volatility Performance stats panel (Success, Profit/Loss, PP1/PP2) Alerts via popup, sound, push, or email Cu
SuperScalp Pro
Van Minh Nguyen
4.59 (22)
SuperScalp Pro – Sistema avanzato di indicatore scalping multi-filtro SuperScalp Pro è un indicatore di scalping avanzato che combina il classico Supertrend con molteplici filtri intelligenti di conferma per aiutare a identificare opportunità di trading. Funziona in modo efficiente su diversi timeframe da M1 a H4, con prestazioni ottimizzate su XAUUSD, BTCUSD e principali coppie Forex. L’indicatore fornisce chiari segnali Buy e Sell, insieme a livelli di ingresso, stop loss e take profit calcola
Entry In The Zone and SMC Multi Timeframe is a real-time 2-in-1 market analysis tool that combines market structure analysis and a No Repaint BUY / SELL signal system into a single indicator, built on Smart Money Concepts (SMC) — a widely adopted framework used by professional traders to understand market structure. This indicator helps you see the market more clearly, make decisions based on structure rather than guesswork, and focus on high-probability zones where price is more likely to react
Divergence Bomber
Ihor Otkydach
4.9 (87)
Ogni acquirente dell’indicatore riceverà inoltre gratuitamente: L’utilità esclusiva “Bomber Utility”, che gestisce automaticamente ogni operazione, imposta i livelli di Stop Loss e Take Profit e chiude le posizioni secondo le regole della strategia I file di configurazione (set file) per adattare l’indicatore a diversi asset I set file per configurare il Bomber Utility in tre modalità: “Rischio Minimo”, “Rischio Bilanciato” e “Strategia di Attesa” Una guida video passo-passo per installare, conf
Azimuth Pro
Ottaviano De Cicco
5 (7)
Azimuth Pro V2: Synthetic Fractal Structure and Confirmed Entries for MT5 Overview Azimuth Pro is a multi-level swing structure indicator by Merkava Labs . Four nested swing layers, swing-anchored VWAP, ABC pattern detection, three-timeframe structural filtering, and closed-bar confirmed entries — one chart, one workflow from micro-swings to macro-cycles. This is not a blind signal product. It is a structure-first workflow for traders who care about location, context, and timing. V2 Launch Offe
SignalTech MT5 is a trading system for EURUSD, USDCHF, USDJPY, AUDUSD, NZDUSD, EURJPY, AUDJPY, NZDJPY, CADJPY H2 and H3 Timeframe.  All the winning trades with chart setups are published on the comments page. 2025-12 1174 Pips 2026-01 2624 Pips 2026-02 2937 Pips 2026-03 2165 Pips 2026-04 2243 Pips It can generate signals with Buy/Sell Arrows and Pop-Up/Sound Alerts. Each signal has clear Entry and Stop Loss levels, which should be automatically flagged on the chart, as well as potential Targets
Gold Entry Sniper
Tahir Mehmood
5 (8)
Gold Entry Sniper – Dashboard ATR Multi-Timeframe per Scalping e Swing Trading sull’Oro Gold Entry Sniper è un indicatore avanzato per MetaTrader 5 che offre segnali di acquisto/vendita precisi per XAUUSD e altri strumenti, basato sulla logica ATR Trailing Stop e l' analisi multi-timeframe . Caratteristiche e Vantaggi Analisi Multi-Timeframe – Visualizza trend su M1, M5, M15 in un'unica dashboard. Trailing Stop Basato su ATR – Stop dinamici che si adattano alla volatilità. Dashboard Professional
Power Candles MT5
Daniel Stein
5 (8)
Power Candles V3 - Indicatore di forza ad ottimizzazione automatica Power Candles V3 trasforma la forza delle valute e degli strumenti in un piano di trading attuabile su ogni grafico a cui è collegato. Invece di limitarsi a colorare le candele, esegue un'auto-ottimizzazione in tempo reale in background e ti fornisce i migliori valori di Stop Loss, Take Profit e soglia di segnale per il simbolo che hai davanti. Basta un clic per adottarlo nel trading live: i raggi di ingresso, Stop Loss e Take P
FX Trend MT5 NG
Daniel Stein
5 (4)
FX Trend NG: La Nuova Generazione di Intelligenza di Trend Multi-Mercato Panoramica FX Trend NG è uno strumento professionale di analisi del trend multi-timeframe e monitoraggio dei mercati. Ti consente di comprendere la struttura completa del mercato in pochi secondi. Invece di passare tra numerosi grafici, puoi identificare immediatamente quali strumenti sono in trend, dove il momentum sta diminuendo e dove esiste un forte allineamento tra i timeframe. Offerta di Lancio – Ottieni FX Trend NG
Quantum TrendPulse
Bogdan Ion Puscasu
5 (23)
Ecco   Quantum TrendPulse   , lo strumento di trading definitivo che combina la potenza di   SuperTrend   ,   RSI   e   Stocastico   in un unico indicatore completo per massimizzare il tuo potenziale di trading. Progettato per i trader che cercano precisione ed efficienza, questo indicatore ti aiuta a identificare con sicurezza le tendenze di mercato, i cambiamenti di momentum e i punti di entrata e uscita ottimali. Caratteristiche principali: Integrazione SuperTrend:   segui facilmente l'andame
Se acquisti questo indicatore, riceverai il mio Trade Manager Professionale + EA  GRATUITAMENTE. Innanzitutto è importante sottolineare che questo sistema di trading è un indicatore Non-Repainting, Non-Redrawing e Non-Lagging, il che lo rende ideale sia per il trading manuale che per quello automatico. Corso online, manuale e download di preset. Il "Sistema di Trading Smart Trend MT5" è una soluzione completa pensata sia per i trader principianti che per quelli esperti. Combina oltre 10 indicat
Gann Made Easy è un sistema di trading Forex professionale e facile da usare che si basa sui migliori principi del trading utilizzando la teoria di mr. WD Gann. L'indicatore fornisce segnali ACQUISTA e VENDI accurati, inclusi i livelli di Stop Loss e Take Profit. Puoi fare trading anche in movimento utilizzando le notifiche PUSH. CONTATTAMI DOPO L'ACQUISTO PER RICEVERE GRATUITAMENTE LE ISTRUZIONI DI TRADING E OTTIMI INDICATORI EXTRA! Probabilmente hai già sentito parlare molte volte dei metodi d
Questo cruscotto mostra gli ultimi   pattern armonici   disponibili per i simboli selezionati, in modo da risparmiare tempo ed essere più efficienti /   versione MT4 . Indicatore gratuito:   Basic Harmonic Pattern Colonne dell'indicatore Symbol :   vengono visualizzati i simboli selezionati Trend:   rialzista o ribassista Pattern:   tipo di pattern (gartley, butterfly, bat, crab, shark, cypher o ABCD) Entry:   prezzo di ingresso SL:   prezzo di stop loss TP1:   1 prezzo di take profit TP2:
Grabber System MT5
Ihor Otkydach
4.83 (23)
Ti presento un eccellente indicatore tecnico: Grabber, che funziona come una strategia di trading "tutto incluso", pronta all’uso. In un solo codice sono integrati strumenti potenti per l’analisi tecnica del mercato, segnali di trading (frecce), funzioni di allerta e notifiche push. Ogni acquirente di questo indicatore riceve anche gratuitamente: L’utility Grabber: per la gestione automatica degli ordini aperti Video tutorial passo dopo passo: per imparare a installare, configurare e utilizzare
Atomic Analyst MT5
Issam Kassas
3.94 (31)
Innanzitutto, vale la pena sottolineare che questo indicatore di trading non è repaint, non è ridisegno e non presenta ritardi, il che lo rende ideale sia per il trading manuale che per quello automatico. Manuale utente: impostazioni, input e strategia. L'Analista Atomico è un indicatore di azione del prezzo PA che utilizza la forza e il momentum del prezzo per trovare un miglior vantaggio sul mercato. Dotato di filtri avanzati che aiutano a rimuovere rumori e segnali falsi, e aumentare il pote
Btmm state engine pro
Garry James Goodchild
5 (4)
BTMM State Engine Pro is a MetaTrader 5 indicator for traders who use the Beat The Market Maker approach: Asian session context, kill zone timing, level progression, peak formation detection, and a multi-pair scanner from a single chart. It combines cycle state logic with a built-in scanner dashboard so you do not need the same tool on many charts at once. What it does Draws the Asian session range; session times can follow broker server offset or be set in inputs. Tracks level progression (L
Trend Screener Pro MT5
STE S.S.COMPANY
4.85 (104)
Indicatore di tendenza, soluzione unica rivoluzionaria per il trading di tendenze e il filtraggio con tutte le importanti funzionalità di tendenza integrate in un unico strumento! È un indicatore multi-timeframe e multi-valuta al 100% non ridipingibile che può essere utilizzato su tutti i simboli/strumenti: forex, materie prime, criptovalute, indici e azioni. Trend Screener è un indicatore di tendenza che segue un indicatore efficiente che fornisce segnali di tendenza a freccia con punti nel gra
Presentazione       Quantum Breakout PRO   , l'innovativo indicatore MQL5 che sta trasformando il modo in cui scambi le zone di breakout! Sviluppato da un team di trader esperti con un'esperienza di trading di oltre 13 anni,       Quantum Breakout PRO       è progettato per spingere il tuo viaggio di trading a nuovi livelli con la sua strategia innovativa e dinamica della zona di breakout. Quantum Breakout Indicator ti fornirà frecce di segnalazione sulle zone di breakout con 5 zone target di
Meridian Pro
Ottaviano De Cicco
5 (1)
Meridian Pro 2.00: Professional Multi-Timeframe Trend Matrix for MT5 Meridian Pro 2.00 is a professional adaptive trend matrix for MetaTrader 5. It combines the original Meridian trend engine, a clean chart ribbon, closed-bar signal arrows, an 8-timeframe dashboard, Fuel momentum, weighted consensus, synthetic HTF processing and chart-native higher-timeframe context lines. The goal is simple: read current trend, multi-timeframe structure, strength, momentum and EA-ready state from one discipline
OmniSync Projection
Antonio-alin Teculescu
5 (1)
Chronos Fractal Engine is an innovative price projection indicator for MetaTrader 5, designed to transform your technical analysis by intelligently identifying and projecting historical price patterns. Built upon an advanced correlation algorithm and the fractal principles of the market, this powerful tool visualizes potential future price movements, giving you a unique edge in your trading decisions. What is Chronos Fractal Engine? At its core, the Chronos Fractal Engine employs a sophisticat
Innanzitutto, vale la pena sottolineare che questo Strumento di Trading è un Indicatore Non-Ridipingente, Non-Ridisegnante e Non-Laggante, il che lo rende ideale per il trading professionale. Corso online, manuale utente e demo. L'Indicatore Smart Price Action Concepts è uno strumento molto potente sia per i nuovi che per i trader esperti. Racchiude più di 20 utili indicatori in uno solo, combinando idee di trading avanzate come l'Analisi del Trader del Circolo Interno e le Strategie di Tradin
RelicusRoad Pro: Sistema Operativo Quantitativo di Mercato 70% DI SCONTO ACCESSO A VITA (TEMPO LIMITATO) - UNISCITI A 2.000+ TRADER Perché la maggior parte dei trader fallisce anche con indicatori "perfetti"? Perché operano su Singoli Concetti isolati. Un segnale senza contesto è una scommessa. Per vincere serve CONFLUENZA . RelicusRoad Pro non è un semplice indicatore. È un Ecosistema Quantitativo completo . Mappa la "Fair Value Road", distinguendo tra rumore e rotture strutturali. Smetti di in
FX Levels MT5
Daniel Stein
5 (13)
FX Levels: Supporti e Resistenze di Precisione Eccezionale per Tutti i Mercati Panoramica Rapida Cercate un modo affidabile per individuare livelli di supporto e resistenza in ogni mercato—coppie di valute, indici, azioni o materie prime? FX Levels fonde il metodo tradizionale “Lighthouse” con un approccio dinamico all’avanguardia, offrendo una precisione quasi universale. Basato sulla nostra esperienza reale con i broker e su aggiornamenti automatici giornalieri più quelli in tempo reale, FX
Market Structure Order Block Dashboard MT5 è un indicatore MT5 progettato per i trader che vogliono leggere la struttura di mercato e le principali zone di reazione del prezzo direttamente sul grafico. Combina BOS, ChoCH, Order Blocks, Fair Value Gaps (FVG), Liquidità, Kill Zones, Volume Profile e un pannello compatto per un'analisi rapida. Questo indicatore è rivolto ai trader che utilizzano la struttura di mercato, i concetti ICT e Smart Money come quadro decisionale. Può aiutare a individuare
Market Structure Patterns
Samuel Manoel De Souza
4.47 (19)
Market Structure Patterns   è un indicatore basato sui   Smart Money Concepts   che mostra gli   elementi SMC/ICT   che possono portare le tue decisioni di trading a un livello superiore. Approfitta di   alert ,   notifiche push   e   email   per essere avvisato quando si forma un elemento sul grafico, il prezzo supera un livello e/o entra in una zona. Gli sviluppatori possono accedere ai valori degli elementi dell’indicatore utilizzando le   variabili globali , consentendo l’automazione delle
Cominciamo con la verità. Nessun indicatore da solo ti renderà profittevole. Se qualcuno ti dice il contrario, ti sta vendendo un sogno. Qualsiasi indicatore che mostra frecce perfette di acquisto/vendita può essere reso impeccabile — basta ingrandire la giusta sezione della storia e catturare solo i trade vincenti. Noi non lo facciamo.  SMC Intraday Formula è uno strumento. Legge la struttura del mercato per te, identifica le zone a più alta probabilità e ti mostra esattamente come appare la t
FX Power MT5 NG
Daniel Stein
5 (31)
FX Power: Analizza la Forza delle Valute per Decisioni di Trading Più Intelligenti Panoramica FX Power è lo strumento essenziale per comprendere la reale forza delle principali valute e dell'oro in qualsiasi condizione di mercato. Identificando le valute forti da comprare e quelle deboli da vendere, FX Power semplifica le decisioni di trading e rivela opportunità ad alta probabilità. Che tu segua le tendenze o anticipi inversioni utilizzando valori estremi di Delta, questo strumento si adatta
Crystal Heikin Ashi Signals
Muhammad Jawad Shabir
5 (2)
Crystal Heikin Ashi Signals - Professional Trend & Signal Detection Indicator Advanced Heikin Ashi Visualization with Intelligent Signal System for Manual & Automated Trading Final Price: $149 ---------> Price goes up $10 after every 10 sales . Limited slots available — act fast . Overview Crystal Heikin Ashi Signals is a professional-grade MetaTrader 5 indicator that combines pure Heikin Ashi candle visualization with an advanced momentum-shift detection system. Designed for both manual traders
Trend indicator AI mt5
Ramil Minniakhmetov
5 (17)
Trend Ai indicator è un ottimo strumento che migliorerà l'analisi di mercato di un trader combinando l'identificazione della tendenza con punti di ingresso utilizzabili e avvisi di inversione. Questo indicatore consente agli utenti di navigare nelle complessità del mercato forex con fiducia e precisione Oltre ai segnali primari, l'indicatore Ai di tendenza identifica i punti di ingresso secondari che si presentano durante i pullback o i ritracciamenti, consentendo ai trader di capitalizzare le
KT Alpha Hunter Arrows MT5
KEENBASE SOFTWARE SOLUTIONS
La maggior parte degli indicatori a frecce ti dà un segnale e poi ti lascia capire da solo tutto il resto. KT Alpha Hunter Arrows ti offre un piano di trading completo. Ogni freccia di segnale appare con un piano completo già disegnato: linea di ingresso, stop loss, quattro livelli di take profit e un verdetto live sull’edge, che ti indica se quel simbolo e quel timeframe meritano davvero di essere tradati in quel momento. Il Trade Manager EA incluso gestisce l’esecuzione dopo il tuo ingresso, c
Altri dall’autore
Fusion Cycles
Jean Carlos Souza
Professional Cycle Analysis with MACD Momentum Sync. Fusion Cycles is a high-performance indicator designed to identify market cycles by merging Stochastic dynamics with MACD momentum filtering. It offers a clear visual map of trend strength through its proprietary dynamic-color line system. Key Features: Momentum Synchronization: The main oscillator line changes color (Lime/Red) based on the MACD Histogram slope, preventing trades against the short-term flow. Strategic DNA Zones: Calibrated at
FREE
What is Cipher PRO? It is not a mere "signal" tool. It is a market decoder that identifies Price DNA (strength and volatility). It provides "The North" (context), helping you understand where the price is and where it is likely to head. Visual Identification: Cyan Square: Buy signal. Indicates price DNA has shifted bullish with real momentum. Pink/Magenta Square: Sell signal. Indicates price DNA has shifted bearish with real momentum. Dotted Blue Lines: Your North . The top one is Resistance (ce
FREE
Fibochian Flow
Jean Carlos Souza
Fibochian Flow: Mathematical Precision with 200-Period Trend Filter Fibochian Flow is a professional trading tool that combines dynamic channel volatility with the institutional strength of the 200-period Moving Average. Designed to capture trend ignitions (breakouts), the indicator provides a complete trade setup: Macro Filter, Entry Point, Stop Loss, and three Fibonacci-based Target levels. How Fibochian Flow Works: Trend Filter (Orange Line): Acts as the market's ultimate guide. We only look
FREE
Smooth Trend
Jean Carlos Souza
ST Smooth Trend: Silence the Market Noise Trading doesn't have to be a guessing game. Most traders lose money because they react to every small price wiggle. ST Smooth Trend was built to give you a crystal-clear view of the market by filtering out the chaos. Key Benefits for Your Trading: Intuitive Color System: No more confusion. Green means trend up, Red means trend down, and Gray tells you the market is flat—protecting your capital when there’s no clear direction. Visual Safety Zones: The dot
FREE
Pure Path
Jean Carlos Souza
ST Pure Path Indicator Description for Metatrader ST Pure Path Indicator Description for Metatrader This document aims to provide a clear and accessible description of the ST Pure Path indicator, developed for the Metatrader platform. It is designed to assist traders, especially those with little experience, in identifying market trends and decision points visually and intuitively. 1. Visual Identification The ST Pure Path appears on the chart as a continuous, solid line , with a thickness of 2
FREE
Heat MA
Jean Carlos Souza
Heat MA Description - English Heat MA Indicator: A Simplified Guide for Traders The Heat MA indicator is a powerful visual tool designed to identify the intensity of trading flow and market pressure directly on your chart. It appears as a continuous line that changes color, offering clear signals about price behavior and underlying volume. 1. How Heat MA Appears on the Chart Imagine a single, robust line (4 pixels thick) that moves along with the price. This line is not just a trace; it's a mark
FREE
Dynamics Edge
Jean Carlos Souza
Dynamics Edge: Statistical Precision in Mean Reversion Dynamics Edge is a volatility boundary indicator designed to identify price exhaustion with high precision. Using an advanced standard deviation calculation ( $2.2 \sigma$ ), it maps the extremities where price is statistically likely to return to equilibrium (median). Key Features: Dynamic Exhaustion Edges: Solid lines that expand and contract based on volatility, identifying overbought (Blue) and oversold (Red) zones. OCR-Ready Price Tags:
FREE
ST Safe Guard: The Intelligent Shield Against Irregular Volatility The financial market is unforgiving. Most traders lose months of profit in just 5 minutes during high-impact news or irrational volatility spikes. ST Safe Guard is your first line of defense — a real-time monitoring system that decides, with mathematical precision, whether the market is safe or restricted for trading. Why every professional needs it: News Sentinel: Synced with the Economic Calendar, it visually flags the chart 30
FREE
ST Flow Context
Jean Carlos Souza
ST Flow Context: The Professional Trader’s Compass ST Flow Context is a macro analysis tool developed to identify the predominant direction of institutional money. It filters out intraday noise and delivers the real market context, helping the trader never to trade against the main tide. Key Features: Trend Alignment: Identifies whether the daily flow is bullish or bearish based on multiple timeframes. Interest Zones: Maps where institutional volume is defending positions. Entry Filter: Use Flow
FREE
ST Multi Regression Indicator Guide for Beginners Simplified Guide: ST Multi Regression Indicator for Beginners What is it? It's a visual tool that helps identify good times to buy or sell in the financial market, based on colors and signals that appear on the chart. How does it work? Main Elements: Main Line (Oscillator) Blue (Aqua): Good time to buy Orange: Good time to sell Dotted Line (Silver) Serves as reference for signals Arrows ️ Blue: Buy signal ️ Orange: Sell signal When to Trade?
FREE
Filtro:
Nessuna recensione
Rispondi alla recensione