Volume Profile Pack

VP-VWAP Pack — Features
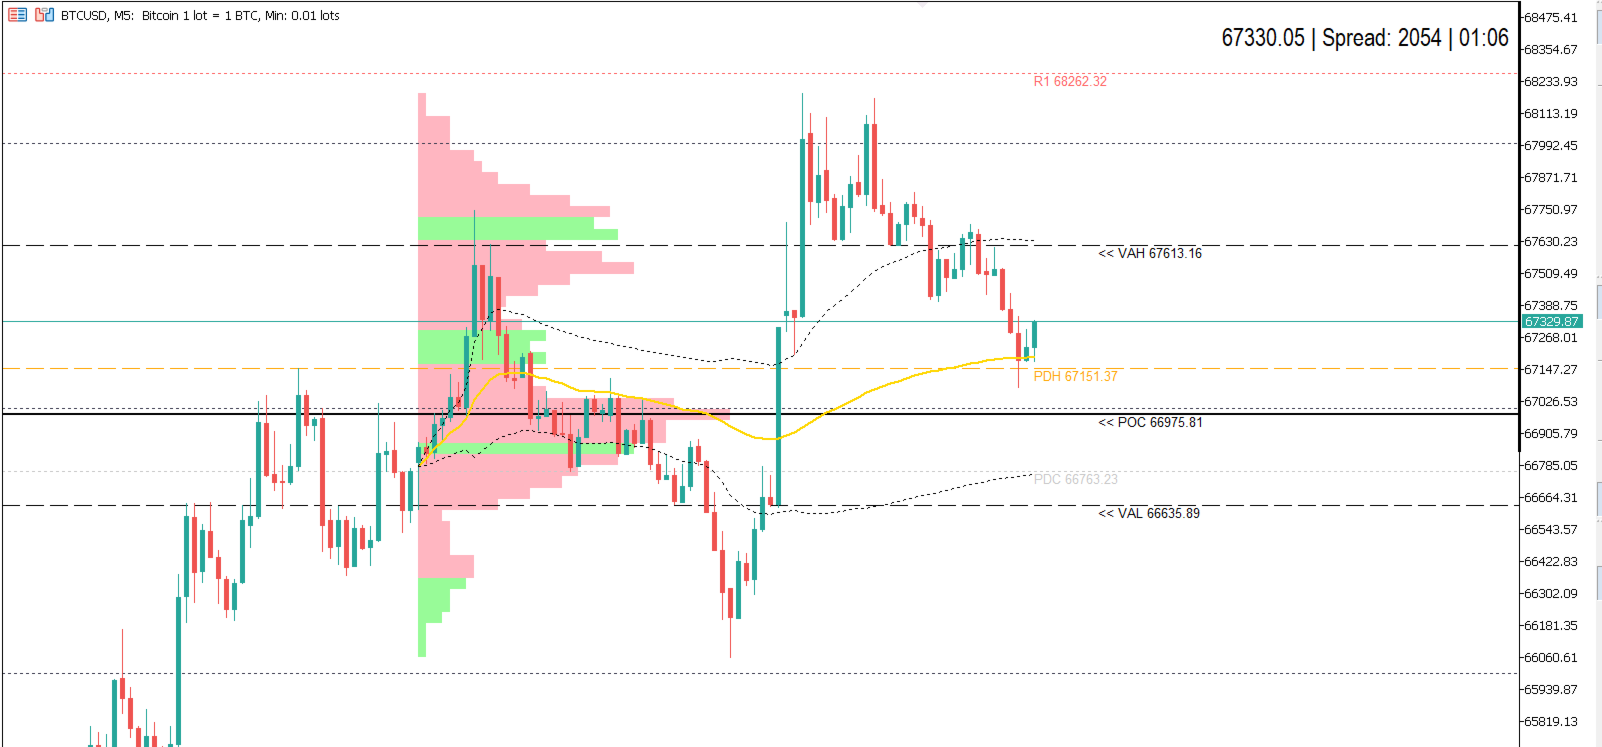

Session VWAP

  • Volume-Weighted Average Price anchored to your defined session start time
  • ±1 Standard Deviation bands (configurable multiplier)
  • Automatically resets each session — no carryover from previous day
  • Gold solid VWAP line with dotted upper/lower bands

Session Volume Profile

  • Price-bucketed volume histogram drawn from session start to current bar
  • Delta-colored bars: green for net buying, pink/red for net selling
  • Configurable row count (default 50) and value area percentage (default 70%)
  • Automatically calculates and plots:
    • POC (Point of Control) — highest volume price level
    • VAH (Value Area High) — upper boundary of the value area
    • VAL (Value Area Low) — lower boundary of the value area
  • Smart rebuild: only recalculates when session data changes (anti-flicker)
  • Toggle delta coloring on/off with a single input

Key Levels

  • Previous Day High / Low / Close — orange dashed lines with price labels
  • Classic Pivot Points — PP, R1, R2, S1, S2
  • Round Numbers — auto-detects step size based on instrument:
    • EURUSD/GBPUSD → 50 pips
    • USDJPY → 0.500
    • XAUUSD → 50 points
    • BTC → 500 points
    • SPX500 → 100 points
    • Or set any custom value manually (input 0 = auto-detect)
  • Each level type can be toggled on/off independently

Info Bar

  • Live price, spread (in points), and candle countdown timer
  • Configurable corner position (any of the four chart corners)
  • User-selectable font and font size (default: Arial Narrow, size 15)
  • 1-second refresh for real-time accuracy
  • Auto-handles hours display for H1+ timeframes (e.g. 1:23:45 vs 03:40)
  • Pure ASCII text — no font compatibility issues

General

  • Single chart-window indicator — no sub-windows required
  • Lightweight: no timer-driven scoring, no unnecessary calculations
  • Clean object management with anti-flicker pattern
  • Fully configurable session times for any broker/timezone

Prodotti consigliati
Anchored VWAP Trading Indicator Struggling to identify true market value and key support/resistance levels? The Anchored VWAP Trading Indicator helps you track price based on real traded volume, giving you a clear edge in your trading decisions. This tool allows you to anchor VWAP from any point on the chart, making it ideal for analyzing trends, reversals, and institutional activity. Key Features Anchored VWAP from any candle Accurate volume-weighted price calculation Works on all symbol
VWAP Indicator MT5
Kyra Nickaline Watson-gordon
Description : VWAP (Volume-Weighted Average Price) is the ratio of the value traded to total volume traded over a particular time horizon. It is a measure of the average price at which pair is traded over the trading horizon. Read More. All Symbols and All Timeframes are supported. Indicator Inputs :     VWAP Mode : Mode of VWAP Calculation. Options can be selected : Single,Session,Daily,Weekly,Monthly     Volumes : Real Volumes,Tick Volumes     Price Type : Used price for calculating. O
Fixed Volume Profile
Carlos Pascual Perez Maturano
This indicator, titled "Fixed Volume Profile.mq5", is a custom tool for MetaTrader 5 (MQL5) designed to calculate and display a Volume Profile over a user-defined fixed time range. The Volume Profile shows the distribution of trading volume at different price levels during a specific period, helping to identify areas of high activity (such as Points of Control or POCs) and volume-based support/resistance areas. Main Functionality: Interactive Range: The indicator creates two vertical lines on
FREE
DMJ Magical AVWAP
Dominic Minguy Jean
Automated Anchored Volume Weighted Average Price You set a period, and the indicator will find the highest and lowest price point in the period and derive a AVWAP from there. It also prints out a median line. You can use the generated VWAP lines as a channel, as S/R levels or as a volatility indicator. It's based on tick volume to be compatible with most CFD brokers. Happy trading!
SMC Vision
Kriangkrai Pongtiwat
SMC ProVision 2.0 — Professional Smart Money Concept Analysis Stop guessing. Start reading the market like institutions do. SMC ProVision maps the full smart money footprint directly on your chart — with a clean, minimal design that won't clutter your screen. Market Structure — BOS / CHoCH with HH・HL・LH・LL labels Order Blocks — Standard & Refined with mitigation tracking Breaker Blocks — Auto-converted from mitigated OBs Fair Value Gaps — Fill percentage & mitigation status Liquidity —
FREE
ShortBS是一个很好的短线交易指示器,能很好与 BestPointOfInitiation ( https://www.mql5.com/zh/market/product/96671 )配合,能让你找到最合适的buy和sell位置,指标不含有未来函数,不会重新绘制。是一个针对(如果你感觉到这个指标能够帮助你进行更准确的交易,请帮忙给个好评,希望我的作品能够帮助更多有需要的人) ===================参数列表===================== maPeriod: 25 slowPeriod:20 fastPeriod:10 stepPeriod:5 =================参考使用方法=================== 此指标可以适用于任何交易品种,能够用在任何周期。
SyncCrosshair Pro
Jaume Sancho Serra
OVERVIEW SyncCrosshair Pro synchronizes your crosshair across all open chart windows. When you move your mouse on one chart, all other charts instantly display the crosshair at the exact same time position. Perfect for traders who analyze multiple timeframes or correlated instruments simultaneously. KEY FEATURES Multi-Chart Crosshair Sync • Vertical line synchronized by time • Horizontal line synchronized by price • Works across different symbols (EURUSD, XAUUSD, indices, crypto...) • Works ac
RSIScalperPro
PATRICK WENNING
Introducing RSIScalperPro - the revolutionary RSI-based indicator for Metatrader 5, specifically designed for scalping in the one-minute chart. With RSIScalperPro, you'll have a powerful toolkit for precise entry and exit signals to take your trading to the next level. RSIScalperPro utilizes two different RSI indicators that provide clear signals for overbought and oversold areas. You can customize the time periods and limit values of the two RSIs according to your preferences to achieve the be
Ict institutional zones
Marrion Netondo Wabomba
SMC VALID EA (MT5) Version: 1.10 Author: Marrion Brave Wabomba Category: Smart Money Concepts (SMC) and  ICT concepts ICT Smart Money Daily Zones (SMC Pro)  ICT Smart Money Daily Zones (SMC Pro) – ICT Daily Buy & Sell Zones Pro is a professional-grade Smart Money Concepts (SMC) / ICT trading indicator for MetaTrader 5, designed to clearly map institutional daily levels and guide traders with high-probability decision zones . This indicator automatically analyzes the Daily timeframe (PDH / PD
Hydra Trend Rider is a non-repainting, multi-timeframe trend indicator that delivers precise buy/sell signals and real-time alerts for high-probability trade setups. With its color-coded trend line, customizable dashboard, and mobile notifications, it's perfect for traders seeking clarity, confidence, and consistency in trend trading. Setup & Guide:  Download  MT4 Version here. To learn how to use the Indicator: Indicator Manual & Guide -   Read Here Follow our MQL5 channel for daily market ins
Volume Profile SAF - Institutional-Grade Volume-informed Market Structure Indicator     Unlock Professional Market Intelligence with less Effort   Stop guessing. Start seeing. The Volume Profile SAF (Set and Forget) transforms complex market structure analysis into crystal-clear, actionable trading signals that institutional traders pay thousands for. Experience the power of real-time volume profiling, value area tracking, and precision POC cross alerts - all in one lightweight, EA-ready indicat
The Institutional Flow Sentinel (Net Sentiment Volume AKA NSV) SEE VOLUME HAPPENING ON THE GO!!!!!!! Overview Retail traders look at price. Institutions look at order flow . The Institutional Flow Sentinel is a high-precision algorithmic system designed to decode the hidden battle between buyers and sellers. By analyzing real-time volume delta and identifying supply/demand imbalances, this system allows you to stop guessing and start trading with the "Smart Money." Why Order Flow? Price charts
Horizontal Volumes Indicator - using a histogram, displays the volume of transactions at a certain price without reference to time. At the same time, the histogram appears directly in the terminal window, and each column of the volume is easily correlated with the quote value of the currency pair. The indicator practically does not require changing the settings, and if desired, any trader can figure them out. The volume of transactions is of great importance in exchange trading, usually an inc
The Quantitative Qualitative Estimation (QQE) indicator is derived from Wilder’s famous Relative Strength Index (RSI). In essence, the QQE is a heavily smoothed RSI. Modification of this version: ( converted from tradingview script by Mihkell00, original from Glaz, 100% identical output) So there are Two QQEs. One that is shown on the chart as columns, and the other "hidden" in the background which also has a 50 MA   bollinger band   acting as a zero line. When both of them agree - you get a b
UR VolumeTrend MT5
Krzysztof Jan Debski
UR VolumeTrend   UR VolumeTrend è l'indicatore di volume più chiaro che mostra la tendenza in corso in termini di volume. Funziona perfettamente con altri indicatori proprio come UR TrendExhaustion per segnalare massimi e minimi locali. Limitato a soli 2 parametri: più alti sono i valori, più lunghe saranno le tendenze che mostrerà. Gli estremi del gradiente mostrano possibili esaurimenti di volume per catturare una potenziale inversione. Due righe: l'andamento del volume e la media. Il migli
Trailing Uses Standard Deviation.   A daptive_Trailing_uses_StdDev_Indicator is an indicator of directional movement that allows you to identify a trend at the time of its inception and set the levels of a protective stop. Unlike trailing with a constant distance, the indicator uses the distance to the price proportional to the current standard deviation of StdDev. The distance is equal to the product of the standard deviation and the constant coefficient set by the user. Thus, the trailing
About indicator > The indicator is a function based on one value (open/high prices up to now) and then it is a mathematical representation of the whole function that is totally independent from any else values. So, if you ask yourself will the future be as it is on the graph... I can tell you - as it was the same as the trading function up to the moment "now"... In conclusion, the point of the indicator is  to try to show the future of the trading function into eternity. The graphic is sometime
Clarity Pulse Detector
Camila Bernardez Camero
Clarity Pulse Detector Clarity Pulse Detector analizza le barre chiuse e le barre di volume associate per identificare vere inversioni di tendenza senza fare affidamento sui dati futuri. L’indicatore calcola la forza dell’impulso basandosi sui parametri SSP (Signal Strength Parameter) configurabili e confronta massimi e minimi recenti per individuare i punti di rottura. Quando viene rilevata un’inversione valida, l’indicatore mostra un cerchio verde sotto una barra rialzista come segnale di a
Vwap Bands Auto
Ricardo Almeida Branco
The Vwap Bands Auto indicator seeks to automatically map the maximum market frequency ( automatic update of the outermost band ) and has two intermediate bands that also adjust to daily volatility. Another tool from White Trader that combines price and volume, in addition to mapping the daily amplitude. The external band is updated automatically when the daily maximum or minimum breaks the current frequency, and can be an input signal, seeking a return to the daily vwap. Thus, in addition t
The 4 headed dragon is an indicator that has two functions. 1) Set the background trend. 2) Mark the predominant trend. By combining these two indicator signals, we will be able to trade for or against the trend, adapting the signals to your reading of the market. You can download the demo and test it yourself. 1) Set the background trend.    Define four possibilities of trend that are the four heads of the dragon, marked by colors on the indicator, marking a) Powerful buying trend. b) Weak
SimpleprobMT5
Augusto Martins Lopes
Indicatore di Probabilità Descrizione L'Indicatore di Probabilità è uno strumento progettato per i trader che desiderano identificare opportunità di acquisto e vendita analizzando le candele precedenti. Calcola la probabilità di rialzo ( CALL ) e ribasso ( PUT ) in base al numero di candele analizzate e mostra frecce sul grafico per segnalare possibili punti di ingresso. Caratteristiche Analisi delle candele : Analizza un numero configurabile di candele per calcolare le probabilità di rialzo e r
Onscreen Calendar uses the Metatrader calendar events and displays them automatically right on the screen within the range of days of your choice. With many factors influencing every trade, it is easy to lose sight of what truly moves the market, so having the calendar visible at all times can greatly help. You will also save a lot of time understanding how different types of news, such as moderate impact news, affect the market.  You have total control of the content to display on your screen.
==================================================================== SMT DIVERGENCE - NASDAQ vs S&P500 (NAS100 / US500) MQL5 Market Product Description ==================================================================== PRODUCT NAME: SMT Divergence Nasdaq vs S&P500 | Smart Money Index Scalper SHORT DESCRIPTION (max 63 chars): Spot Nasdaq reversals using SMT Divergence with S&P500 ---------------------------------------------------------------------- FULL DESCRIPTION ---------------------
Session Volume Profile — Daily + Weekly Know where the volume is. Trade with the market, not against it. What It Does Session Volume Profile maps exactly where volume was traded across price — for the current day and optionally the full trading week. Updated in real time, directly on your chart. At a glance you can see where the market accepted price, where it rejected it, and where the key reference levels are for the session ahead. No repainting. No clutter. Just clean, actionable levels. Key
Появилось желание торговать  движение, пробой на самой  высокой волатильности, или запустить советника-усреднителя торговать боковик в тихой низковолатильной гавани тогда этот продукт для Вас! Индикатор анализирует 28 валютных пар (основные и кроссы) и в зависимости от выбранных настроек покажет самые высоковолатильные (max) или наоборот (min).       Как измерить волатильность? Существует 2 способа. Первый это измерить  рендж заданного количества последних баров (bar). Второй замерить о
Title: Smart VP: Buy/Sell Bars + POC Description: Enhance your trading with the Right Anchored Volume Profile. Visualize buy and sell volumes per price level with near-bar numbers and identify the Point of Control (POC) instantly. Perfect for traders who want clear market structure at a glance. Features: Right Anchored Volume Profile Buy/Sell volume bars Near-bar volume numbers POC (Point of Control) line Customizable colors and display settings
Institutional Tick Engine Pro: Analisi Velocità Tick e Mappa di Calore Institutional Tick Engine Pro è una suite di analisi tecnica progettata per elaborare i dati Tick grezzi. Sintetizza metriche di Flusso Ordini tra cui Velocità, Mappe di Calore e modelli di Microstruttura. Caratteristiche Principali 1. Monitor Velocità Tick Misura la velocità del mercato (Tick Per Secondo) per analizzare l'aggressività dei movimenti di prezzo. 2. Mappa di Calore Liquidità Sintetica Visualizza le "zone di asso
Market Ticker Pro MT5
John Louis Fernando Diamante
The only Market Ticker on the market! Add a professional novelty to your workspace, with built in mini-charts A scrolling Market Ticker that displays price changes from all symbols in the Market Watch list. Provides an easy snapshot of symbol prices, and keeps scrolling automatically while you trade and analyse the chart. The ticker color (+/- price changes) are based on either the current or completed candle, and the previous candle. Options include: - MTF, eg choose to show price changes of t
CRV Z-Score Engine is a professional market structure indicator that transforms raw price into normalized,  multi-horizon statistical structure model   It reveals: When price is statistically stretched When the market is transitioning between regimes When a move is structurally aligned across multiple horizons This is not a lagging oscillator . It is a multi-horizon statistical structure model built for serious traders. WHAT IS Z-SCORE? Z-Score measures how far price deviates from its n
The indicator calculates ZigZag using the classic algorithm with three parameters: Depth, Deviation, and Backstep. Its main function is detecting and visualizing repaints — moments when the last ZigZag point shifts to a new bar. Upon loading, the indicator performs a simulation over the specified history depth. The algorithm sequentially recalculates ZigZag for each bar, comparing the current position of the last point with the previous one. If a shift is detected, a repaint line appears on the
FREE
Gli utenti di questo prodotto hanno anche acquistato
SuperScalp Pro
Van Minh Nguyen
4.55 (20)
SuperScalp Pro – Sistema avanzato di indicatore per scalping con filtri multipli SuperScalp Pro è un sistema avanzato di indicatore per scalping che combina il classico Supertrend con molteplici filtri di conferma intelligenti. L’indicatore funziona in modo efficiente su tutti i timeframe da M1 a H4 ed è particolarmente adatto per XAUUSD, BTCUSD e le principali coppie Forex. Può essere utilizzato come sistema stand-alone o integrato in modo flessibile nelle strategie di trading esistenti. L’indi
Entry In The Zone and SMC Multi Timeframe is a real-time 2-in-1 market analysis tool that combines market structure analysis and a No Repaint BUY / SELL signal system into a single indicator, built on Smart Money Concepts (SMC) — a widely adopted framework used by professional traders to understand market structure. This indicator helps you see the market more clearly, make decisions based on structure rather than guesswork, and focus on high-probability zones where price is more likely to react
Divergence Bomber
Ihor Otkydach
4.9 (86)
Ogni acquirente dell’indicatore riceverà inoltre gratuitamente: L’utilità esclusiva “Bomber Utility”, che gestisce automaticamente ogni operazione, imposta i livelli di Stop Loss e Take Profit e chiude le posizioni secondo le regole della strategia I file di configurazione (set file) per adattare l’indicatore a diversi asset I set file per configurare il Bomber Utility in tre modalità: “Rischio Minimo”, “Rischio Bilanciato” e “Strategia di Attesa” Una guida video passo-passo per installare, conf
Azimuth Pro
Ottaviano De Cicco
5 (6)
Azimuth Pro V2: Synthetic Fractal Structure and Confirmed Entries for MT5 Overview Azimuth Pro is a multi-level swing structure indicator by Merkava Labs . Four nested swing layers, swing-anchored VWAP, ABC pattern detection, three-timeframe structural filtering, and closed-bar confirmed entries — one chart, one workflow from micro-swings to macro-cycles. This is not a blind signal product. It is a structure-first workflow for traders who care about location, context, and timing. V2 Launch Offe
Quantum TrendPulse
Bogdan Ion Puscasu
5 (23)
Ecco   Quantum TrendPulse   , lo strumento di trading definitivo che combina la potenza di   SuperTrend   ,   RSI   e   Stocastico   in un unico indicatore completo per massimizzare il tuo potenziale di trading. Progettato per i trader che cercano precisione ed efficienza, questo indicatore ti aiuta a identificare con sicurezza le tendenze di mercato, i cambiamenti di momentum e i punti di entrata e uscita ottimali. Caratteristiche principali: Integrazione SuperTrend:   segui facilmente l'andame
Gann Made Easy è un sistema di trading Forex professionale e facile da usare che si basa sui migliori principi del trading utilizzando la teoria di mr. WD Gann. L'indicatore fornisce segnali ACQUISTA e VENDI accurati, inclusi i livelli di Stop Loss e Take Profit. Puoi fare trading anche in movimento utilizzando le notifiche PUSH. CONTATTAMI DOPO L'ACQUISTO PER RICEVERE GRATUITAMENTE LE ISTRUZIONI DI TRADING E OTTIMI INDICATORI EXTRA! Probabilmente hai già sentito parlare molte volte dei metodi d
Se acquisti questo indicatore, riceverai il mio Trade Manager Professionale + EA  GRATUITAMENTE. Innanzitutto è importante sottolineare che questo sistema di trading è un indicatore Non-Repainting, Non-Redrawing e Non-Lagging, il che lo rende ideale sia per il trading manuale che per quello automatico. Corso online, manuale e download di preset. Il "Sistema di Trading Smart Trend MT5" è una soluzione completa pensata sia per i trader principianti che per quelli esperti. Combina oltre 10 indicat
FX Trend MT5 NG
Daniel Stein
5 (4)
FX Trend NG: La Nuova Generazione di Intelligenza di Trend Multi-Mercato Panoramica FX Trend NG è uno strumento professionale di analisi del trend multi-timeframe e monitoraggio dei mercati. Ti consente di comprendere la struttura completa del mercato in pochi secondi. Invece di passare tra numerosi grafici, puoi identificare immediatamente quali strumenti sono in trend, dove il momentum sta diminuendo e dove esiste un forte allineamento tra i timeframe. Offerta di Lancio – Ottieni FX Trend NG
OmniSync Projection
Antonio-alin Teculescu
5 (1)
Chronos Fractal Engine is an innovative price projection indicator for MetaTrader 5, designed to transform your technical analysis by intelligently identifying and projecting historical price patterns. Built upon an advanced correlation algorithm and the fractal principles of the market, this powerful tool visualizes potential future price movements, giving you a unique edge in your trading decisions. What is Chronos Fractal Engine? At its core, the Chronos Fractal Engine employs a sophisticat
Presentazione       Quantum Breakout PRO   , l'innovativo indicatore MQL5 che sta trasformando il modo in cui scambi le zone di breakout! Sviluppato da un team di trader esperti con un'esperienza di trading di oltre 13 anni,       Quantum Breakout PRO       è progettato per spingere il tuo viaggio di trading a nuovi livelli con la sua strategia innovativa e dinamica della zona di breakout. Quantum Breakout Indicator ti fornirà frecce di segnalazione sulle zone di breakout con 5 zone target di
CGE Trading Suite
Carl Gustav Johan Ekstrom
5 (2)
Institutional-Grade Analytics for MT5 C GE Trading Suite delivers the analytical edge typically reserved for professional trading desks. The platform integrates a full suite of analytical tools into one seamless workflow: dynamic grid mapping, liquidity behavior analysis, ECM, trend lines, MIDAS, trade cycles, and directional channel projections. Together, these provide a unified view of market structure and momentum. Directional clarity is further enhanced by the capital flow index, which meas
Scopri quale strategia funziona davvero sul tuo simbolo - prima di rischiare denaro reale. Power Bar rileva le barre di prezzo estreme su qualsiasi simbolo e qualsiasi timeframe, poi esegue istantaneamente il backtest di 3 diverse strategie di trading per confrontare tassi di vincita, fattori di profitto e P&L fianco a fianco. Tutto in un unico pannello interattivo. Niente supposizioni. Niente curve-fitting. Solo dati. Cosa rende Power Bar unico? La maggior parte degli indicatori fornisce un se
Meridian Pro
Ottaviano De Cicco
5 (1)
Meridian Pro: Professional Multi-Timeframe Trend Matrix for MT5 Overview Meridian Pro is a multi-timeframe trend matrix by Merkava Labs that compresses directional state, strength, momentum condition and matrix agreement into one compact panel. One adaptive engine, applied consistently from M1 to W1. No per-symbol tuning. No indicator stacking. One structured readout across every asset and every timeframe. Launch Offer — Get Meridian Pro for USD 99 (introductory). Regular price: USD 149. 1. Why
Grabber System MT5
Ihor Otkydach
4.83 (23)
Ti presento un eccellente indicatore tecnico: Grabber, che funziona come una strategia di trading "tutto incluso", pronta all’uso. In un solo codice sono integrati strumenti potenti per l’analisi tecnica del mercato, segnali di trading (frecce), funzioni di allerta e notifiche push. Ogni acquirente di questo indicatore riceve anche gratuitamente: L’utility Grabber: per la gestione automatica degli ordini aperti Video tutorial passo dopo passo: per imparare a installare, configurare e utilizzare
Trend Screener Pro MT5
STE S.S.COMPANY
4.85 (104)
Indicatore di tendenza, soluzione unica rivoluzionaria per il trading di tendenze e il filtraggio con tutte le importanti funzionalità di tendenza integrate in un unico strumento! È un indicatore multi-timeframe e multi-valuta al 100% non ridipingibile che può essere utilizzato su tutti i simboli/strumenti: forex, materie prime, criptovalute, indici e azioni. Trend Screener è un indicatore di tendenza che segue un indicatore efficiente che fornisce segnali di tendenza a freccia con punti nel gra
Btmm state engine pro
Garry James Goodchild
5 (4)
BTMM State Engine Pro is a MetaTrader 5 indicator for traders who use the Beat The Market Maker approach: Asian session context, kill zone timing, level progression, peak formation detection, and a multi-pair scanner from a single chart. It combines cycle state logic with a built-in scanner dashboard so you do not need the same tool on many charts at once. What it does Draws the Asian session range; session times can follow broker server offset or be set in inputs. Tracks level progression (L
Atomic Analyst MT5
Issam Kassas
3.94 (31)
Innanzitutto, vale la pena sottolineare che questo indicatore di trading non è repaint, non è ridisegno e non presenta ritardi, il che lo rende ideale sia per il trading manuale che per quello automatico. Manuale utente: impostazioni, input e strategia. L'Analista Atomico è un indicatore di azione del prezzo PA che utilizza la forza e il momentum del prezzo per trovare un miglior vantaggio sul mercato. Dotato di filtri avanzati che aiutano a rimuovere rumori e segnali falsi, e aumentare il pote
Crystal Heikin Ashi Signals
Muhammad Jawad Shabir
5 (2)
Crystal Heikin Ashi Signals - Professional Trend & Signal Detection Indicator Advanced Heikin Ashi Visualization with Intelligent Signal System for Manual & Automated Trading Final Price: $149 ---------> Price goes up $10 after every 10 sales . Limited slots available — act fast . Overview Crystal Heikin Ashi Signals is a professional-grade MetaTrader 5 indicator that combines pure Heikin Ashi candle visualization with an advanced momentum-shift detection system. Designed for both manual traders
FX Power MT5 NG
Daniel Stein
5 (31)
FX Power: Analizza la Forza delle Valute per Decisioni di Trading Più Intelligenti Panoramica FX Power è lo strumento essenziale per comprendere la reale forza delle principali valute e dell'oro in qualsiasi condizione di mercato. Identificando le valute forti da comprare e quelle deboli da vendere, FX Power semplifica le decisioni di trading e rivela opportunità ad alta probabilità. Che tu segua le tendenze o anticipi inversioni utilizzando valori estremi di Delta, questo strumento si adatta
RelicusRoad Pro: Sistema Operativo Quantitativo di Mercato 70% DI SCONTO ACCESSO A VITA (TEMPO LIMITATO) - UNISCITI A 2.000+ TRADER Perché la maggior parte dei trader fallisce anche con indicatori "perfetti"? Perché operano su Singoli Concetti isolati. Un segnale senza contesto è una scommessa. Per vincere serve CONFLUENZA . RelicusRoad Pro non è un semplice indicatore. È un Ecosistema Quantitativo completo . Mappa la "Fair Value Road", distinguendo tra rumore e rotture strutturali. Smetti di in
ARICoins
Temirlan Kdyrkhan
ARICoin is a powerful trading companion designed to generate high-probability entry signals with dynamic TP/SL/DP levels based on volatility. Built-in performance tracking shows win/loss stats, PP1/PP2 hits, and success rates all updated live. Key Features: Buy/Sell signals with adaptive volatility bands Real-time TP/SL/DP levels based on ATR Built-in MA Filter with optional ATR/StdDev volatility Performance stats panel (Success, Profit/Loss, PP1/PP2) Alerts via popup, sound, push, or email Cust
ARIPoint
Temirlan Kdyrkhan
ARIPoint is a powerful trading companion designed to generate high-probability entry signals with dynamic TP/SL/DP levels based on volatility. Built-in performance tracking shows win/loss stats, PP1/PP2 hits, and success rates all updated live. Key Features: Buy/Sell signals with adaptive volatility bands Real-time TP/SL/DP levels based on ATR Built-in MA Filter with optional ATR/StdDev volatility Performance stats panel (Success, Profit/Loss, PP1/PP2) Alerts via popup, sound, push, or email Cu
Meravith Scanner
Ivan Stefanov
5 (1)
MERAVITH SCANNER è un indicatore professionale per i mercati finanziari su MetaTrader 5, che integra più strumenti di analisi in un unico sistema. Esegue tutti i calcoli automaticamente utilizzando una metodologia proprietaria basata sul prezzo medio ponderato per il volume (VWAP), eliminando completamente l’interpretazione soggettiva. L’indicatore funziona su tutte le classi di asset (Forex, Azioni, Indici, Commodities, Criptovalute) e su tutti i timeframe, da M1 a Mensile. Il principio fondame
Blahtech Supply Demand MT5
Blahtech Limited
4.54 (13)
Was: $299  Now: $99  Supply Demand uses previous price action to identify potential imbalances between buyers and sellers. The key is to identify the better odds zones, not just the untouched ones. Blahtech Supply Demand indicator delivers functionality previously unavailable on any trading platform. This 4-in-1 indicator not only highlights the higher probability zones using a multi-criteria strength engine, but also combines it with multi-timeframe trend analysis, previously confirmed swings a
La Master Edition è uno strumento analitico di livello professionale progettato per visualizzare la struttura del mercato attraverso l'obiettivo del volume e del flusso di denaro. A differenza degli indicatori di volume standard, questo strumento visualizza un Profilo di Volume Giornaliero direttamente sul tuo grafico, permettendoti di vedere esattamente dove si è verificata la scoperta dei prezzi e dove è posizionato il "denaro intelligente". Questa Master Edition è progettata per chiarezza e v
Candle Smart Range
Gianny Alexander Lugo Sanchez
5 (1)
Candle Smart Range (CSR) per MetaTrader 5 Candle Smart Range è un indicatore tecnico progettato per l'identificazione automatica dei range di prezzo su più timeframe. Questo strumento analizza la struttura del mercato basandosi sulle formazioni delle candele e sull'interazione del prezzo con i massimi e i minimi precedenti. Caratteristiche principali: Rilevamento Range: Identifica le zone di consolidamento prima dei movimenti impulsivi. Identificazione Falsi Breakout: Segnala quando il prezzo su
Auto Optimized Parabolic RSI: Motore di Momentum 3D Avanzato La maggior parte degli indicatori per trader privati fallisce perché si affida a parametri statici che smettono di funzionare nel momento in cui la volatilità del mercato cambia. Auto Optimized Parabolic RSI risolve il problema dell'"obsolescenza dell'indicatore" ricalcolando continuamente il proprio vantaggio matematico, portando un adattamento quantitativo di livello istituzionale direttamente sul tuo terminale MT5. Il Vantaggio Prin
Innanzitutto, vale la pena sottolineare che questo Strumento di Trading è un Indicatore Non-Ridipingente, Non-Ridisegnante e Non-Laggante, il che lo rende ideale per il trading professionale. Corso online, manuale utente e demo. L'Indicatore Smart Price Action Concepts è uno strumento molto potente sia per i nuovi che per i trader esperti. Racchiude più di 20 utili indicatori in uno solo, combinando idee di trading avanzate come l'Analisi del Trader del Circolo Interno e le Strategie di Tradin
Gartley Hunter Multi
Siarhei Vashchylka
5 (11)
Gartley Hunter Multi - An indicator for searching for harmonic patterns simultaneously on dozens of trading instruments and on all possible timeframes. Manual (Be sure to read before purchasing) | Version for MT4 Advantages 1. Patterns: Gartley, Butterfly, Shark, Crab. Bat, Alternate Bat, Deep Crab, Cypher 2. Simultaneous search for patterns on dozens of trading instruments and on all possible timeframes 3. Search for patterns of all possible sizes. From the smallest to the largest 4. All fou
Bill Williams Advanced
Siarhei Vashchylka
5 (11)
Bill Williams Advanced is designed for automatic chart analysis using Bill Williams' "Profitunity" system. The indicator analyzes four timeframes at once. Manual (Be sure to read before purchasing) Advantages 1. Analyzes the chart using Bill Williams' "Profitunity" system. Signals are displayed in a table in the corner of the screen and on the price chart. 2. Finds all known AO and AC signals, as well as zone signals. Equipped with a trend filter based on the Alligator. 3. Finds "Divergence Bar
Altri dall’autore
HTF 6 Candles
Nar Bahadur Sen
5 (1)
NareshHTFCandles — Features 6 configurable HTF slots (default: M15 · M30 · H1 · H4 · D1 · W1) Each slot independently enable/disable, set timeframe, candle count, and trace Candles drawn to the right of price as chart objects — no subwindow Bullish/bearish body coloring with separate bull/bear wick colors Adjustable candle width, spacing between candles, and spacing between slot groups Wick thickness control via divisor (thick → thin) Forming (current) candle updates live on every tick FVG detec
FREE
Naresh Volume Profile
Nar Bahadur Sen
4.67 (3)
HOW TO USE Draw a profile: Hold CTRL + Left Click and drag across any area on the chart. Release the mouse to generate the volume profile. Delete last profile: Press the DEL key on your keyboard. Delete specific profile: Click the red button at the top-left corner of any profile. Cancel while drawing: Press ESC to abort a drag in progress. Switch timeframes freely: Profiles persist when switching between timeframes (e.g., 4H → 1H → 15M and back). Change settings live: Open indicator properti
FREE
The indicator is a bundle of EIGHT different fundamental functions required for a trader: 1] Forex Session where you can determine your own timings/highlights. 2] High low marking from 1H to 1M 3] Sweetspot 4] Spread and Candle Stick Timer 5] Background logo for branding- You can place the images at any zone of the chart you want 6] Profit and Loss 7] Days names (SUN MON TUE…) on the chart 8] High/low break notification
It estimates the net buying and selling pressure within each price bar by decomposing volume into approximate buy-side and sell-side components, then accumulates this delta over a configurable lookback window. The result is displayed as a color-coded histogram with smoothing moving averages and an integrated divergence detection system. Component 1: Delta Estimation Engine (CLV Method) Component 2: Cumulative Delta Calculation Component 3: Histogram Color Coding Component 4: Moving Averages (Fa
The indicator is a heads-up display (HUD) that consolidates three essential pieces of real-time trading information into a compact, corner-anchored overlay on your chart. It reads live account and market data but does not place, modify, or close any trades. All components update every 500 milliseconds via an internal timer, plus on every new tick and chart change event. Component 1: Current Price & Spread Display format: 2345.67 | Spread: 2.5 Component 2: Candle Timer Display format: 01:22:37
Delta Divergence •         Real-Time Market Conviction Tracking — Measures cumulative delta to reveal whether buyers or sellers are truly in control, cutting through price noise to show actual order flow dominance. •         Multi-Timeframe Confluence (30M / H1 / H4 / D1) — Validates lower timeframe signals against higher timeframe trends. When all timeframes align, confidence in the trade is significantly higher. •         Session Strength Percentage — Quantifies how far current delta has pulle
Key Features Dual Session Mode — Auto mode detects new calendar day automatically; Custom mode lets you define an exact HH:MM window with timezone offset for any market open (NY, London, Dubai, etc.) Live OR Formation Box — Highlighted box draws in real-time during the OR period, expanding as price makes new highs/lows, then freezes the moment the OR window closes Bias Fill — OR zone fills green if this session's midpoint is above the previous session's midpoint (bullish bias), red if below (bea
Filtro:
Nessuna recensione
Rispondi alla recensione