FVG Reaction Engine

FVG Reaction Engine

Precision Liquidity Reactions.
Institutional Logic.
Real-Time Confidence.

Overview

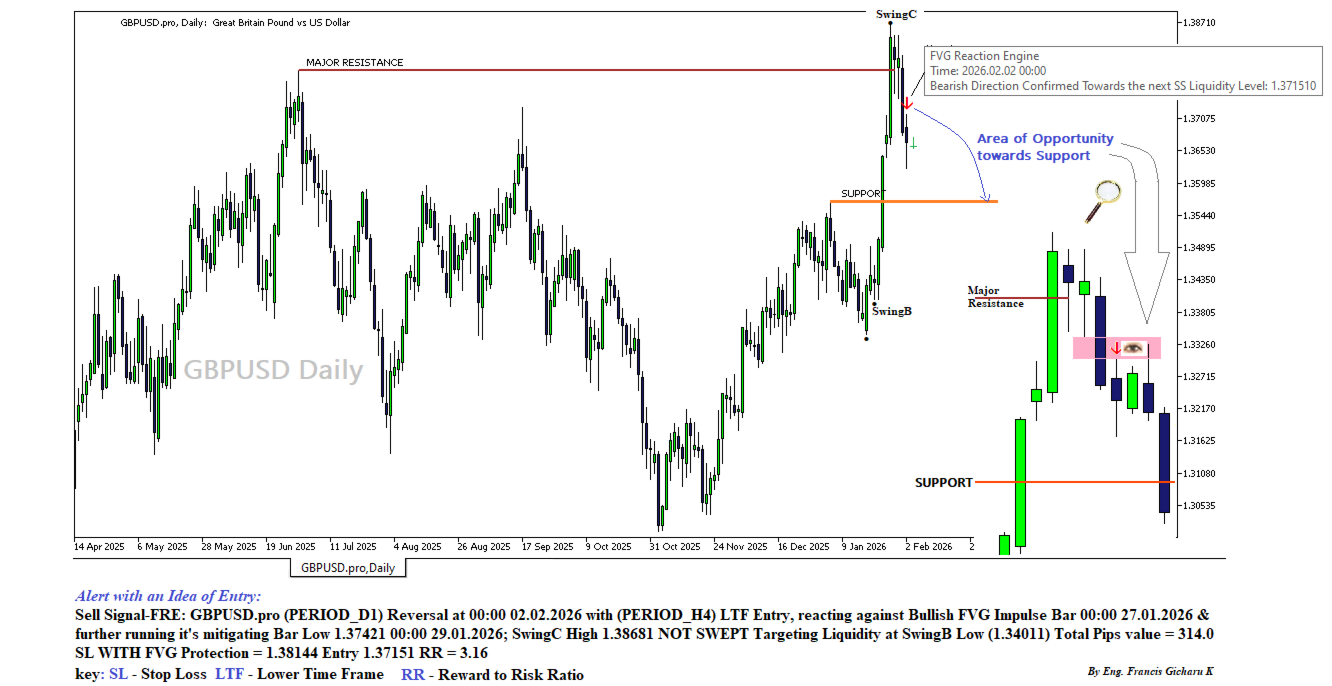
FVG Reaction Engine is an advanced market-structure intelligence system designed to identify, validate, and react to Fair Value Gaps (FVGs) with unmatched precision. Built for traders who demand clarity over noise, it focuses on true price reactions, not just gap appearances.

Unlike traditional FVG indicators that flood charts with static zones, FVG Reaction Engine analyzes how price behaves inside and around the gap, revealing where institutional intent is confirmed.

Markets don’t respect every gap — they respect reaction quality.

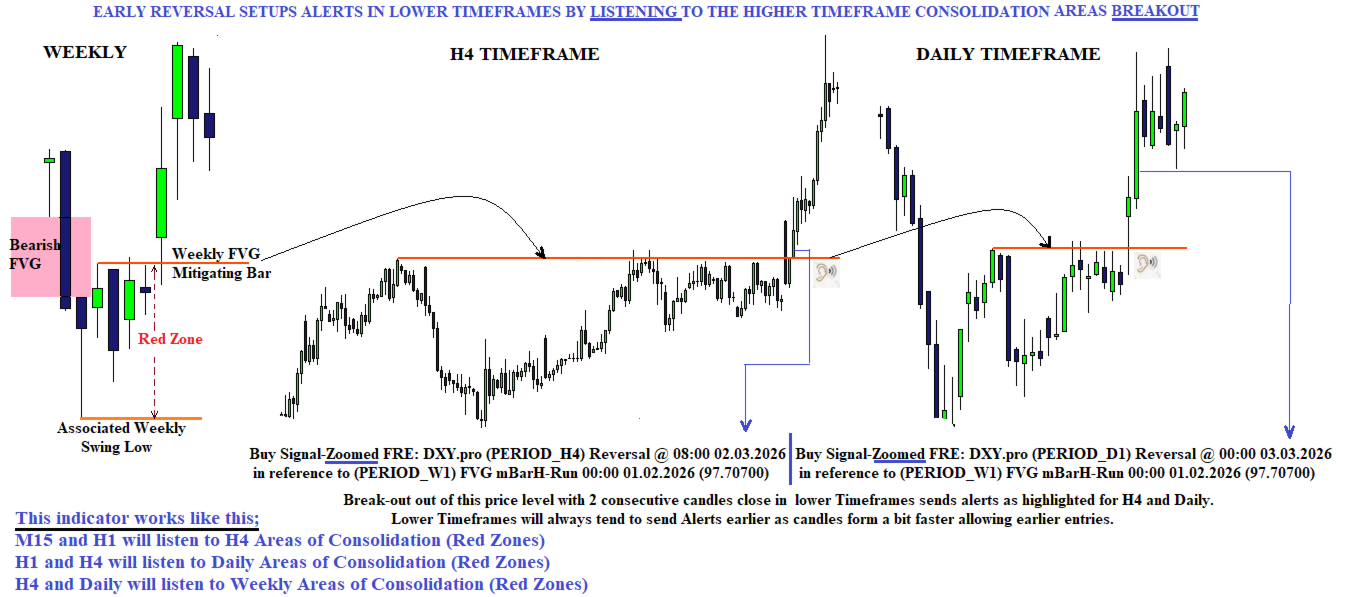
At its core, the engine operates on a multi-timeframe reaction model for trend reversals, where higher timeframes define opportunity and lower timeframes confirm execution.

Higher timeframe consolidation zones (Red Zones) represent areas of institutional positioning and liquidity buildup. Once price interacts with these zones, the engine tracks how price reacts within them — particularly around the mitigation bar (mBar) and associated structure.

Lower timeframes then step in to detect early confirmation signals as price exits these zones, allowing traders to participate in moves sooner while remaining aligned with higher timeframe intent.

Key Principle:
Higher timeframes define the zone.
Lower timeframes confirm the reaction.

This creates a synchronized market view where:

Weekly and Daily establish key liquidity zones
H4, H1, and M15 detect early breakout and reaction behavior
Signals are triggered only after price proves intent through structure and confirmation

No clutter. No premature signals. Only confirmed reactions with structural backing.

The FVG Reaction Engine Advantage
🔍 Reaction-Based Validation

Only FVGs that show meaningful price interaction are considered valid. The engine monitors:

Entry precision
Depth of mitigation
Speed of rejection
Structural alignment
🧠 Smart Market Structure Logic

The engine integrates:

Liquidity sweeps (highs & lows)
Swing structure confirmation
Time-window relevance

This ensures signals align with institutional execution behavior, not retail assumptions.

⚡ Real-Time Signal Intelligence

FVG Reaction Engine delivers:

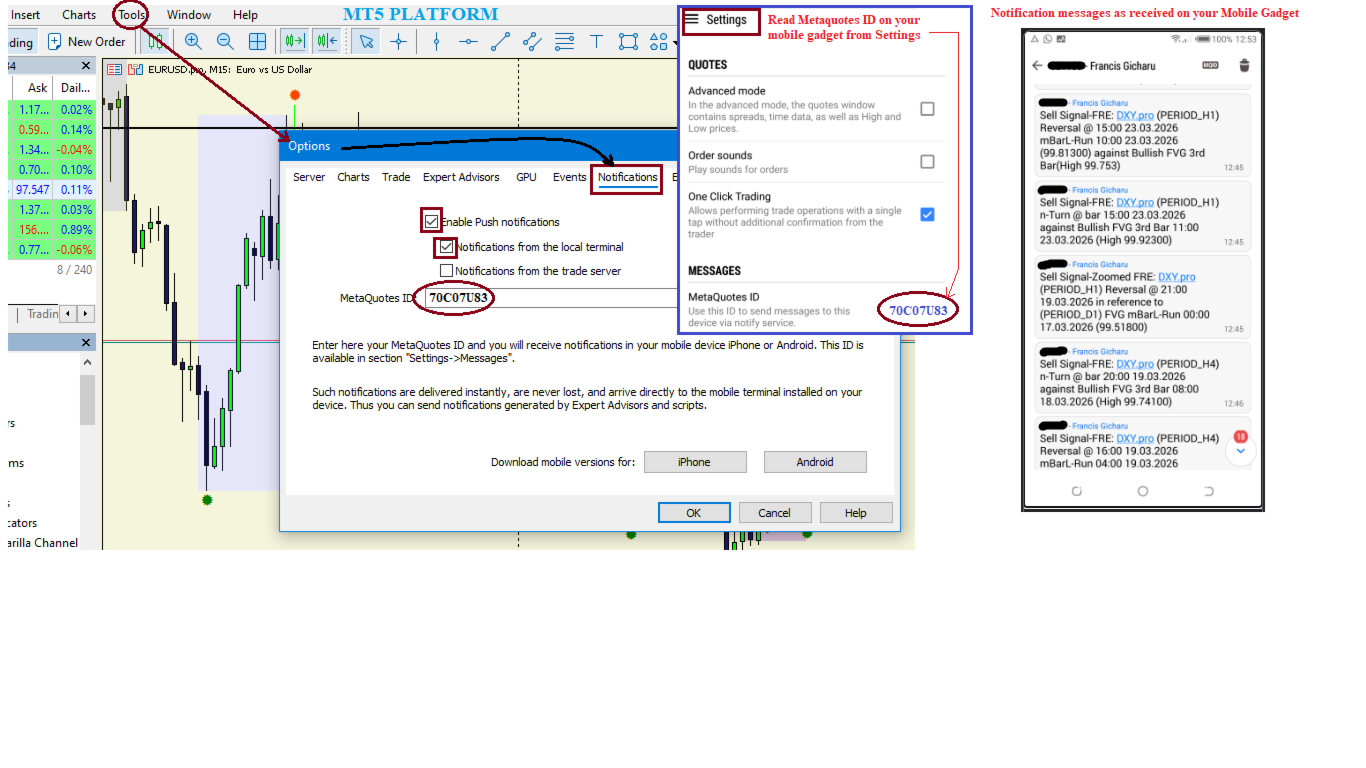
Instant reaction alerts
Clean visual confirmations
Zero repaint logic
Multi-timeframe adaptability

No hindsight. No curve fitting. Just live-market logic.

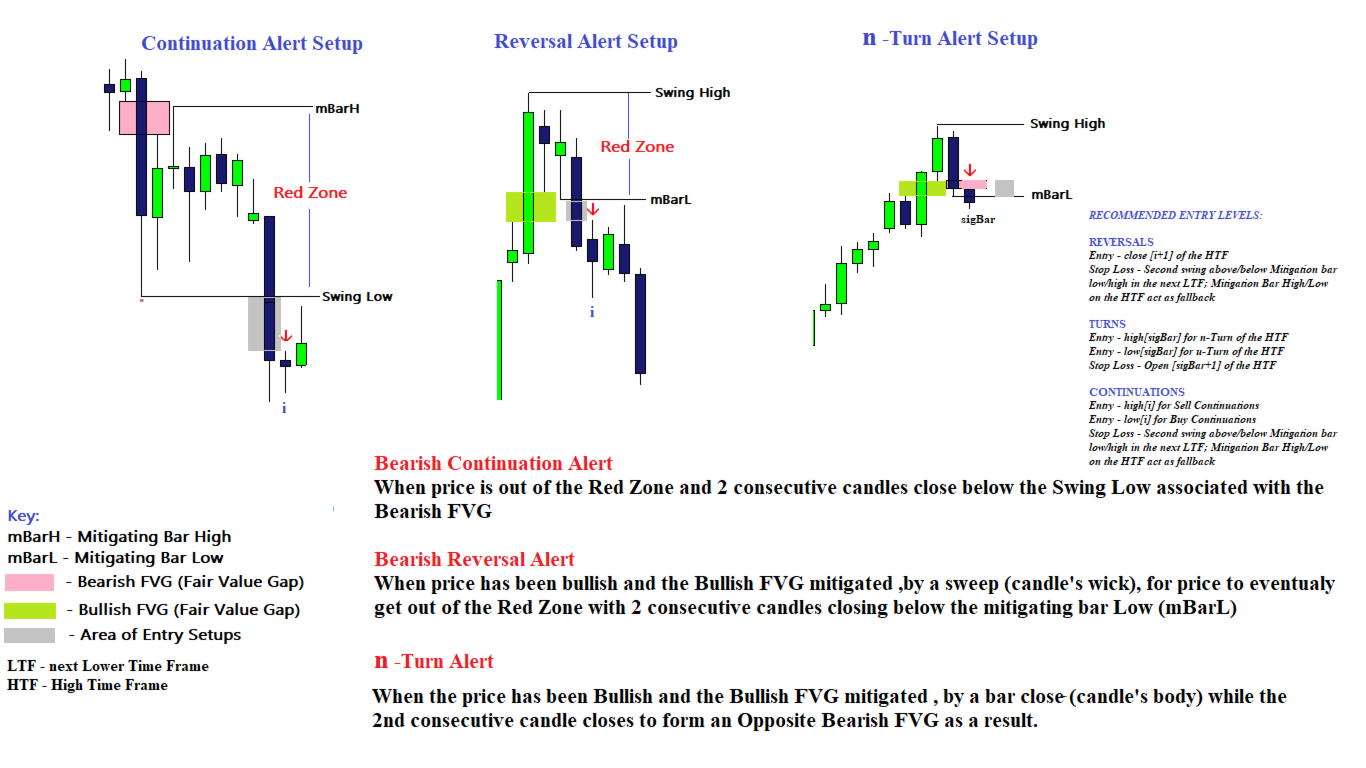
FVG Reaction Engine – Alert Logic Explained

Continuation • Reversal • n-Turn / u-Turn (Bearish & Bullish)

FVG Reaction Engine classifies market reactions into three institutional-grade scenarios, each available in bearish (red down arrow) and bullish (green up arrow) forms.

All alerts are reaction-based, meaning they only trigger after price proves intent, not at the moment an FVG simply appears.

1️⃣ Continuation Alert

🔴 Bearish Continuation Alert

Triggered when:

Price mitigates a Bearish FVG
Price exits the Red Zone (Area of Consolidation)
Two consecutive candles close below the swing low associated with the Bearish FVG
Market structure confirms continuation in the downside direction

➡ Indicates trend continuation after bearish FVG reaction

🟢 Bullish Continuation Alert

Triggered when:

Price mitigates a Bullish FVG
Price exits the Red Zone (Area of Consolidation)
Two consecutive candles close above the swing high associated with the Bullish FVG
Market structure confirms continuation in the upside direction

⬆ Green up-facing arrow confirms bullish continuation

2️⃣ Reversal Alert

🔴 Bearish Reversal Alert

Triggered when:

Price has been bullish
A Bullish FVG is mitigated
A liquidity sweep occurs inside the FVG
Price exits the Red Zone (Area of Consolidation) 
Two consecutive candles close below the mitigating bar low (mBarL) even on Lower Timeframes

➡ Signals bullish failure and bearish reversal intent
Alerts detected on Lower Timeframes in reference to Higher Timeframe send notifications but do not plot arrows.

🟢 Bullish Reversal Alert

Triggered when:

Price has been bearish
A Bearish FVG is mitigated
A liquidity sweep occurs inside the FVG
Price exits the Red Zone (Area of Consolidation)
Two consecutive candles close above the mitigating bar high (mBarH) even on Lower Timeframes

⬆ Green up-facing arrow confirms bearish failure and bullish reversal
Alerts detected on Lower Timeframes in reference to Higher Timeframe send notifications but do not plot arrows.

3️⃣ n-Turn Alert (Opposing FVG Formation)

🔴 Bearish n-Turn Alert

Triggered when:

Price has been bullish
A Bullish FVG is mitigated
The mitigating candle becomes part of a newly formed Bearish FVG

This marks a transition from bullish imbalance to bearish imbalance

➡ Represents a true institutional n-turn, not a simple pullback

🟢 Bullish u-Turn Alert

Triggered when:

Price has been bearish
A Bearish FVG is mitigated
The mitigating candle becomes part of a newly formed Bullish FVG

This confirms a structural shift from bearish to bullish imbalance

⬆ Green up-facing arrow signals a bullish u-turn

Alert Numbering Logic

Each alert notification includes a bar index reference, counted from right to left:

index 0 → current bar
index 1 → previous bar
index 2 → two bars back

In addition, the bar time is also included for clarity.

This allows precise mapping of alerts to execution candles, even on fast timeframes.

Why This Matters

FVG Reaction Engine:

❌ Does not trigger on raw FVG appearance
✅ Waits for reaction, structure, and confirmation
✅ Differentiates continuation vs reversal vs transition
✅ Works symmetrically for bullish and bearish markets

No repaint. No hindsight. No guesswork.

Who It’s Built For

📈 Smart Money Traders
🏦 Prop Firm Candidates
🧪 Strategy Developers
🔔 Alert-Driven Traders
🧠 Market Structure Analysts

If you trade liquidity and precision entries — this engine is built for you.

Key Features

✔ Reaction-confirmed FVGs only
✔ Configurable scan depth & time window
✔ Push, popup, and sound alerts
✔ Lightweight & performance-optimized
✔ Designed for real trading — not screenshots

What Makes It Different

FVG Reaction Engine does not predict.
It confirms.

It waits for price to prove intent, filtering out low-probability zones and leaving only actionable opportunities.

This dramatically improves:

Entry accuracy
Risk-to-reward consistency
Psychological confidence
Trading with Confidence

Markets move with purpose.
Liquidity leaves footprints.
Fair Value Gaps are only powerful when price reacts.

FVG Reaction Engine reveals those reactions — clearly, instantly, and objectively.

Conclusion

If you’re tired of cluttered charts, false FVGs, and late confirmations, it’s time to upgrade your edge.

FVG Reaction Engine
Built for traders who read the market — not indicators.
Prodotti consigliati
Order Book, known also as Market Book, market depth, Level 2, - is a dynamically updated table with current volumes of orders to buy and to sell specific financial instument at price levels near Bid and Ask. MetaTrader 5 provides the means for receiving market book from your broker, but in real time only, without access to its history. The indicator OrderBook Cumulative Indicator accumulates market book data online and visualizes them on the chart. In addition, the indicator can show the market
Basic information. To perform its work, the indicator takes data on volumes from a lower timeframe, builds Market Profiles for a higher timeframe and a histogram for the current timeframe. The indicator starts in several stages. In this case, messages like: "Build Source & Target TF. Step: …" are output to the log. The process can be accelerated by changing the input parameter Milliseconds between steps - the initialization speed. The final value of this parameter is always individual and is set
L'indicatore costruisce le quotazioni attuali, che possono essere confrontate con quelle storiche e su questa base fanno una previsione del movimento dei prezzi. L'indicatore ha un campo di testo per una rapida navigazione fino alla data desiderata. Opzioni: Simbolo - selezione del simbolo che visualizzerà l'indicatore; SymbolPeriod - selezione del periodo da cui l'indicatore prenderà i dati; IndicatorColor - colore dell'indicatore; HorisontalShift - spostamento delle virgolette disegnate d
Our new indicator is an important part of the Smart Money Concepts (SMC) system It uses a modern market vision and fast calculation methods. As a result, the trader has a complete picture of the trade at every moment in time, which makes the process of obtaining results easier and faster. Our new indicator displays the following important patterns:   Order Blocks. Imbalance – Fair Value Gap (FVG). Break Of Structures (BoS). Change of character (CHoCH). Equal highs & lows. Premium , Equilibrium
Haven Bar Replay — Il Tuo Simulatore di Trading Personale Ti presentiamo   Haven Bar Replay   – un simulatore professionale per il trading manuale e il test delle strategie. Questo strumento trasforma il tuo grafico MT5 in un player storico, permettendoti di vivere mesi di movimenti di mercato in pochi minuti. Scopri gli altri miei prodotti ->  CLICCA QUI . Vuoi imparare a fare trading con profitto ma non sei disposto ad aspettare ore affinché si formino i setup? Questo strumento è progettato p
FREE
A fair value gap (FVG) is a temporary price gap that occurs when the price of a stock or security is out of line with its fair value.   This gap is often caused by an imbalance between buyers and sellers. How it works Price imbalance When there is an imbalance between buyers and sellers, the price of a security can move too quickly. Price gap This creates an unadjusted area on the price chart, known as the fair value gap Price correction The price is often drawn back to the fair value gap, as i
Gioteen Volatility Index (GVI) - your ultimate solution to overcoming market unpredictability and maximizing trading opportunities. This revolutionary indicator helps you in lowering your losing trades due to choppy market movements. The GVI is designed to measure market volatility, providing you with valuable insights to identify the most favorable trading prospects. Its intuitive interface consists of a dynamic red line representing the volatility index, accompanied by blue line that indicate
Statistical Arbitrage Spread Generator for Cointegration [MT5] What is Pair Trading? Pair trading is a market-neutral strategy that looks to exploit the relative price movement between two correlated assets — instead of betting on the direction of the market. The idea? When two assets that usually move together diverge beyond a statistically significant threshold, one is likely mispriced. You sell the expensive one, buy the cheap one , and profit when they converge again. It’s a statistica
FREE
Prime Flow
Simon Draxler
DRX PRIME FLOW è un sistema di analisi di mercato autoadattivo progettato per visualizzare la struttura del mercato e i cambiamenti di volatilità direttamente sul grafico. Guida e Manuale: Clicca qui Invece della calibrazione manuale, questo sistema utilizza un algoritmo dinamico che si adatta alla volatilità dell'asset corrente in background. Funziona perfettamente su Oro, Cripto, Valute e Indici senza richiedere l'impostazione dei parametri. Caratteristiche Principali Zone Autoadattive: L'indi
Easy GOLD MT5
Franck Martin
3.88 (42)
Easy Gold is the latest addition to the BotGPT family. It is surprising and very powerful. It is ideal for beginners due to its simplicity.  There is absolutely nothing to do, it's 100% automated, simply indicate the percentage of risk you want to take per trade and the EA is ready. Whatever your capital, the EA takes care of everything. Optimized on (XAUUSD).  Unleash all the power with the professional version (AGI Gold) and its connection to the neural network, available in my store. My othe
FREE
BoxInside MT5
Evgeny Shevtsov
5 (4)
This indicator calculates the volume profile and places labels that correspond to the VAH, VAL and POC levels, for each candle individually. Indicator operation features The indicator works on the timeframes from M3 to MN, but it uses the history data of smaller periods: M1 - for periods from M3 to H1, M5 - for periods from H2 to H12, M30 - for the D1 period, H4 - for the W1 period, D1 - for the MN period. The color and location of the VAL, VAH and POC labels on the current candle are considere
FREE
Renko System
Marco Montemari
This indicator can be considered as a trading system. It offers a different view to see the currency pair: full timeless indicator, can be used for manual trading or for automatized trading with some expert advisor. When the price reaches a threshold a new block is created according to the set mode. The indicator beside the Renko bars, shows also 3 moving averages. Features renko mode median renko custom median renko 3 moving averages wicks datetime indicator for each block custom notification
Price Magnet — Price Density and Attraction Levels Indicator Price Magnet is a professional analytical tool designed to identify key support and resistance levels based on statistical Price Density. The indicator analyzes a specified historical period and detects price levels where the market spent the most time. These zones act as “magnets,” attracting price action or forming a structural base for potential reversals. Unlike traditional Volume Profile tools, Price Magnet focuses on price-time d
BOS and CHoCH Detector is an indicator designed to detect BOS (Break of Structure) and CHoCH (Change of Character) within the Smart Money Management strategy. It helps traders get a clearer view of the market on the chart and optimize their trading strategy. An additional advantage of this indicator is its color system: Green : signals a high probability of a buy opportunity. Red : signals a high probability of a sell opportunity. This tool is perfect for gaining clarity and confidence in your t
Every indicator has its advantages and disadvantages. Trending ones show good signals during a trend, but lag during a flat. Flat ones thrive in the flat, but die off as soon as a trend comes. All this would not be a problem, if it was easy to predict when a flat changes to a trend and when a trend changes to a flat, but in practice it is an extremely serious task. What if you develop such an algorithm, which could eliminate an indicator's flaws and enhance its strengths? What if such an algorit
The Hybrid Trend Impulse indicator is an advanced tool that combines modern approaches to trend and impulse analysis, offering unique capabilities for effective deposit management. Key advantages of the HybridTrendImpulse_indicator: Nonlinear dynamics: The method of interaction between opening prices forms a unique nonlinear model that is particularly sensitive to significant price fluctuations, increasing their significance and making the indicator ideal for working in high volatility conditio
ATR Line
Evgeny Levchenko
The indicator - "ATR Line" determines the current trend and gives signals to buy (green arrow to the top) or sell (red arrow to the bottom). The indicator calculation is based on the deviation of the average price of the instrument from its average true range - ATR. The moving average of prices is used to reduce "market noise". If the main line of the indicator - "ATR Line" is lower the instrument price chart, then the market is in a "bullish" trend. If the main line of the indicator is higher t
An ICT fair value gap is a trading concept that identifies market imbalances based on a three-candle sequence. The middle candle has a large body while the adjacent candles have upper and lower wicks that do not overlap with the middle candle. This formation suggests that there is an imbalance where buying and selling powers are not equal. Settings Minimum size of FVG (pips) -> FVGs less than the indicated pips will be not be drawn Show touched FVGs Normal FVG color -> color of FVG that hasn't
FREE
Traders Dynamic Index (TDI) - Overview The Traders Dynamic Index (TDI) is a versatile indicator based on the RSI oscillator.  It helps traders identify market conditions and potential reversals. The TDI combines multiple indicators into one, providing a comprehensive view of market dynamics. Components: - Green line: RSI Price Line - Red line: Trade Signal Line - Blue fill: Volatility Band - Yellow line: Market Base Line Visual Signals: 1. Trend Direction:     - Immediate:       - Green over
The Copy Trading History Analyzer is a powerful and easy-to-use indicator that displays real trading history directly on your chart. Instead of relying on the default MetaTrader 5 history tab, this tool provides a clear and visual representation of trades, helping you analyze performance and better understand any trading strategy. Whether you are reviewing your own trades or analyzing a signal provider, this indicator allows you to see exactly how trades were executed — directly on the chart. Ke
Panoramica Candle Timer Countdown Pro mostra un conto alla rovescia fluido e preciso fino alla chiusura della candela corrente con un arco circolare di progresso. Caratteristiche Conto alla rovescia preciso Arco circolare (Ring o Filled Pie) 6 posizioni disponibili 3 schemi colore Evidenziazione finale Avvisi nuova candela Basso consumo CPU Installazione Scaricare dal MQL5 Market Applicare al grafico Configurare le impostazioni Compatibilità MetaTrader 5 Build 2500+ Tutti i timeframe
Daily Variation Indicator Daily Variation Indicator shows the percentage difference between the current price and the previous day close. The indicator displays the daily market movement directly on the chart, allowing traders to quickly identify whether the market is moving up or down during the current trading session. It is designed to be lightweight, minimal, and highly configurable while providing clear information about the daily price variation. Features • Displays daily percentage variat
Offer 249 down from 350 for the next 1 copies. then back to 350 $ Are you tired of using outdated indicators that leave you guessing where to set your profit targets? Look no further than the AK CAP Opening Range Breakout Indicator. This powerful tool is backed by a US patent and has already helped countless traders pass funded challenges like FTMO. We use it daily on our prop traders and internal funds, and now it's available to you as well. The calculation behind the indicator is incredibly a
http://www.tradepositive.lat ALGO Smart Flow Structure Indicator The ALGO Smart Flow Structure Indicator is designed for serious traders who use objective Market structure. Forget noise and slow indicators; this tool provides you with a crystal-clear, unambiguous view of structural breakouts across all timeframes. Based on the rigorous rules of the ALGO Smart Flow methodology, the indicator filters out internal structure and only shows you the Major Structural Points (Swing Points) , ensuri
FREE
Support: Profit Smasher 24/7 AI Assistant Disclaimer Liquidity Mapper Pro is an analytical tool for educational and informational purposes only. It does not provide financial advice or guaranteed signals. All trading carries risk, including potential loss of capital. Past performance does not guarantee future results. You are solely responsible for your trading decisions.
Haven Volume Profile
Maksim Tarutin
4.56 (9)
Haven Volume Profile è un indicatore multifunzionale per l'analisi del profilo di volume che aiuta a identificare i livelli di prezzo chiave basati sulla distribuzione del volume di scambi. È stato progettato per i trader professionisti che desiderano comprendere meglio il mercato e identificare i punti di ingresso e di uscita cruciali per le loro operazioni. Altri prodotti ->  QUI Caratteristiche principali: Calcolo del Point of Control (POC) - il livello con la massima attività commerciale, ut
FREE
ICONIC TITAN SIGNAL v1.6 “Don’t trade like the crowd – trade like a legend.” The ICONIC TITAN SIGNAL is more than just an indicator. It’s your personal mentor. Your scanner. Your signal provider. A hybrid masterpiece of market experience, mathematical logic, and institutional precision – crafted for those who aim not just to trade, but to dominate. What does the ICONIC TITAN do? It filters 24/7 through the chaos of the four most relevant markets in the world: XAUUSD EURUSD BTCUSD NAS100
High Low Open Close
Alexandre Borela
4.98 (44)
Se ti piace questo progetto, lascia una recensione a 5 stelle. Questo indicatore disegna i prezzi aperti, alti, bassi e di chiusura per i specificati periodo e può essere regolato per un determinato fuso orario. Questi sono livelli importanti guardati da molti istituzionali e professionali commercianti e può essere utile per voi per conoscere i luoghi dove potrebbero essere più attivo. I periodi disponibili sono: Giorno precedente. Settimana precedente. Mese precedente. Precedente trimestre. A
FREE
DoctorEdge V-LINE (Pump it & Dump it) Strategy Pro Confirms trend direction using smart momentum logic and key price behavior How It Works DoctorEdge V-LINE is a smart visual indicator designed to detect trend impulses and confirm their strength based on how price reacts around certain dynamic zones. Buy Trend: When price reaches level -20 , the line turns green , signaling a potential buy . If price breaks above level 0 and the line stays green, the uptrend is confirmed . If price doe
Beauty Trend
Nikolay Kositsin
Простой индикатор тренда в NRTR виде с отрисовкой линий стоплосса и тейпрофита, цвет и направление движения которых определяются действующим трендом. Индикатор имеет возможность подавать алерты, отправлять почтовые сообщения и push-сигналы при смене направления тренда. Следует учесть что значение входного параметра индикатора Deviation of the take profit line in points для каждого финансового актива на каждом таймфрейме   необходимо подбирать индивидуально!
Gli utenti di questo prodotto hanno anche acquistato
Divergence Bomber
Ihor Otkydach
4.9 (86)
Ogni acquirente dell’indicatore riceverà inoltre gratuitamente: L’utilità esclusiva “Bomber Utility”, che gestisce automaticamente ogni operazione, imposta i livelli di Stop Loss e Take Profit e chiude le posizioni secondo le regole della strategia I file di configurazione (set file) per adattare l’indicatore a diversi asset I set file per configurare il Bomber Utility in tre modalità: “Rischio Minimo”, “Rischio Bilanciato” e “Strategia di Attesa” Una guida video passo-passo per installare, conf
Azimuth Pro
Ottaviano De Cicco
5 (6)
Azimuth Pro V2: Synthetic Fractal Structure and Confirmed Entries for MT5 Overview Azimuth Pro is a multi-level swing structure indicator by Merkava Labs . Four nested swing layers, swing-anchored VWAP, ABC pattern detection, three-timeframe structural filtering, and closed-bar confirmed entries — one chart, one workflow from micro-swings to macro-cycles. This is not a blind signal product. It is a structure-first workflow for traders who care about location, context, and timing. V2 Launch Offe
Quantum TrendPulse
Bogdan Ion Puscasu
5 (23)
Ecco   Quantum TrendPulse   , lo strumento di trading definitivo che combina la potenza di   SuperTrend   ,   RSI   e   Stocastico   in un unico indicatore completo per massimizzare il tuo potenziale di trading. Progettato per i trader che cercano precisione ed efficienza, questo indicatore ti aiuta a identificare con sicurezza le tendenze di mercato, i cambiamenti di momentum e i punti di entrata e uscita ottimali. Caratteristiche principali: Integrazione SuperTrend:   segui facilmente l'andame
OmniSync Projection
Antonio-alin Teculescu
5 (1)
Chronos Fractal Engine is an innovative price projection indicator for MetaTrader 5, designed to transform your technical analysis by intelligently identifying and projecting historical price patterns. Built upon an advanced correlation algorithm and the fractal principles of the market, this powerful tool visualizes potential future price movements, giving you a unique edge in your trading decisions. What is Chronos Fractal Engine? At its core, the Chronos Fractal Engine employs a sophisticat
Presentazione       Quantum Breakout PRO   , l'innovativo indicatore MQL5 che sta trasformando il modo in cui scambi le zone di breakout! Sviluppato da un team di trader esperti con un'esperienza di trading di oltre 13 anni,       Quantum Breakout PRO       è progettato per spingere il tuo viaggio di trading a nuovi livelli con la sua strategia innovativa e dinamica della zona di breakout. Quantum Breakout Indicator ti fornirà frecce di segnalazione sulle zone di breakout con 5 zone target di
CGE Trading Suite
Carl Gustav Johan Ekstrom
5 (2)
Institutional-Grade Analytics for MT5 C GE Trading Suite delivers the analytical edge typically reserved for professional trading desks. The platform integrates a full suite of analytical tools into one seamless workflow: dynamic grid mapping, liquidity behavior analysis, ECM, trend lines, MIDAS, trade cycles, and directional channel projections. Together, these provide a unified view of market structure and momentum. Directional clarity is further enhanced by the capital flow index, which meas
Grabber System MT5
Ihor Otkydach
4.83 (23)
Ti presento un eccellente indicatore tecnico: Grabber, che funziona come una strategia di trading "tutto incluso", pronta all’uso. In un solo codice sono integrati strumenti potenti per l’analisi tecnica del mercato, segnali di trading (frecce), funzioni di allerta e notifiche push. Ogni acquirente di questo indicatore riceve anche gratuitamente: L’utility Grabber: per la gestione automatica degli ordini aperti Video tutorial passo dopo passo: per imparare a installare, configurare e utilizzare
Btmm state engine pro
Garry James Goodchild
5 (4)
BTMM State Engine Pro is a MetaTrader 5 indicator for traders who use the Beat The Market Maker approach: Asian session context, kill zone timing, level progression, peak formation detection, and a multi-pair scanner from a single chart. It combines cycle state logic with a built-in scanner dashboard so you do not need the same tool on many charts at once. What it does Draws the Asian session range; session times can follow broker server offset or be set in inputs. Tracks level progression (L
RelicusRoad Pro: Sistema Operativo Quantitativo di Mercato 70% DI SCONTO ACCESSO A VITA (TEMPO LIMITATO) - UNISCITI A 2.000+ TRADER Perché la maggior parte dei trader fallisce anche con indicatori "perfetti"? Perché operano su Singoli Concetti isolati. Un segnale senza contesto è una scommessa. Per vincere serve CONFLUENZA . RelicusRoad Pro non è un semplice indicatore. È un Ecosistema Quantitativo completo . Mappa la "Fair Value Road", distinguendo tra rumore e rotture strutturali. Smetti di in
ARICoins
Temirlan Kdyrkhan
ARICoin is a powerful trading companion designed to generate high-probability entry signals with dynamic TP/SL/DP levels based on volatility. Built-in performance tracking shows win/loss stats, PP1/PP2 hits, and success rates all updated live. Key Features: Buy/Sell signals with adaptive volatility bands Real-time TP/SL/DP levels based on ATR Built-in MA Filter with optional ATR/StdDev volatility Performance stats panel (Success, Profit/Loss, PP1/PP2) Alerts via popup, sound, push, or email Cust
ARIPoint
Temirlan Kdyrkhan
ARIPoint is a powerful trading companion designed to generate high-probability entry signals with dynamic TP/SL/DP levels based on volatility. Built-in performance tracking shows win/loss stats, PP1/PP2 hits, and success rates all updated live. Key Features: Buy/Sell signals with adaptive volatility bands Real-time TP/SL/DP levels based on ATR Built-in MA Filter with optional ATR/StdDev volatility Performance stats panel (Success, Profit/Loss, PP1/PP2) Alerts via popup, sound, push, or email Cu
La Master Edition è uno strumento analitico di livello professionale progettato per visualizzare la struttura del mercato attraverso l'obiettivo del volume e del flusso di denaro. A differenza degli indicatori di volume standard, questo strumento visualizza un Profilo di Volume Giornaliero direttamente sul tuo grafico, permettendoti di vedere esattamente dove si è verificata la scoperta dei prezzi e dove è posizionato il "denaro intelligente". Questa Master Edition è progettata per chiarezza e v
Innanzitutto, vale la pena sottolineare che questo Strumento di Trading è un Indicatore Non-Ridipingente, Non-Ridisegnante e Non-Laggante, il che lo rende ideale per il trading professionale. Corso online, manuale utente e demo. L'Indicatore Smart Price Action Concepts è uno strumento molto potente sia per i nuovi che per i trader esperti. Racchiude più di 20 utili indicatori in uno solo, combinando idee di trading avanzate come l'Analisi del Trader del Circolo Interno e le Strategie di Tradin
Gartley Hunter Multi
Siarhei Vashchylka
5 (11)
Gartley Hunter Multi - An indicator for searching for harmonic patterns simultaneously on dozens of trading instruments and on all possible timeframes. Manual (Be sure to read before purchasing) | Version for MT4 Advantages 1. Patterns: Gartley, Butterfly, Shark, Crab. Bat, Alternate Bat, Deep Crab, Cypher 2. Simultaneous search for patterns on dozens of trading instruments and on all possible timeframes 3. Search for patterns of all possible sizes. From the smallest to the largest 4. All fou
Bill Williams Advanced
Siarhei Vashchylka
5 (11)
Bill Williams Advanced is designed for automatic chart analysis using Bill Williams' "Profitunity" system. The indicator analyzes four timeframes at once. Manual (Be sure to read before purchasing) Advantages 1. Analyzes the chart using Bill Williams' "Profitunity" system. Signals are displayed in a table in the corner of the screen and on the price chart. 2. Finds all known AO and AC signals, as well as zone signals. Equipped with a trend filter based on the Alligator. 3. Finds "Divergence Bar
TPA True Price Action indicator reveals the true price action of the market makers through 100% non-repainting signals strictly at the close of a candle! TPA shows entries and re-entries, every time the bulls are definitely stronger than the bears and vice versa. Not to confuse with red/green candles. The shift of power gets confirmed at the earliest stage and is ONE exit strategy of several. There are available now two free parts of the TPA User Guide for our customers. The first "The Basics"
RFI levels PRO MT5
Roman Podpora
3.67 (3)
L'indicatore mostra accuratamente i punti di inversione e le zone di ritorno dei prezzi in cui il       Principali attori   . Vedi dove si formano le nuove tendenze e prendi decisioni con la massima precisione, mantenendo il controllo su ogni operazione. VERSION MT4     -    Rivela il suo massimo potenziale se combinato con l'indicatore   TREND LINES PRO Cosa mostra l'indicatore: Strutture di inversione e livelli di inversione con attivazione all'inizio di un nuovo trend. Visualizzazione dei li
AriX
Temirlan Kdyrkhan
1 (4)
AriX Indicator for MT5 A powerful trend-following and signal-evaluation tool AriX is a custom MT5 indicator that combines Moving Averages and ATR-based risk/reward logic to generate clear buy/sell signals. It visualizes dynamic SL/TP levels, evaluates past trade outcomes, and displays win/loss statistics in a clean on-chart panel. Key features include: Buy/Sell signals based on MA crossovers ATR-based SL/TP1/TP2/TP3 levels with visual lines and labels Signal outcome tracking with real-time stat
Advanced Supply Demand MT5
Bernhard Schweigert
4.53 (15)
La migliore soluzione per qualsiasi principiante o trader esperto! Questo indicatore è uno strumento di trading unico, di alta qualità e conveniente perché abbiamo incorporato una serie di funzionalità proprietarie e una nuova formula. Con questo aggiornamento, sarai in grado di mostrare fusi orari doppi. Non solo potrai mostrare una TF più alta, ma anche entrambe, la TF del grafico, PIÙ la TF più alta: SHOWING NESTED ZONES. Tutti i trader di domanda di offerta lo adoreranno. :) Informazioni imp
Meravith MT5
Ivan Stefanov
5 (1)
Strumento per market maker. Meravith: Analizzerà tutti i timeframe e mostrerà il trend attualmente in corso. Evidenzierà le zone di liquidità (equilibrio dei volumi) dove i volumi rialzisti e ribassisti sono uguali. Mostrerà tutti i livelli di liquidità dei diversi timeframe direttamente sul grafico. Genererà e presenterà un’analisi di mercato testuale a scopo di riferimento. Calcolerà obiettivi, livelli di supporto e punti di stop-loss in base al trend attuale. Calcolerà il rapporto rischio/ren
SignalTech MT5 is a trading system for EURUSD, USDCHF, USDJPY, AUDUSD, NZDUSD, EURJPY, AUDJPY, NZDJPY, CADJPY H2 and H3 Timeframe.  It can generate signals with Buy/Sell Arrows and Pop-Up/Sound Alerts. Each signal has clear Entry and Stop Loss levels, which should be automatically flagged on the chart, as well as potential Targets 1, 2, and 3. The Entry and TP levels are fixed after the trade is taken. The exit level is dynamic. If there are signs of a potential short-term trend reversal, the
Berma Bands
Muhammad Elbermawi
5 (8)
L'indicatore Berma Bands (BBs) è uno strumento prezioso per i trader che cercano di identificare e capitalizzare i trend di mercato. Analizzando la relazione tra il prezzo e le BBs, i trader possono discernere se un mercato è in una fase di trend o di range. Visita il [ Berma Home Blog ] per saperne di più. Le Berma Bands sono composte da tre linee distinte: la Upper Berma Band, la Middle Berma Band e la Lower Berma Band. Queste linee sono tracciate attorno al prezzo, creando una rappresentazion
Omniview ICT Dashboard
Kayode Michael Oyetunde
Omniview ICT Dashboard Maîtrisez le Flux Institutionnel. Maîtrisez le Marché. Trouver une configuration « A+ » nécessite trois éléments : le Biais (Bias), la Liquidité (Liquidity) et le Déplacement (Displacement) . La plupart des traders échouent parce qu'ils se perdent dans le bruit d'une seule unité de temps ou se laissent distraire par de « faux » mouvements. Le Omniview ICT Dashboard est votre lentille institutionnelle. Il scanne l'ensemble du marché pour identifier où l'Argent Intelligent (
ZIVA Signal Intelligence
Hassan Abdullah Hassan Al Balushi
ZIVA Signal Intelligence An Adaptive, Modular Market Intelligence System ZIVA Signal Intelligence is not positioned as a conventional trading indicator. It is a fully integrated, proprietary market intelligence system engineered to deliver structured, high-precision interpretation of price behavior within a controlled analytical environment. Developed through an independent architectural approach, ZIVA does not rely on, derive from, or replicate existing indicators. It represents a standalone
PZ Swing Trading MT5
PZ TRADING SLU
5 (5)
Protect against whipsaws: revolutionize your swing trading approach Swing Trading is the first indicator designed to detect swings in the direction of the trend and possible reversal swings. It uses the baseline swing trading approach, widely described in trading literature. The indicator studies several price and time vectors to track the aggregate trend direction and detects situations in which the market is oversold or overbought and ready to correct. [ Installation Guide | Update Guide | Tro
Trend Forecaster
Alexey Minkov
5 (7)
12% OFF EASTER SALE The Trend Forecaster indicator utilizes a unique proprietary algorithm to determine entry points for a breakout trading strategy. The indicator identifies price clusters, analyzes price movement near levels, and provides a signal when the price breaks through a level. The Trend Forecaster indicator is suitable for all financial assets, including currencies (Forex), metals, stocks, indices, and cryptocurrencies. You can also adjust the indicator to work on any time frames, alt
Volatility Trend System - è un sistema di trading che fornisce segnali per le entrate. Il sistema di volatilità fornisce segnali lineari e puntuali nella direzione del trend, nonché segnali per uscirne, senza ridisegnare o ritardi. L'indicatore di tendenza monitora la direzione del trend a medio termine, mostra la direzione e il suo cambiamento. L'indicatore del segnale si basa sui cambiamenti della volatilità e mostra gli ingressi nel mercato. L'indicatore è dotato di diversi tipi di avvisi. P
Trend Lines PRO MT5
Roman Podpora
5 (1)
LINEE DI TENDENZA PRO  Aiuta a capire dove il mercato sta realmente cambiando direzione. L'indicatore mostra reali inversioni di tendenza e punti in cui i principali operatori rientrano. Vedi   Linee BOS   Cambiamenti di tendenza e livelli chiave su timeframe più ampi, senza impostazioni complesse o rumore inutile. I segnali non vengono ridisegnati e rimangono sul grafico dopo la chiusura della barra. VERSIONE MT4   -   Svela il suo massimo potenziale se abbinato all'indicatore   RFI LEVELS PRO
Ziva LSE System
Hassan Abdullah Hassan Al Balushi
ZIVA LSE System A Professional Liquidity & Structure Execution Framework Executive Overview ZIVA LSE System is a professionally engineered analytical framework designed to interpret market behavior through structural logic and liquidity dynamics. It is not positioned as a conventional indicator. Rather, it functions as a structured execution environment that organizes price action into a clear, disciplined decision-making model. The system is built to deliver consistency, clarity, and controlle
SunSignal ML — AI Gold Signals with Multi-Timeframe Confluence SunSignal ML is an advanced AI-powered signal indicator purpose-built for XAUUSD gold trading. It combines a proprietary adaptive trend algorithm with six machine learning models trained on confirmed price pivots to produce high-confidence entry signals with multi-timeframe validation. The indicator runs efficiently on M1, M5 and M15 timeframes and is designed for traders who want precision entries guided by data rather than guesswor
Altri dall’autore
HighProb Setup Finder
Francis Gicharu Kagwi
HighProb Setup Finder Developer: GichSoft 2025 Overview The HighProb Setup Finder is a precision-engineered market structure intelligence tool that visually reveals order flow transitions and reversal footprints directly on your chart. It detects liquidity sweeps — where price grabs liquidity above or below a previous swing before reversing to target the opposite side. This helps traders identify institutional footprints and anticipate the next high-probability setup with confidence. Cor
Overview All in One Swing Points is a precision swing detection indicator that automatically plots three levels of market swing structures—from the strictest 3-bar formations to long-term turning points—all in one visual layer. This tool gives traders a clear, multi-timeframe perspective on price structure shifts, making it ideal for identifying market reversals, liquidity sweeps, and structure breaks with minimal clutter. Key Features a. 3 Swing Levels in One Indicator Strict 3-Bar S
Filtro:
Nessuna recensione
Rispondi alla recensione